Multi-Touch Attribution Explained: How to Measure What Really Drives Conversions
Sarah Moss
February 12, 2026
19
minutes read
Most marketers can tell their attribution is off; they just can’t always prove where it’s breaking, or what it’s costing them in budget decisions. In this article, you’ll learn how multi-touch attribution works, how to choose between models and measurement methods, and how to use MTA in a privacy-first world without treating it like a verdict.
Customer journeys are now fragmented across devices, channels, and walled gardens. People might discover you on TikTok, compare on Google, read reviews on mobile, come back through email, and finally convert after a retargeting impression or a branded search. In that reality, MTA marketing is a way to make multi touch attribution usable in the real world—where there isn’t one clean path and there isn’t one platform that sees everything.
Multi-touch attribution (MTA) exists to answer a practical question: Which interactions actually contributed to conversion, and how much credit should each get? It won’t make measurement perfect (nothing will), but it can reduce the most common distortions that push teams toward the wrong budget allocation and the wrong optimizations.
💡 For more context on how privacy and platform changes are reshaping measurement signals, see AI Digital’s view on operating in a cookieless environment.
What is multi-touch attribution (MTA)?
Multi-touch attribution (MTA) is a measurement approach that assigns fractional credit to multiple marketing touchpoints a person interacted with before converting—rather than giving 100% of credit to a single moment (like the first click or last click).
A useful way to think about it:
Single-touch answers: “What was the one most recent (or earliest) measurable interaction?”
MTA answers: “How did the sequence of interactions work together to produce the outcome?”
In practice, MTA helps you evaluate multichannel attribution across paid, owned, and earned media—especially when your buyers don’t convert immediately and your “assist” channels are doing real work.
⚡Attribution isn’t about finding the last click. It’s about understanding what actually moved the buyer.
Why single-touch attribution no longer works
Single-touch models break down because they reward what’s easiest to observe, not what’s most influential.
⚡ The journey keeps multiplying: McKinsey found B2B customers use an average of 10 interaction channels in their buying journey (up from 5 in 2016). If you reward only one touch, you’re ignoring how people actually decide.
Here’s what typically goes wrong:
They overweight “closer” channels. Last-click tends to over-credit branded search, retargeting, and lower-funnel placements because those touchpoints often happen right before conversion.
They undercount upper-funnel and mid-funnel influence. Video, CTV, creator, podcast, PR, and even high-performing prospecting often show up as “assists,” not closers. Single-touch models treat those as optional, even when they’re doing the hard work of creating demand.
They ignore sequence and saturation. Two campaigns can produce the same last click, but very different journeys:
Journey A: one exposure, quick conversion
Journey B: 12 exposures across three channels, then conversion
Last-click treats them the same. Your budget shouldn’t.
⚡ Same last click, wildly different story. If your model can’t tell those two apart, your budget will keep repeating yesterday’s mistakes.
They fall apart under privacy constraints and platform walls. When identifiers and cross-site tracking are limited, the “final measurable interaction” becomes even more arbitrary. Measurement gaps don’t remove influence—they just hide it.
How MTA differs from last-click and first-click models
Last-click and first-click are easy to explain, which is exactly why they stick around. They give you a single “winner” to point to, a clean number to report, and a fast way to compare channels. The problem is that simplicity comes from discarding most of the journey. If you’re running paid social, search, email, affiliates, and even a bit of CTV, you’re rarely dealing with one decisive interaction. You’re dealing with sequences: touches that introduce the brand, touches that build confidence, and touches that nudge someone over the line.
So before we get into how MTA splits credit, it helps to be clear about what the common single-touch models are actually doing. They’re not “wrong,” but they’re narrow. They answer one question well, then quietly distort everything else.
So—
Last-click attribution gives all credit to the final tracked interaction. It’s simple, but it’s structurally biased toward bottom-funnel.
First-click attribution gives all credit to the first tracked interaction. It can be useful for awareness analysis, but it often over-credits discovery channels even when nurturing did the heavy lifting.
MTA differs in two key ways:
It distributes credit across multiple steps (not just one).
It makes the model choice explicit: you decide the logic (rule-based) or let data determine weighting (algorithmic).
💡 If you want a KPI lens for interpreting MTA outputs (so you don’t optimize to pretty proxy metrics), AI Digital’s KPI breakdown is a helpful companion.
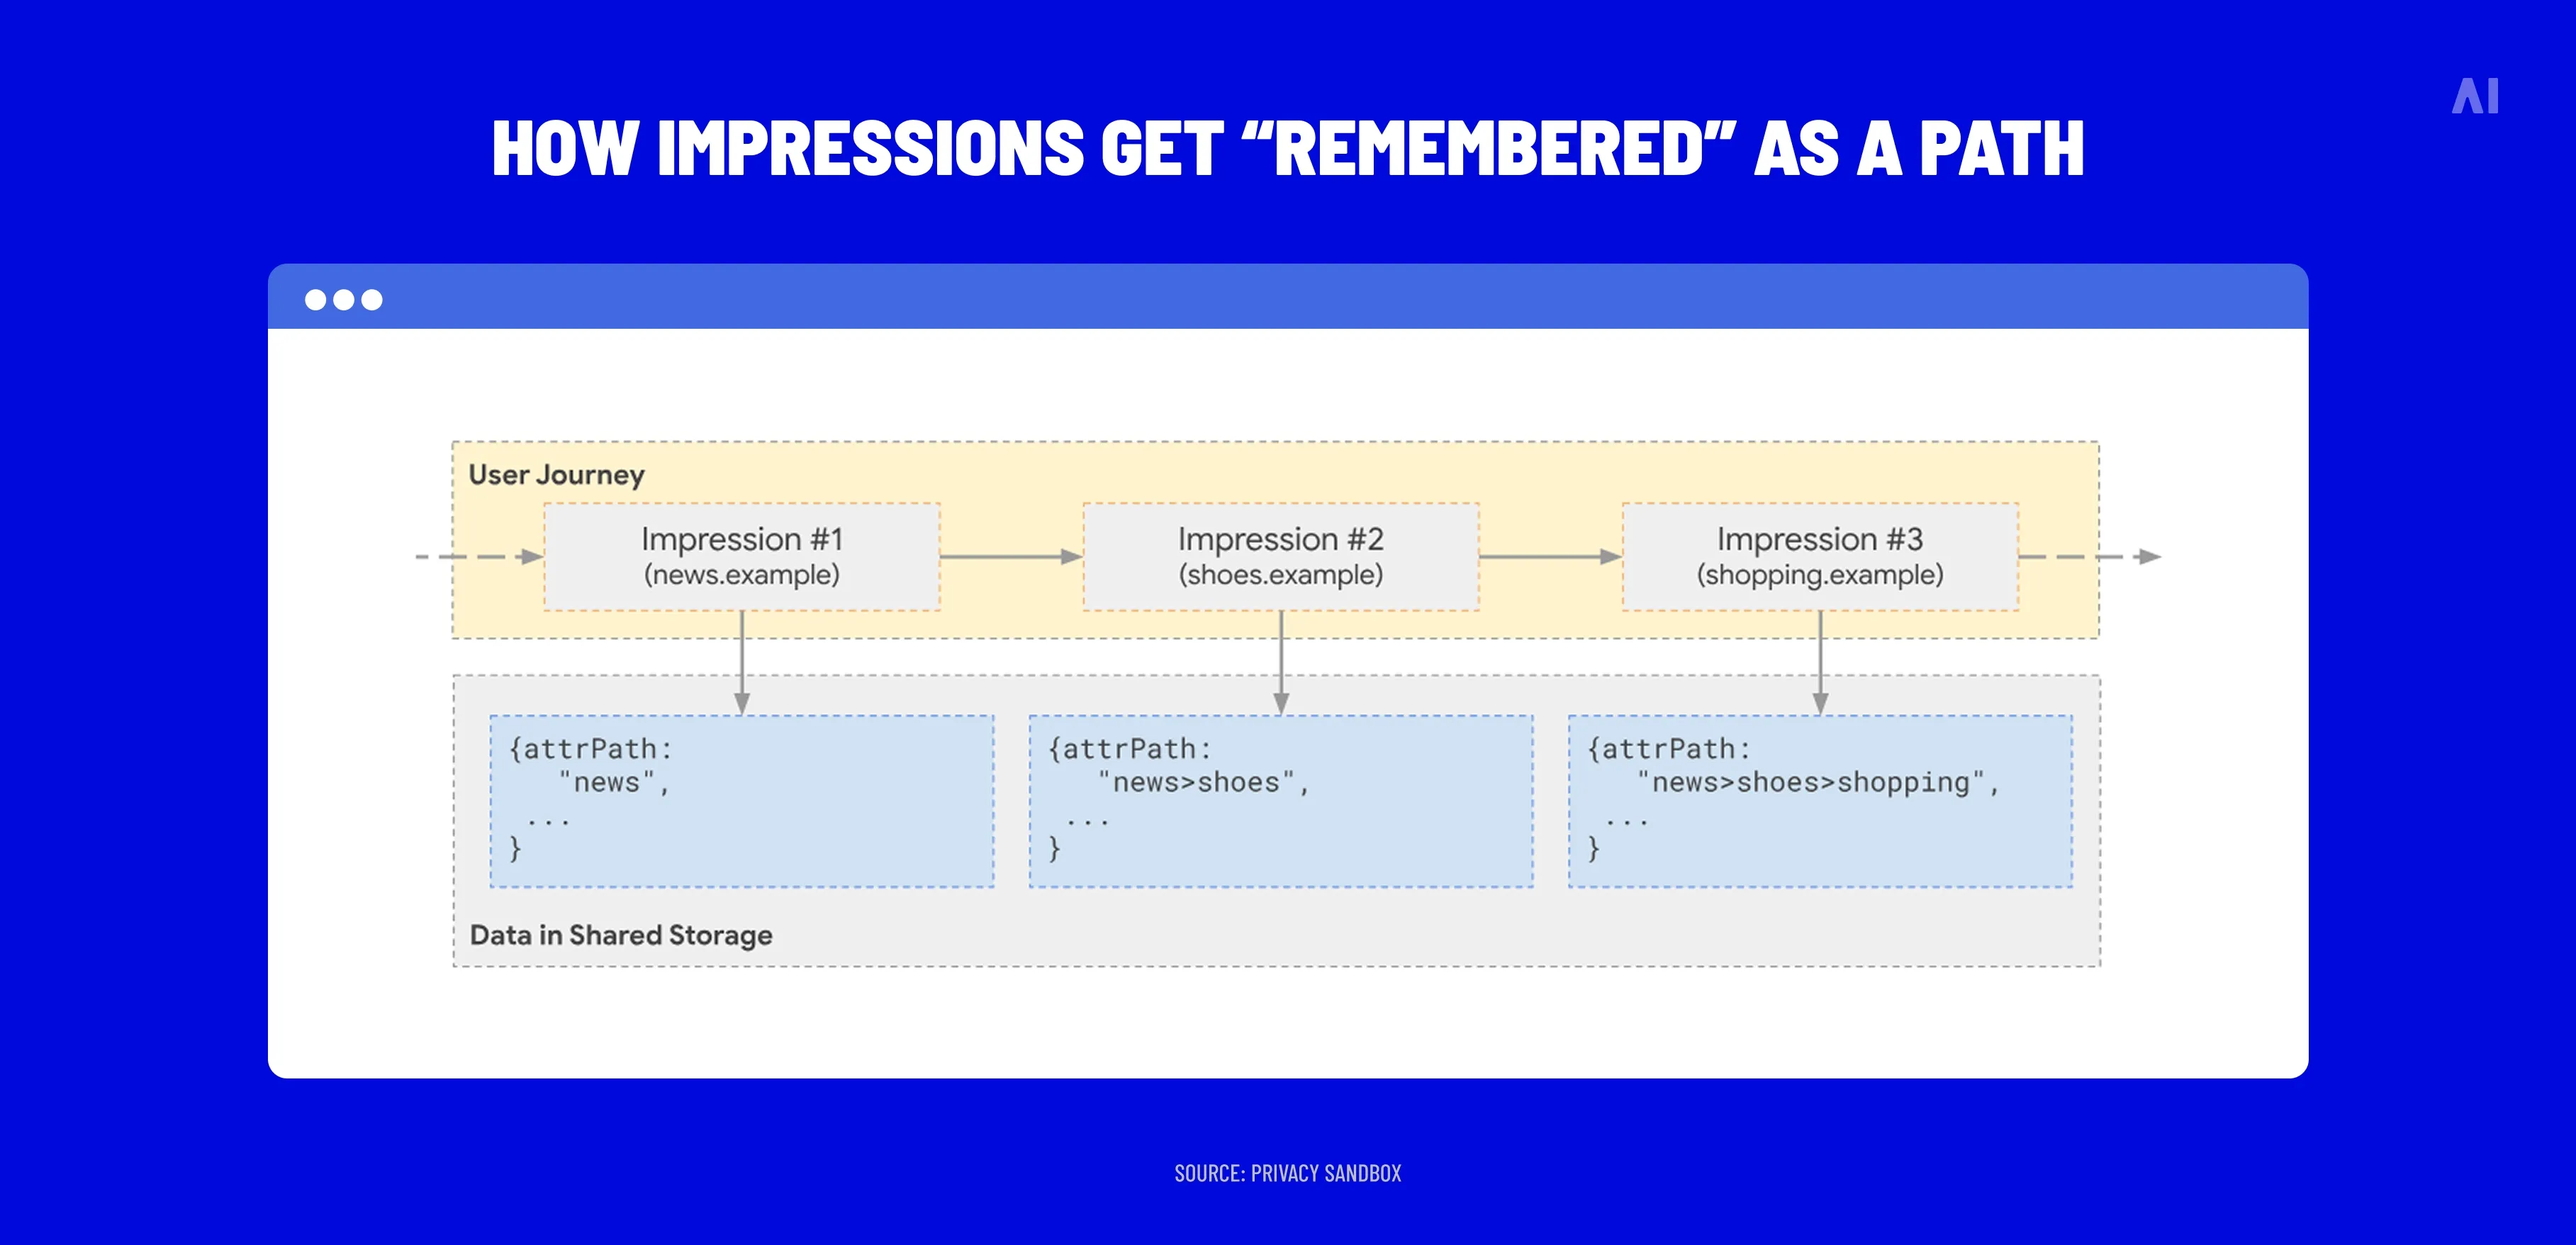
How multi-touch attribution works
At a mechanical level, MTA is a pipeline:
Collect touchpoint data
Resolve identity (as much as you can)
Build conversion paths
Apply attribution logic
Output insights you can act on (channel, campaign, creative, audience, frequency, timing)
The tricky part isn’t the math. It’s the data hygiene and the assumptions.
Probabilistic stitching (lower confidence): Device graphs or modeled matching based on signals like IP + user agent patterns. This can be directionally useful, but it introduces uncertainty you need to monitor.
📍A practical takeaway: MTA is strongest when it’s anchored in first-party identity. If you’re not capturing durable identifiers (logins, lead forms, subscriptions, account matching), cross-device attribution will always be partially blind.
Attribution logic and weighting principles
Once you have paths, you need a rule for splitting credit. That rule is the attribution model.
Most models are built around a few weighting principles:
Recency: touches closer to conversion get more credit (time-decay logic)
Position: first and/or last touch get extra weight (U/W-shaped logic)
Equality: every touch gets the same credit (linear logic)
Incremental contribution: touches get credit based on observed lift or probability change (algorithmic/data-driven logic)
This is where marketers often go wrong: they treat the model as a fact, rather than an assumption. The model is a lens.
A clean way to stay honest is to define what you’re trying to optimize:
If your goal is demand capture, you might choose a model that emphasizes the final decision steps.
If your goal is demand creation, you’ll want a model that values earlier influence and mid-funnel nurturing.
If your goal is forecasting and budget planning, you may need MMM alongside MTA (more on that below).
Data requirements for accurate MTA
MTA accuracy lives or dies on data quality. Before you argue about model types, make sure you can confidently answer “yes” to the basics.
Minimum viable requirements (for most teams):
Clean conversion definitions: Decide what counts as a conversion (purchase, lead, qualified lead, subscription, pipeline stage). If it’s B2B, you’ll likely need multiple conversion events, not one.
Cross-platform data access: You need exports or APIs from your major platforms (search, social, DSP, email/CRM, analytics). If a platform won’t share enough data, your MTA will inherit that blind spot.
A defined attribution window (lookback): Example: 7–30 days for ecommerce, often longer for B2B. What matters is consistency and testing, not a universal number.
A plan for privacy and signal loss: Signal loss is not theoretical. For mobile, for example, Adjust reports an industry-wide ATT opt-in rate of 35% in Q2 2025 (among users shown the prompt), which means a large share of users are not available for device-level tracking. On the web, Google has also changed course on third-party cookies in Chrome, maintaining a user choice approach rather than forcing a new standalone prompt—another reminder that identifiers and access can shift under you.
⚡ If a third of your audience is invisible to device-level tracking, “perfect” attribution is a myth you can’t afford. Build for gaps: aggregation, modeling, and tests that keep you honest.
💡 If you want to connect attribution discipline to supply quality (so you aren’t “optimizing” into low-quality inventory that looks efficient), AI Digital’s brand safety / supply protection view is worth reading alongside your measurement work.
Types of multi-touch attribution models
This is the part most guides rush through. Don’t.
Your model determines which channels get budget, which creatives survive, and which optimizations get repeated. So you need to understand what each model is implicitly saying about how conversion happens.
Linear attribution splits credit equally across all tracked touchpoints in the conversion path.
When it’s useful:
You want a simple baseline for comparison.
Your journeys are fairly consistent in length.
You’re trying to avoid last-click bias without overthinking weighting.
Where it can mislead:
It treats a high-intent touch (pricing page click) the same as a low-intent one (impression with no engagement).
It can over-credit noisy, high-frequency channels.
Best practice: Use linear as a reference model—not your final truth.
Time-decay attribution
Time-decay gives more credit to touchpoints closer to conversion.
When it’s useful:
You have shorter purchase cycles.
You believe recency is a strong driver (common in promo-heavy ecommerce).
You want to reduce early-touch overweighting.
Where it can mislead:
It can under-credit true demand creation if your funnel begins long before conversion.
It rewards retargeting by design unless you set frequency controls and exclusions.
Best practice: Combine time-decay with frequency analysis (how many touches is too many?) so you don’t accidentally optimize into saturation.
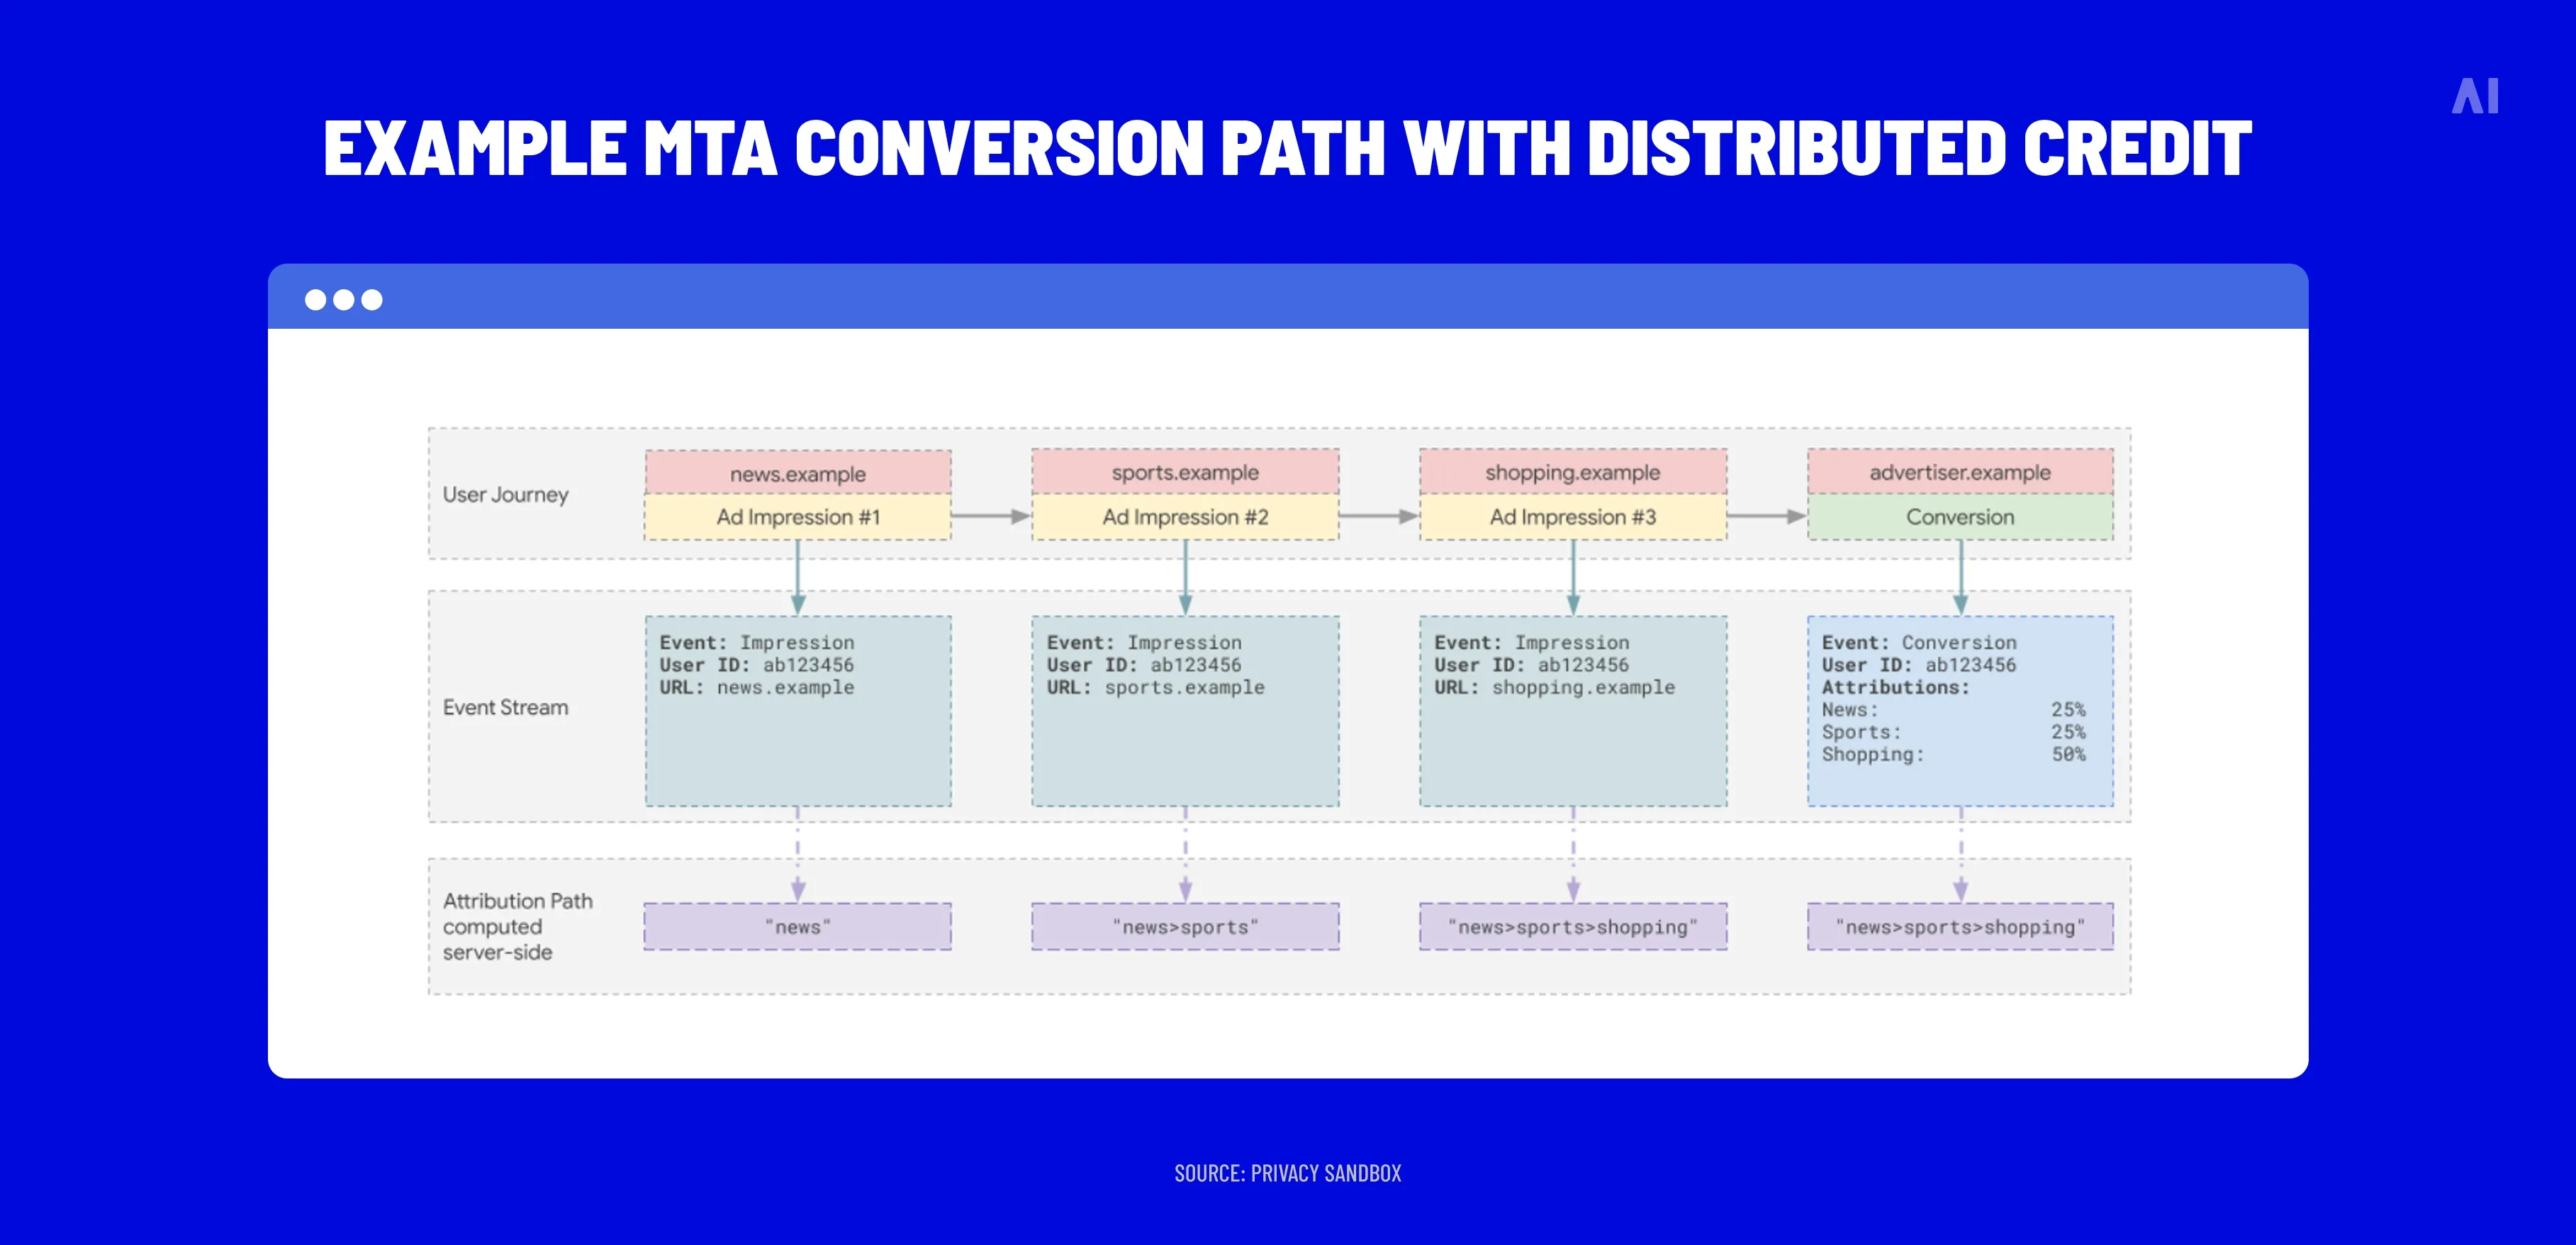
Example MTA conversion path with distributed credit (rule-based weighting) (Source)
U-shaped and W-shaped attribution
These are “position-based” models.
U-shaped typically gives extra credit to the first and last touch, with the remainder spread across the middle.
W-shaped often gives extra credit to three key moments: first touch, a mid-funnel “milestone” (like lead creation), and last touch.
When they’re useful:
Your funnel has recognizable stages.
You’re doing B2B multi touch attribution and want to value lead creation and opportunity progression—not just the final conversion.
Where they can mislead:
They assume your milestones are correctly tracked.
They can become arbitrary if your “mid-funnel event” is a weak proxy for true intent.
Best practice: Only use W-shaped if your CRM stages are reliable and consistently implemented.
Algorithmic and data-driven attribution
Algorithmic (data-driven) attribution assigns credit based on observed patterns in your data, rather than a fixed rule.
Google’s definition is a helpful, concrete example: in Analytics, the data-driven model assigns credit based on how adding an interaction changes the probability of a key event.
When it’s useful:
You have enough conversion volume to support modeling.
You need the model to adapt as campaigns and channel mixes change.
You want credit assignment based on what’s actually happening, not what you assume is happening.
Where it can mislead:
If inputs are biased (missing channels, messy tagging), outputs will be biased too.
If you can’t audit the model, it becomes a black box—and stakeholders stop trusting it.
One notable industry signal: Google Ads notes that several rule-based models (first click, linear, time decay, position-based) are no longer supported and have been upgraded to data-driven attribution, with last click still available. That doesn’t mean rule-based thinking is useless, it means many platforms are pushing teams toward algorithmic credit assignment, whether you asked for it or not.
💡 If you’ve ever watched teams optimize toward metrics that look good but don’t translate into growth, that’s exactly the tension another AI Digital’s piece is meant to solve: Why your marketing netrics are lying about growth
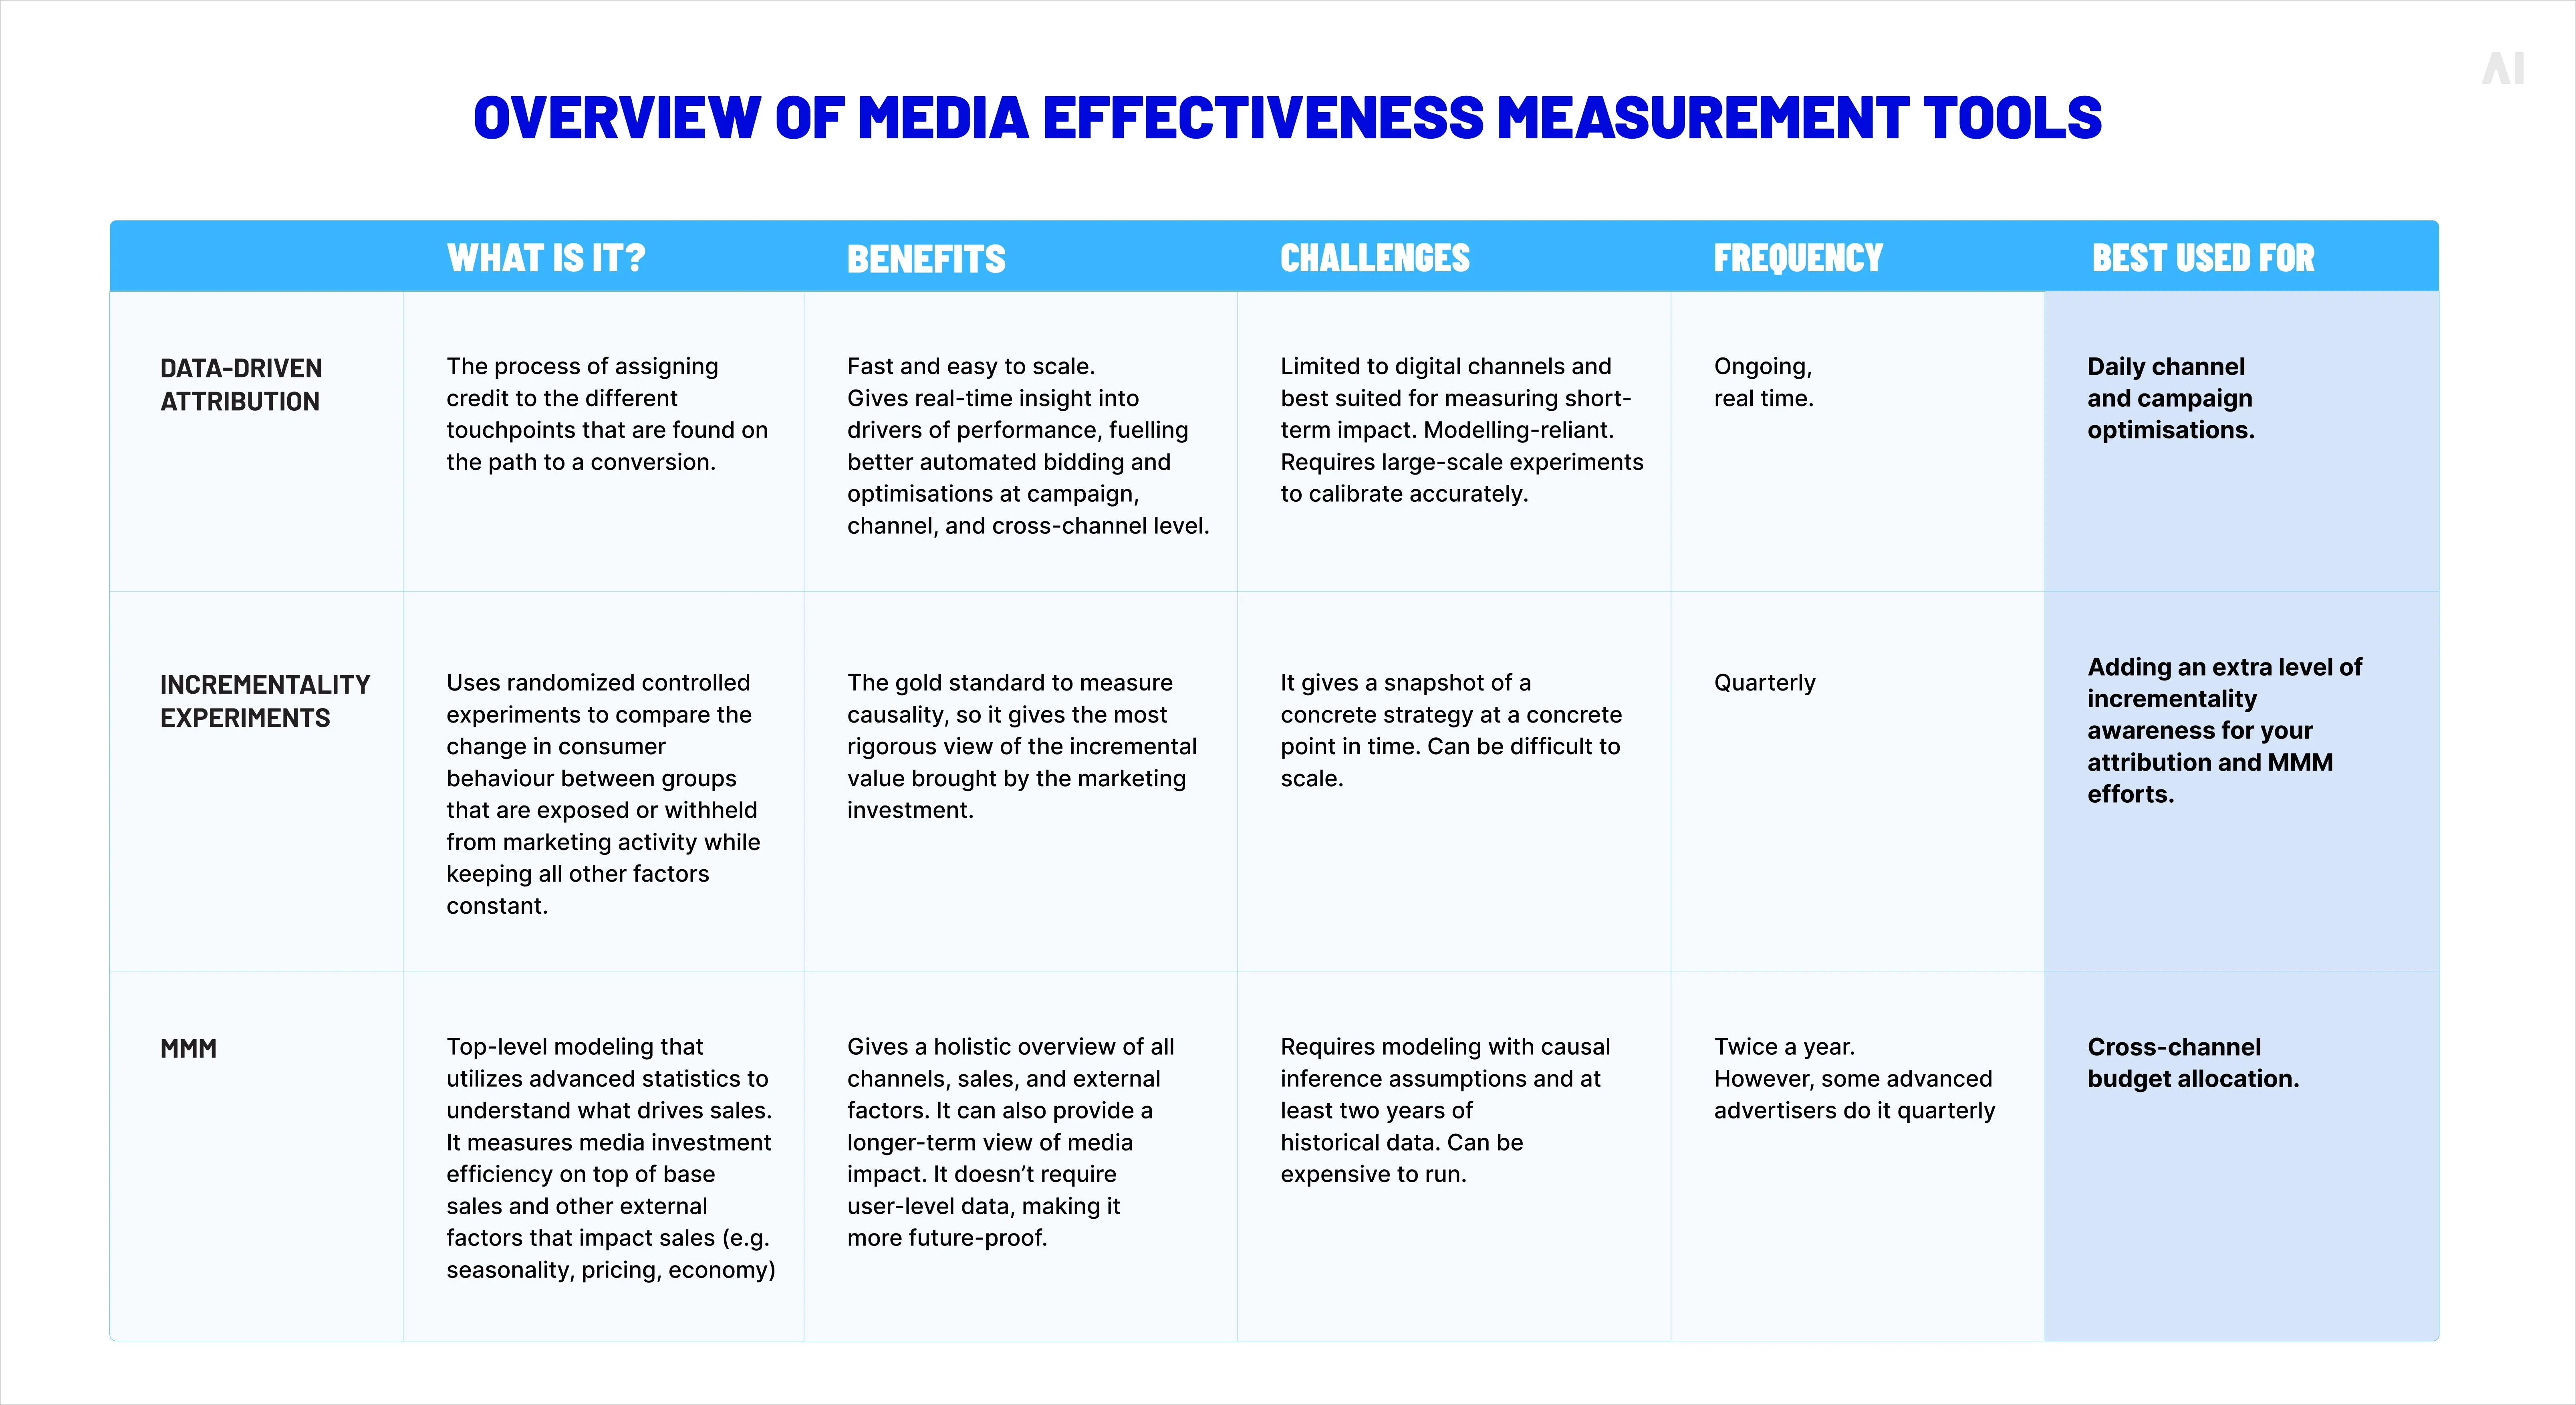
Practical comparison table: attribution vs incrementality vs MMM (Source)
MTA vs last-click attribution
Last-click tells you what was present at the end. MTA tells you what contributed along the way.
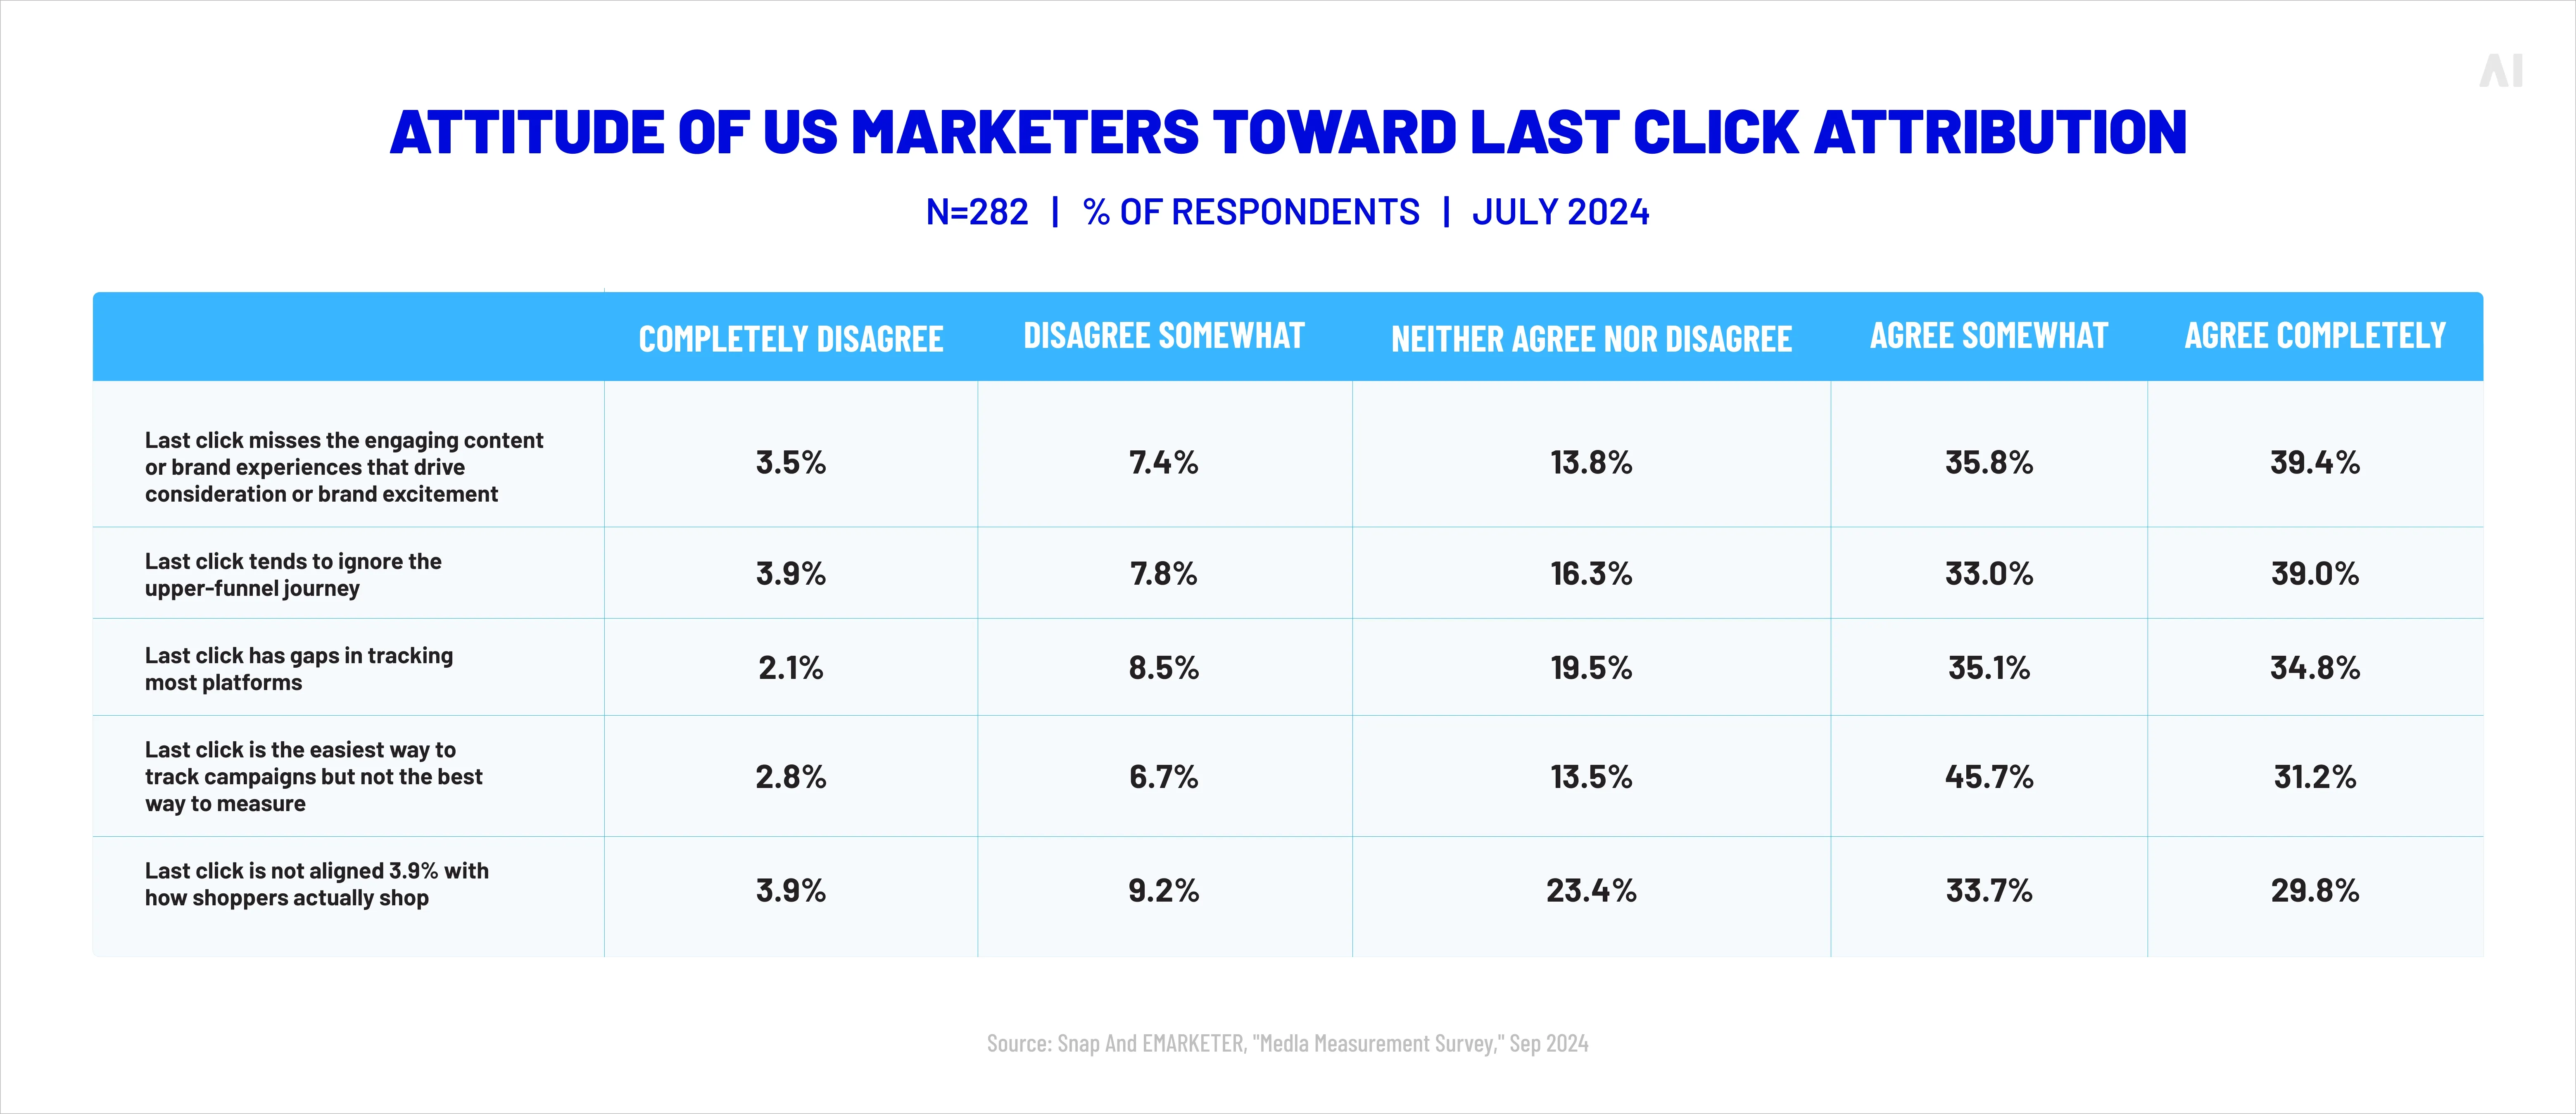
⚡ Last-click isn’t just common, it’s the default habit: 78.4% of marketers use last-click attribution and web analytics to measure media effectiveness. That’s exactly why MTA has so much “hidden work” to surface.
Attitude of US marketers toward last-click attribution (Source)
The differences show up in real decisions:
Budget allocation: Last-click often shifts budget toward capture channels. MTA can keep investment in prospecting and mid-funnel tactics that create and shape demand.
Creative strategy: Last-click favors direct-response creative that closes. MTA can reveal which messaging themes introduce the category, reduce uncertainty, or re-activate consideration.
Channel evaluation: Last-click can make upper funnel look unprofitable. MTA can quantify assist value and sequence effects.
📍 The practical takeaway: use last-click as a narrow diagnostic, not as your main steering wheel.
Marketing mix modeling (MMM) uses aggregated data (spend, impressions, sales, pricing, seasonality, macro factors) to estimate how different marketing inputs drive outcomes over time.
The biggest differences:
Granularity: MTA is user/journey-level (where signals exist). MMM is aggregate/time-series.
Channel coverage: MMM can include channels that are hard to track at user level (offline, TV, pricing, promotions, distribution changes). MTA struggles when touchpoints can’t be observed.
Primary use: MTA supports in-flight optimization (creative, audiences, sequencing). MMM supports budget planning and forecasting (how much to spend, where, and when).
Here’s a practical decision guide. Read it as “starting points,” not rigid rules.
Use MTA when:
You run always-on paid media across multiple digital channels.
You have enough conversion volume to model journeys.
You need to optimize campaigns, creatives, and audiences weekly.
You want multi touch attribution analysis at the tactic level (what to pause, what to scale).
Use MMM when:
You need budget guidance across quarters, not just weeks.
You invest in channels with limited user-level tracking (TV/CTV in some cases, offline, sponsorships).
You want to control for external factors (seasonality, pricing, distribution, macro shifts).
Use both together when:
You want MMM to set the strategic guardrails (macro allocation), and MTA to run the tactical playbook (in-channel optimization).
You’re in a privacy-first environment where observed journeys are incomplete, so you need triangulation rather than a single “source of truth.”
Your stakeholders require both: a CFO-friendly, top-down view and a buyer-journey view for marketers.
This is also where AI enters the picture in a practical way: modeled attribution and probabilistic approaches can fill gaps when deterministic signals drop, but they raise the bar for governance and interpretation.
💡 If you’re exploring how modeling is influencing targeting and measurement decisions, AI Digital’s perspective on AI targeted advertising is a useful adjacent read.
⚡ The goal isn’t perfect attribution. The goal is better decisions than last quarter.
Benefits of multi-touch attribution in marketing
MTA is most valuable when you treat it as a decision system. Used well, it turns messy customer journeys into clearer choices: where to invest, what to cut, what to test next, and what to fix in the funnel.
More accurate ROI measurement
MTA’s main benefit is not “accuracy” in the scientific sense. It’s less wrong in predictable ways than single-touch models.
If you’re running multi-channel campaigns, MTA can help you:
Reduce systematic over-crediting of “bottom-funnel” channels
Identify assists that consistently precede conversions (and would be undervalued in last-click)
Separate “good closers” from “good creators” of demand, so you stop cutting the very channels that feed performance
Smarter budget allocation
Budget allocation improves when attribution outputs are usable at two levels:
Within-channel optimization (creative A vs B, audience segment 1 vs 2)
Cross-channel rebalancing (search vs paid social vs CTV vs retail media)
MTA supports both, especially when you focus on marginal return. In practice, you’re watching for patterns like: “This channel drives incremental conversions up to a point, then becomes expensive frequency.” That’s a budget decision, not just a reporting detail.
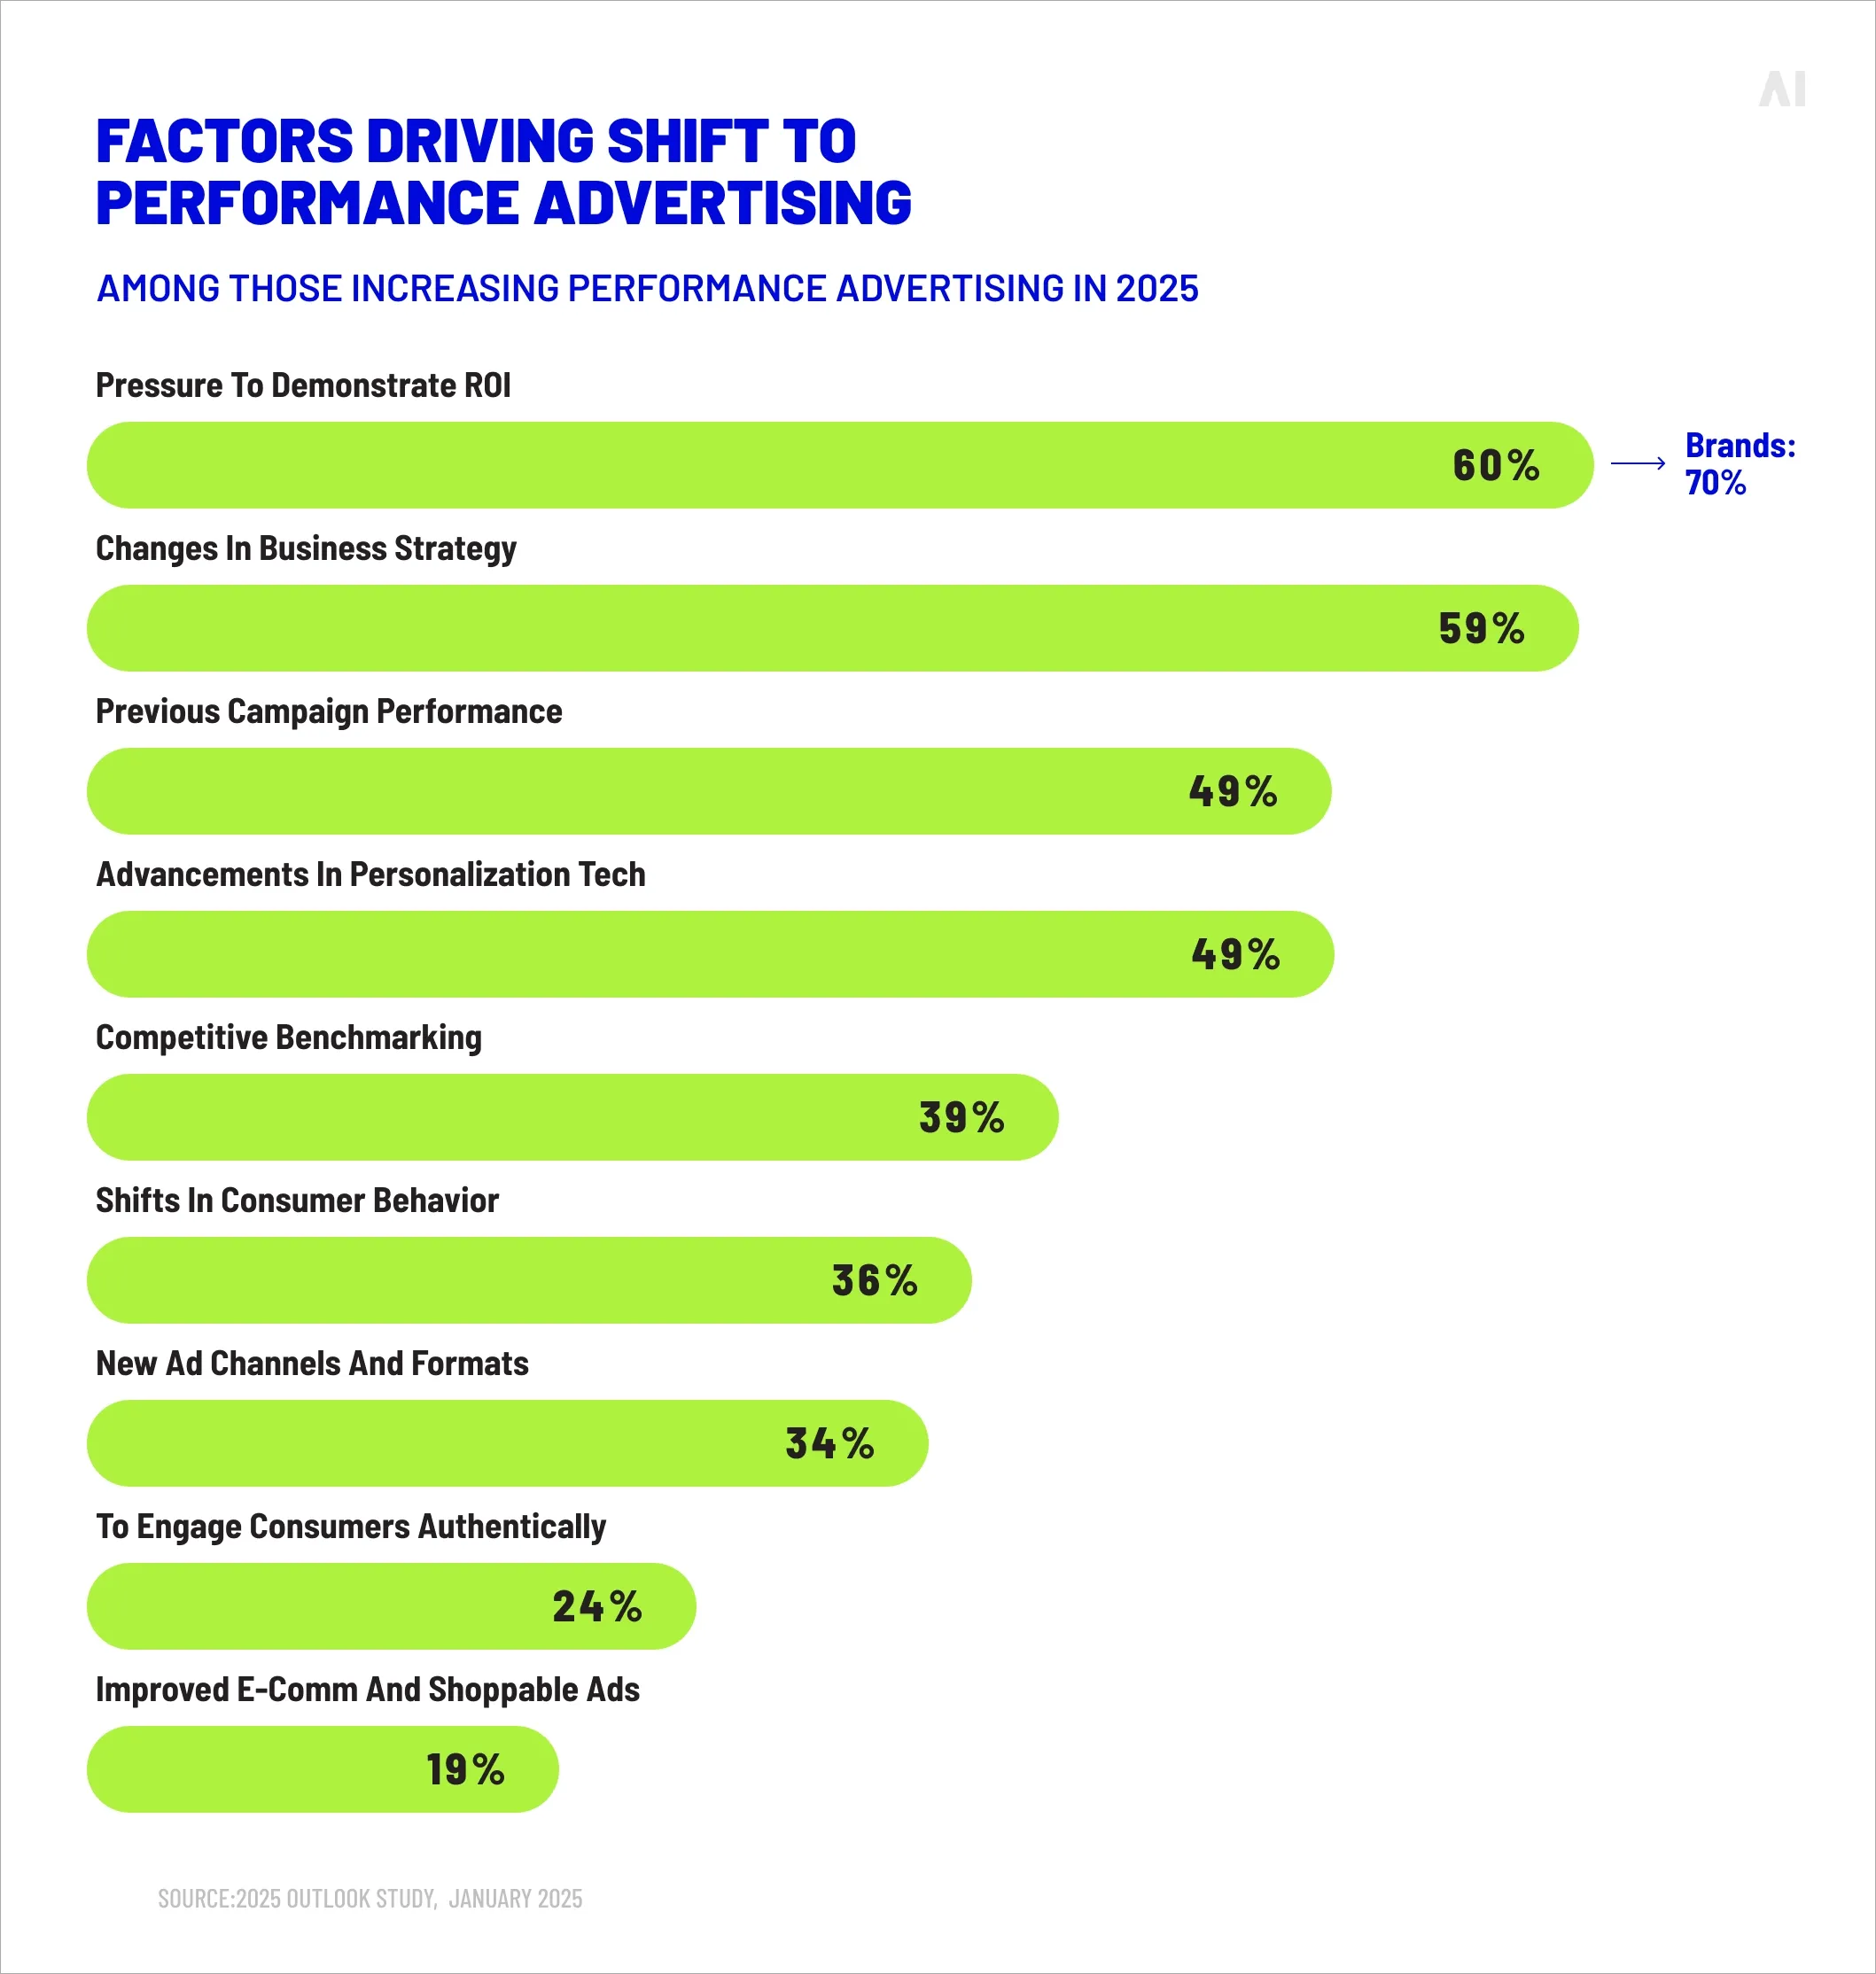
What advertisers say they’re optimizing for (Source)
Better channel and creative optimization
MTA is one of the few methods that can give you a directional answer to questions like:
Which message works best as a first touch vs a mid-funnel reassurance touch?
Which creative assists conversions even if it doesn’t close them?
What sequence tends to correlate with higher AOV, higher LTV, or fewer refunds?
This is where MTA gets tactical. Instead of optimizing for “the ad that got the click,” you start optimizing for the content that moved the buyer forward, and you design campaigns as sequences rather than isolated placements.
Deeper customer journey insights
Most teams underestimate how valuable this is until they see it.
Journey insights from MTA can reveal:
Common loops (people who bounce between search and social twice before converting)
The “confidence step” (reviews, creator content, comparison pages, FAQs)
The “friction step” (shipping surprises, weak offers, broken landing pages)
Where cross-device behavior is most likely (CTV → mobile search → desktop checkout is a classic pattern)
Challenges of implementing MTA
MTA can absolutely improve decision-making. It can also create false confidence fast, especially when the data foundation is shaky.
A helpful reality check from TransUnion’s 2025 report: 60% of marketers said internal stakeholders question the validity of marketing measurement, and major barriers include siloed data and cross-channel duplication problems.
Data fragmentation and identity resolution
MTA needs consistent identifiers. Modern stacks often have the opposite:
⚡ Tool sprawl shows up as measurement fatigue: MMA’s State of Attribution reports80% of marketers are dissatisfied with their ability to reconcile results from different tools. A single “source of truth” is less a platform choice and more a process choice.
This is why identity resolution (deterministic where possible, probabilistic where necessary) becomes the make-or-break layer for MTA. And it’s why many teams end up with “partial MTA” that works well for some channels and poorly for others.
Privacy, consent, and signal loss
Even if your modeling is excellent, you can’t attribute what you can’t observe.
Between consent requirements and platform-level changes, measurement has shifted from “track everything” to “measure with what you’re allowed to know.” In practice, that means more aggregation, more modeling, and more emphasis on first-party data.
(And, as mentioned previously, mobile consent dynamics like iOS ATT opt-in rates can materially change what’s observable, which changes what’s attributable.)
Attribution bias and overfitting
Attribution bias sneaks in when:
A channel is over-measured (lots of trackable events) and gets over-credited
A channel is under-measured (CTV, offline, PR) and gets under-credited
Your model “learns” patterns that are really just media delivery artifacts (frequency, audience overlap, retargeting pools)
Overfitting is especially common with algorithmic MTA when teams treat the model as objective truth instead of a highly contingent estimate.
Organizational readiness and skills gaps
MTA isn’t merely a tooling project; it changes how you operate, because it forces decisions about data ownership, measurement standards, governance, and how teams plan and optimize across channels.
One reason measurement programs stall is that teams can’t translate data into decisions across functions. A 2024 McKinsey article noted that 64% of respondents said their organizations make marketing decisions not primarily influenced by analytics, and that stronger marketing operating models are linked to clearer connections between marketing and business outcomes.
In other words: even perfect attribution won’t help if nobody trusts it, nobody knows how to act on it, or incentives reward short-term metrics over business outcomes.
How to implement multi-touch attribution
Implementation is where most MTA articles get vague. Here’s the practical version: you’re building a measurement pipeline that has to survive real-world constraints, and still produce outputs your team can use.
Define business goals and KPIs
Start by choosing one primary business outcome and a tight set of supporting KPIs.
Algorithmic only when you have enough consistent conversion volume and stable tagging across channels
Most teams should run two models in parallel for a period (for example: time-decay + position-based) to see how sensitive budget decisions are to assumptions.
Integrate data sources and platforms
This is usually 70% of the work.
Your “minimum viable MTA” data set is:
Ad platform logs (impressions/clicks where available)
Web/app analytics events (sessions, key actions)
CRM outcomes (leads, MQL/SQL, revenue)
A mapping layer (campaign IDs, UTMs, creative IDs, placement IDs)
A deduplication strategy (so you don’t count the same conversion three times)
If you don’t have clean mapping, you won’t have trustworthy weights. Full stop.
Validate, test, and refine attribution outputs
This is the part that separates “MTA as a dashboard” from “MTA as a discipline.”
Validation methods that actually work:
Holdout tests (geo or audience) to check whether credited channels produce lift
Back-testing: do MTA-driven reallocations predict better outcomes next period?
Stability checks: do weights swing wildly week to week without a real business reason?
Sanity checks: do results align with known constraints (inventory, budgets, seasonality)?
If the model says something extreme (“email drives 70% of revenue”), treat that as a prompt to investigate data quality and attribution windows, not as a truth to broadcast.
MTA in a privacy-first and cookieless world
MTA isn’t dead in 2026, but it has taken on a different shape, because the modern version is increasingly consent-driven, anchored more heavily in first-party data, and supported by modeling where direct signals are incomplete.
⚡ Cross-channel measurement is still a struggle in practice: Supermetrics’ 2025 report found41% of marketers say they can’t effectively measure marketing across channels. That’s not a tooling gap alone, it’s a data discipline gap.
First-party data and consent-driven attribution
If your measurement still depends on third-party cookies as the backbone identifier, you’re building on sand.
In practice, privacy-first MTA usually means:
Instrumenting first-party events cleanly (site/app + server-side where appropriate)
Passing consent signals through the stack (so your data use is legitimate, not just technically possible)
Using CRM outcomes as the grounding truth (what actually converted, what actually retained)
This is also where teams start caring a lot more about interoperability and data standards, because privacy-safe measurement requires cleaner data contracts between partners.
The mistake is pretending probabilistic attribution is “wrong” (it’s often necessary), or pretending it’s “precise” (it isn’t). Your job is to label it correctly and validate it with tests.
The role of clean rooms and modeled attribution
Clean rooms are one of the most important privacy-era tools, but they can also create new constraints.
Forrester reported in late 2024 that 90% of B2C marketers in its CMO Pulse Survey were using data clean rooms for marketing use cases (and expected usage to grow).
Clean rooms can help with:
Privacy-safe matching and aggregation
Cross-platform measurement workflows
Controlled access to sensitive data (reducing leakage risk)
But industry analysis has also pointed out a real trade-off: clean rooms can reinforce ecosystem fragmentation if every platform has its own environment and rules, making “one coherent view” harder, not easier.
📍 If you’re planning for 2026, the direction is clear: more modeled attribution, more experimentation, and more emphasis on first-party signal quality.
Use cases matter because they show what MTA is actually good for: improving real decisions inside real constraints.
Performance marketing and paid media optimization
Performance teams typically use MTA in three loops:
Budget shifts across channels (search vs paid social vs retail media)
Creative sequencing (what works as first-touch vs closer)
Audience strategy (prospecting vs retargeting, overlap control)
A simple, practical example: if MTA shows that a prospecting video touch consistently appears in high-LTV paths (even when it rarely gets last click), the team can protect that spend during efficiency pressure then validate with holdouts or geo tests.
👉 A practical example comes fromKURU Footwear, which used Rockerbox’s multi-touch attribution to move beyond last-click and get user-level path-to-conversion visibility. The team wanted to properly count view-through impact in social, understand how touchpoints worked together, and include signals that last-click typically drops (like offline interactions). With MTA, Rockerbox describes using “synthetic events” to represent view-through and offline touchpoints, which helped KURU feel confident scaling spend, reportedly increasing social spend by 350% while making budget decisions based on the full path rather than whichever channel happened to get the final click.
Retail and ecommerce attribution
Retail and ecommerce teams care about:
New-to-file acquisition vs repeat
Promo vs baseline demand
Cross-device behavior
Online-to-offline (store visits, pickup, returns, customer service interactions)
MTA helps answer questions like: “Which channels reliably introduce new customers, and which ones mainly harvest existing demand?” That can change how you fund prospecting, loyalty, and retail media placements.
👉 Michael Kors (Capri Holdings) is a good example of a retail brand using MTA in practice to get past last-touch bias, especially in an omnichannel setup. In April 2024, the company’s global VP of analytics described how the brand joined a pilot of Adobe’s Mix Modeller, which combines marketing mix modeling (MMM) with multi-touch attribution (MTA) to unify insights across paid, owned, and earned channels. The key use case wasn’t just reporting; it was faster, more confident planning. During the pilot (run across the Michael Kors brand in the U.S.), the team used the combined MMM+MTA approach to validate channels and tactics that “often don’t receive the credit they deserve,” then pressure-test “what if” budget scenarios quickly—moving from exploring a couple of scenarios over many hours to exploring far more in minutes, so they could build stronger business cases for investment and turn one-off tests into repeatable seasonal strategies.
Omnichannel and CTV attribution scenarios
CTV is a great example of why single-touch attribution breaks down.
CTV often:
Creates awareness and preference
Drives delayed response (days later)
Shows up as “assist” rather than “closer”
Pushes people across devices (TV → phone search → desktop checkout)
MTA can capture some of that assist behavior, especially when combined with privacy-safe identity, clean-room matching, or modeled lift. But the best omnichannel teams don’t rely on MTA alone—they triangulate with incrementality tests and MMM to avoid under-crediting “upper-funnel” impact.
👉 For CTV, a useful “in-the-wild” example is how Roku is working with iSpot to use attributed outcomes not just for reporting after a campaign ends, but for in-flight optimization. StreamTV Insider reports that Roku advertisers can use iSpot-attributed outcomes to track ROI and adjust creative strategy while campaigns are running—and cites early tests with SimpliSafe showing a 23% boost in leads and a 31% lift in website visits for an optimized group versus a control. That’s essentially an omnichannel attribution loop: CTV exposure gets treated as a measurable contributor to downstream actions (often on other devices), then those outcome signals feed back into optimization decisions.
Common MTA mistakes and how to avoid them
This is where teams lose months, especially when attribution turns into a dashboard project instead of a measurement discipline.
Here are the pitfalls that show up most often—and what to do instead.
Over-relying on one model: If a single model is allowed to drive every decision, you’ll eventually optimize into its blind spots and biases, even if the reporting looks internally consistent.
How to avoid it: Run at least two models early (for example, time-decay and position-based), and then pressure-test channel-level conclusions with incrementality tests so you’re validating the story, not just repeating it.
Ignoring data quality issues: Broken UTMs, inconsistent campaign naming, missing offline outcomes, or duplicated conversions can all produce attribution outputs that look “precise” while still being fundamentally wrong.
How to avoid it: Treat taxonomy and mapping like a product, which means version-controlling it, auditing it on a monthly cadence, and fixing root causes upstream instead of patching symptoms in reporting.
Treating attribution as static: Customer behavior shifts, platform optimization changes, and privacy rules keep moving, so an attribution approach that never evolves will drift out of alignment—quietly at first, and then all at once.
How to avoid it: Set a clear operating cadence that includes a quarterly model review, monthly data QA, and an always-on testing roadmap that keeps the system honest.
Failing to align MTA with business outcomes: When MTA is used to optimize toward proxy metrics like cheap clicks or platform-reported ROAS, it’s easy to end up with “efficient” spend that doesn’t actually grow the business.
How to avoid it: Anchor measurement to business outcomes—revenue, contribution margin, qualified pipeline, and LTV—and then treat MTA as directional guidance inside that frame, not the final judge of performance.
Multi-touch attribution matters because the customer journey is still fragmented, and teams still have to make real budget calls every week. MTA marketing won’t give you a perfect causal map of every conversion, especially with privacy constraints and walled gardens. What it can do is help you stop over-rewarding the easiest-to-measure “closers,” protect the channels that create demand, and build a clearer feedback loop between spend, sequence, and outcomes.
In 2026, the most useful way to treat multi touch attribution is as part of a measurement stack: a practical, test-and-refine system that produces decisions your team can defend (and improve over time), rather than a single model that claims to be “the truth.”
Key takeaways:
MTA is most valuable when it changes decisions, not when it produces prettier dashboards.
Your model is an assumption, not a fact. Validate it with experiments and sanity checks.
First-party identity and clean data hygiene are the foundation. If inputs are messy, outputs will be confidently wrong.
MTA works best alongside MMM and incrementality testing when you need both tactical optimization and strategic planning.
Privacy-first reality means more modeling and more transparency, not less measurement.
If you want help pressure-testing your attribution approach (or building a privacy-resilient measurement stack), AI Digital can support you across planning, execution, supply quality, and measurement through our Open Garden approach.
Managed Service: media planning and strategy, cross-channel buying, and ongoing optimization aligned to business KPIs.
Smart Supply: premium supply selection, supply path optimization, and brand-safety controls with transparent reporting.
Elevate: an intelligence layer that unifies planning, optimization, and analytics (including multi-touch attribution analysis) across a fragmented ecosystem.
Want to sanity-check your current attribution model or talk through what “good” looks like for your mix?Get in touch with AI Digital and tell us what you’re trying to measure and optimize, we’ll point you to the right next step.
Blind spot
Key issues
Business impact
AI Digital solution
Lack of transparency in AI models
• Platforms own AI models and train on proprietary data • Brands have little visibility into decision-making • "Walled gardens" restrict data access
• Inefficient ad spend • Limited strategic control • Eroded consumer trust • Potential budget mismanagement
Open Garden framework providing: • Complete transparency • DSP-agnostic execution • Cross-platform data & insights
Optimizing ads vs. optimizing impact
• AI excels at short-term metrics but may struggle with brand building • Consumers can detect AI-generated content • Efficiency might come at cost of authenticity
• Short-term gains at expense of brand health • Potential loss of authentic connection • Reduced effectiveness in storytelling
Smart Supply offering: • Human oversight of AI recommendations • Custom KPI alignment beyond clicks • Brand-safe inventory verification
The illusion of personalization
• Segment optimization rebranded as personalization • First-party data infrastructure challenges • Personalization vs. surveillance concerns
• Potential mismatch between promise and reality • Privacy concerns affecting consumer trust • Cost barriers for smaller businesses
Elevate platform features: • Real-time AI + human intelligence • First-party data activation • Ethical personalization strategies
AI-Driven efficiency vs. decision-making
• AI shifting from tool to decision-maker • Black box optimization like Google Performance Max • Human oversight limitations
• Strategic control loss • Difficulty questioning AI outputs • Inability to measure granular impact • Potential brand damage from mistakes
Managed Service with: • Human strategists overseeing AI • Custom KPI optimization • Complete campaign transparency
Fig. 1. Summary of AI blind spots in advertising
Dimension
Walled garden advantage
Walled garden limitation
Strategic impact
Audience access
Massive, engaged user bases
Limited visibility beyond platform
Reach without understanding
Data control
Sophisticated targeting tools
Data remains siloed within platform
Fragmented customer view
Measurement
Detailed in-platform metrics
Inconsistent cross-platform standards
Difficult performance comparison
Intelligence
Platform-specific insights
Limited data portability
Restricted strategic learning
Optimization
Powerful automated tools
Black-box algorithms
Reduced marketer control
Fig. 2. Strategic trade-offs in walled garden advertising.
Core issue
Platform priority
Walled garden limitation
Real-world example
Attribution opacity
Claiming maximum credit for conversions
Limited visibility into true conversion paths
Meta and TikTok's conflicting attribution models after iOS privacy updates
Data restrictions
Maintaining proprietary data control
Inability to combine platform data with other sources
Amazon DSP's limitations on detailed performance data exports
Cross-channel blindspots
Keeping advertisers within ecosystem
Fragmented view of customer journey
YouTube/DV360 campaigns lacking integration with non-Google platforms
Black box algorithms
Optimizing for platform revenue
Reduced control over campaign execution
Self-serve platforms using opaque ML models with little advertiser input
Performance reporting
Presenting platform in best light
Discrepancies between platform-reported and independently measured results
Consistently higher performance metrics in platform reports vs. third-party measurement
Fig. 1. The Walled garden misalignment: Platform interests vs. advertiser needs.
Key dimension
Challenge
Strategic imperative
ROAS volatility
Softer returns across digital channels
Shift from soft KPIs to measurable revenue impact
Media planning
Static plans no longer effective
Develop agile, modular approaches adaptable to changing conditions
Brand/performance
Traditional division dissolving
Create full-funnel strategies balancing long-term equity with short-term conversion
Capability
Key features
Benefits
Performance data
Elevate forecasting tool
• Vertical-specific insights • Historical data from past economic turbulence • "Cascade planning" functionality • Real-time adaptation
• Provides agility to adjust campaign strategy based on performance • Shows which media channels work best to drive efficient and effective performance • Confident budget reallocation • Reduces reaction time to market shifts
• Dataset from 10,000+ campaigns • Cuts response time from weeks to minutes
• Reaches people most likely to buy • Avoids wasted impressions and budgets on poor-performing placements • Context-aligned messaging
• 25+ billion bid requests analyzed daily • 18% improvement in working media efficiency • 26% increase in engagement during recessions
Full-funnel accountability
• Links awareness campaigns to lower funnel outcomes • Tests if ads actually drive new business • Measures brand perception changes • "Ask Elevate" AI Chat Assistant
• Upper-funnel to outcome connection • Sentiment shift tracking • Personalized messaging • Helps balance immediate sales vs. long-term brand building
• Natural language data queries • True business impact measurement
Open Garden approach
• Cross-platform and channel planning • Not locked into specific platforms • Unified cross-platform reach • Shows exactly where money is spent
• Reduces complexity across channels • Performance-based ad placement • Rapid budget reallocation • Eliminates platform-specific commitments and provides platform-based optimization and agility
• Coverage across all inventory sources • Provides full visibility into spending • Avoids the inability to pivot across platform as you’re not in a singular platform
Fig. 1. How AI Digital helps during economic uncertainty.
Trend
What it means for marketers
Supply & demand lines are blurring
Platforms from Google (P-Max) to Microsoft are merging optimization and inventory in one opaque box. Expect more bundled “best available” media where the algorithm, not the trader, decides channel and publisher mix.
Walled gardens get taller
Microsoft’s O&O set now spans Bing, Xbox, Outlook, Edge and LinkedIn, which just launched revenue-sharing video programs to lure creators and ad dollars. (Business Insider)
Retail & commerce media shape strategy
Microsoft’s Curate lets retailers and data owners package first-party segments, an echo of Amazon’s and Walmart’s approaches. Agencies must master seller-defined audiences as well as buyer-side tactics.
AI oversight becomes critical
Closed AI bidding means fewer levers for traders. Independent verification, incrementality testing and commercial guardrails rise in importance.
Fig. 1. Platform trends and their implications.
Metric
Connected TV (CTV)
Linear TV
Video Completion Rate
94.5%
70%
Purchase Rate After Ad
23%
12%
Ad Attention Rate
57% (prefer CTV ads)
54.5%
Viewer Reach (U.S.)
85% of households
228 million viewers
Retail Media Trends 2025
Access Complete consumer behaviour analyses and competitor benchmarks.
Identify and categorize audience groups based on behaviors, preferences, and characteristics
Michaels Stores: Implemented a genAI platform that increased email personalization from 20% to 95%, leading to a 41% boost in SMS click through rates and a 25% increase in engagement.
Estée Lauder: Partnered with Google Cloud to leverage genAI technologies for real-time consumer feedback monitoring and analyzing consumer sentiment across various channels.
High
Medium
Automated ad campaigns
Automate ad creation, placement, and optimization across various platforms
Showmax: Partnered with AI firms toautomate ad creation and testing, reducing production time by 70% while streamlining their quality assurance process.
Headway: Employed AI tools for ad creation and optimization, boosting performance by 40% and reaching 3.3 billion impressions while incorporating AI-generated content in 20% of their paid campaigns.
High
High
Brand sentiment tracking
Monitor and analyze public opinion about a brand across multiple channels in real time
L’Oréal: Analyzed millions of online comments, images, and videos to identify potential product innovation opportunities, effectively tracking brand sentiment and consumer trends.
Kellogg Company: Used AI to scan trending recipes featuring cereal, leveraging this data to launch targeted social campaigns that capitalize on positive brand sentiment and culinary trends.
High
Low
Campaign strategy optimization
Analyze data to predict optimal campaign approaches, channels, and timing
DoorDash: Leveraged Google’s AI-powered Demand Gen tool, which boosted its conversion rate by 15 times and improved cost per action efficiency by 50% compared with previous campaigns.
Kitsch: Employed Meta’s Advantage+ shopping campaigns with AI-powered tools to optimize campaigns, identifying and delivering top-performing ads to high-value consumers.
High
High
Content strategy
Generate content ideas, predict performance, and optimize distribution strategies
JPMorgan Chase: Collaborated with Persado to develop LLMs for marketing copy, achieving up to 450% higher clickthrough rates compared with human-written ads in pilot tests.
Hotel Chocolat: Employed genAI for concept development and production of its Velvetiser TV ad, which earned the highest-ever System1 score for adomestic appliance commercial.
High
High
Personalization strategy development
Create tailored messaging and experiences for consumers at scale
Stitch Fix: Uses genAI to help stylists interpret customer feedback and provide product recommendations, effectively personalizing shopping experiences.
Instacart: Uses genAI to offer customers personalized recipes, mealplanning ideas, and shopping lists based on individual preferences and habits.
Medium
Medium
Share article
Url copied to clipboard
No items found.
Subscribe to our Newsletter
THANK YOU FOR YOUR SUBSCRIPTION
Oops! Something went wrong while submitting the form.
Questions? We have answers
What is the MTA model of advertising?
The MTA model of advertising refers to multi-touch attribution, where conversion credit is shared across the touchpoints a customer interacted with before converting, instead of assigning 100% to a single click. In practice, it’s a way to run multi touch attribution analysis so you can understand which channels and messages contributed to outcomes across the journey.
How is MTA different from last-touch attribution?
Last-touch assigns all credit to the final tracked interaction, which tends to overvalue bottom-funnel “closers.” MTA modeling spreads credit across earlier and mid-funnel touches too, so your MTA analysis can reflect how demand was created, nurtured, and then captured.
What channels can be measured with MTA?
Most digital channels can be measured with multi-touch attribution if you can capture consistent exposure or interaction data, including paid search, paid social, display/programmatic, email/SMS, affiliates, and onsite/app behavior. Channels like CTV, audio, and some offline touchpoints can be included as well, but the accuracy often depends on modeled or privacy-safe measurement rather than clean user-level tracking.
What data is required to run multi-touch attribution?
You typically need touchpoint data (impressions/clicks/events), outcome data (conversions tied to revenue or qualified outcomes), consistent campaign identifiers (UTMs/IDs), and some way to connect identity across sessions or devices (first-party IDs where possible, otherwise probabilistic stitching). Without reliable tagging and deduplication, MTA modeling can look precise while being misleading.
What are the limitations of MTA?
Multi-touch attribution is limited by what’s observable: privacy and consent reduce identity-level tracking, walled gardens restrict data access, and models can over-credit channels with richer logs while under-crediting channels with weaker signals. Because MTA is correlation-heavy, it’s best treated as directional and validated with incrementality testing or MMM when stakes are high.
Should MTA replace other measurement models?
Usually not. Multi-touch attribution is strongest for tactical optimization, while MMM helps with strategic budget planning and experiments help confirm causality. The most reliable approach is using MTA alongside MMM and testing so each method checks the others’ blind spots.
What's the difference between B2B multi touch attribution and B2C multichannel attribution?
B2B multi touch attribution usually has longer cycles, multiple decision-makers, and offline steps (sales calls, demos, CRM stages), so the conversion “event” is often a sequence of milestones and MTA analysis needs CRM integration to be meaningful. B2C multichannel attribution often has higher volume and shorter cycles, so multi touch attribution analysis tends to focus more on ecommerce conversion paths, promo effects, and cross-device behavior.
Have other questions?
If you have more questions, contact us so we can help.


.svg)
.svg)