Connected TV Statistics: Key Trends, Audience Insights, and Advertising Opportunities
Sarah Moss
September 5, 2025
11
minutes read
Originally published September 2025. Updated and refreshed in June 2026.
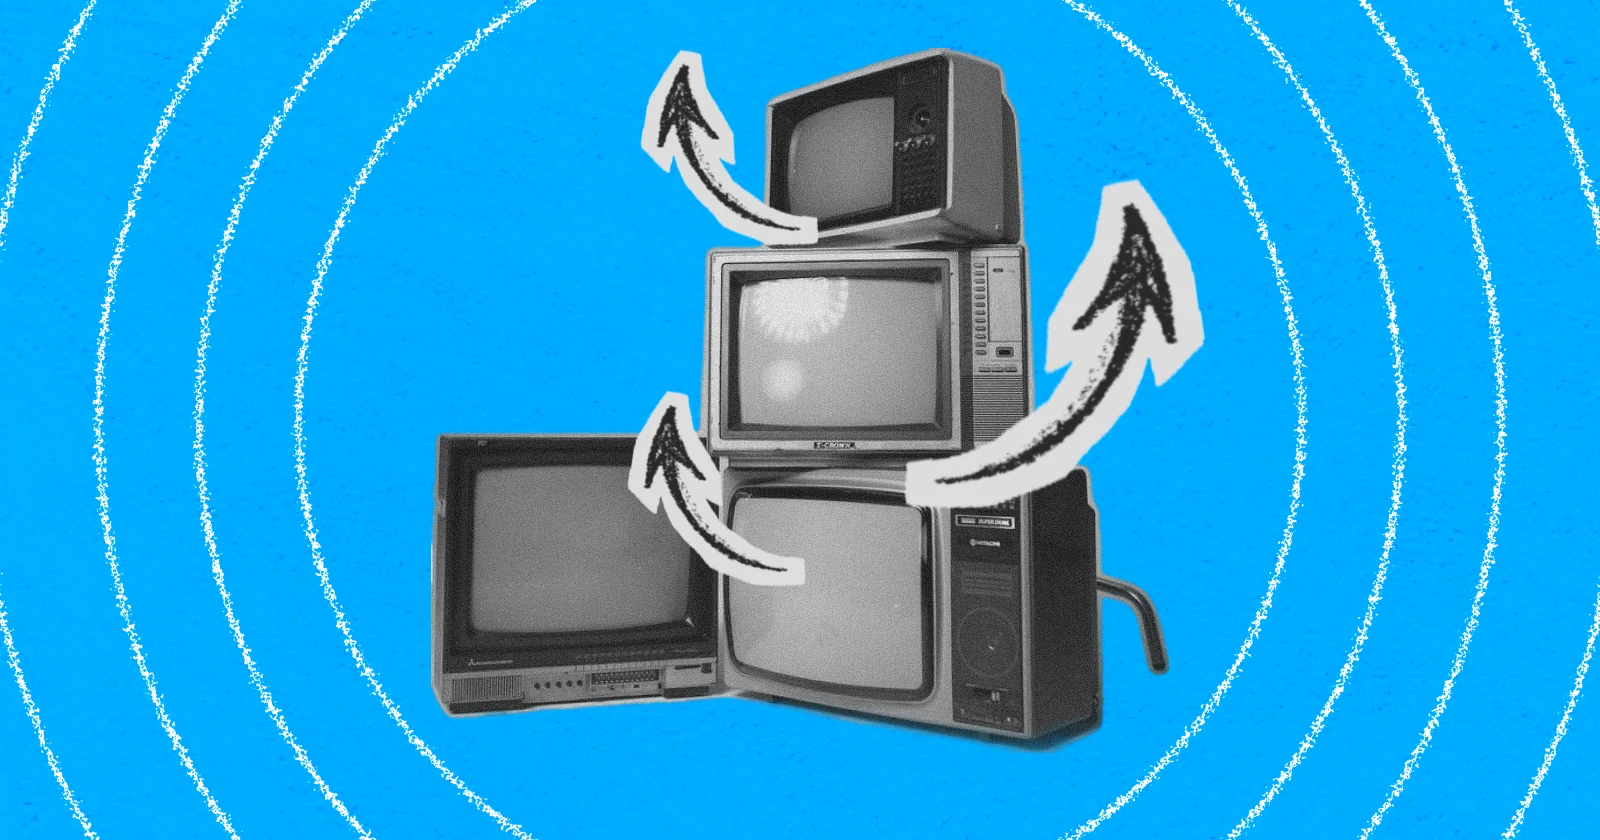
Connected TV has gone from niche to mainstream, now in roughly nine out of ten U.S. households. With advertisers spending billions to reach these viewers, knowing the numbers is critical to making smart media bets.
Connected TV refers to any television set that can stream video via the internet, whether through a built-in smart TV interface, a plug-in device such as Roku or Amazon Fire TV, or a connected gaming console. Unlike traditional broadcast or cable, CTV enables advertisers to combine the impact of the big screen with the precision and measurability of digital channels.
For marketers, connected TV statistics offer more than trivia—they reveal how audiences are moving, which platforms dominate, and where ad dollars generate the highest return. From roughly 243.6 million U.S. viewers in 2026 to video completion rates regularly exceeding 95% for non-skippable ads, accurate, current data makes it possible to plan campaigns that reach the right viewers, in the right context, at the right time.
In this article, we'll examine the most recent CTV stats available, explore audience behavior and platform preferences, and highlight advertising trends that matter for brands today. We'll also look at practical ways to use this data to refine targeting, improve campaign efficiency, and measure results.
Understanding who's watching (and how they're watching) is the starting point for any effective CTV campaign. From the number of households connected to the platforms they prefer, these audience insights reveal where attention is flowing and where your ad dollars can work hardest
CTV is making it clear it’s a go-to channel for both viewers and advertisers."— David Cohen, CEO, IAB.
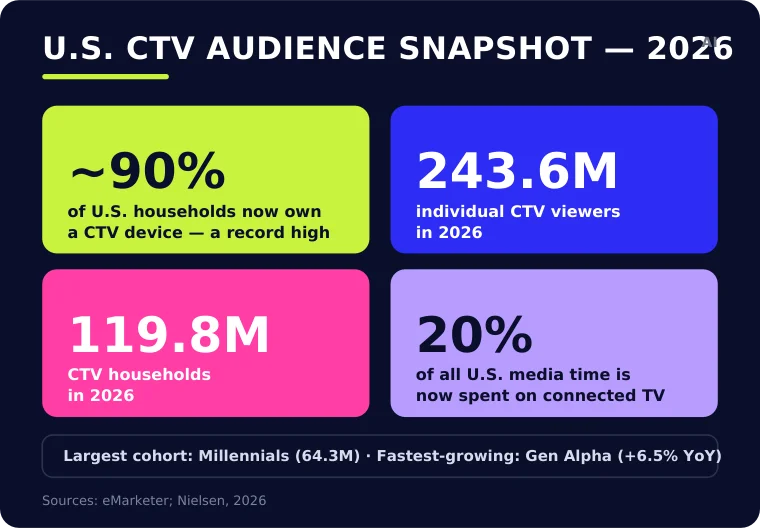
CTV audience snapshot 2026.
CTV device penetration and adoption rates
Connected TV usage in the U.S. is now firmly mainstream. As of 2025, around 90% of U.S. households owned at least one CTV device—a record high, and a dramatic increase from roughly 50% penetration a decade ago. In 2026, that translates to about 119.8 million households and 243.6 million individual CTV viewers. And the adoption trajectory shows no signs of slowing.
Smart TVs have overtaken external streaming devices as the primary gateway to CTV. eMarketer projects that by 2027, more than 75% of U.S. CTV users will stream via built-in smart TV apps rather than add-on devices. While Roku, Amazon Fire TV, and Apple TV remain significant, smart TV interfaces are becoming the default choice for new buyers.
💡 Still fuzzy on OTT vs CTV? → See the key differences in our article: OTT vs CTV
Connected TV watching statistics: Viewer demographics and income levels
CTV audiences skew younger, but adoption has spread across most age groups. Millennials remain the largest CTV cohort at 64.3 million viewers, followed by Gen Z at 55.7 million, Gen X at 52.3 million, and Baby Boomers at 37.4 million. Gen Alpha is smaller, at 23.3 million viewers, but is projected to be the fastest-growing cohort, with 6.5% year-over-year growth.
Income still shapes CTV value, but the better point is not that CTV is only affluent. It is that higher-income audiences remain especially valuable in premium streaming environments. Deloitte’s 2026 Digital Media Trends found that U.S. “fans” spend $71 per month on streaming subscriptions, 27% more than non-fans at $56, making fandom-heavy categories such as sports useful for reaching higher-value consumers. Separately, VAB research found that households earning $100,000+ are almost 13 times more likely to trust TV news than social media, and high-income households are more than twice as likely to purchase from advertisers seen during national TV news. For luxury, finance, travel, and other high-consideration categories, CTV’s income story is strongest when tied to context: premium news, live sports, and high-engagement entertainment.
Viewing habits and engagement
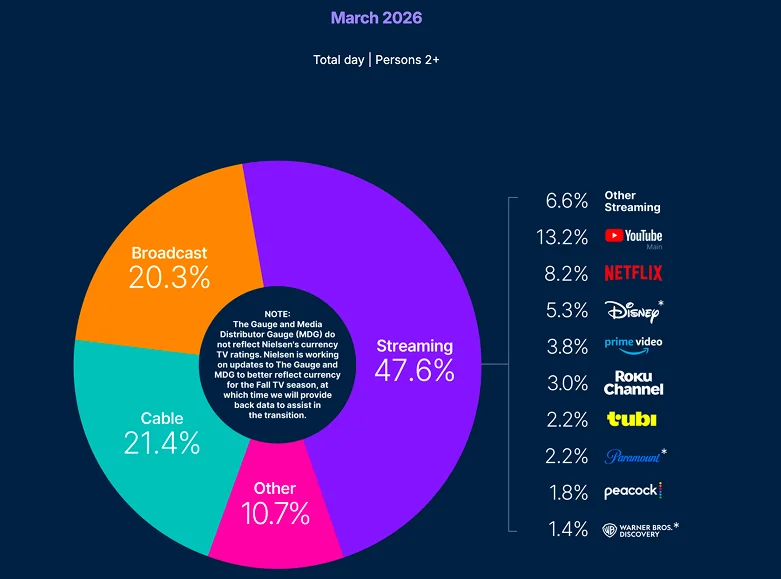
CTV is now a daily habit for many Americans. Connected TV commands roughly20% of all time spent with media in the U.S., and streaming hit a record47.5% of all TV viewing time in December 2025, holding at 47% into January 2026 and surpassing cable and broadcast combined. Notably, that December record was powered by live sports: back-to-back NFL games on Netflix and a late Prime Video game, alongside the Stranger Things finale. By March 2026, the figure stood at 47.6%.
Ad-supported streaming has surged, and consumers are on board—86% take ad-supported tiers when offered, and 75% have tried one in the last four years. Free ad-supported TV (FAST) platforms such as Pluto TV, Tubi, and The Roku Channel now reach well over125 million monthly U.S. viewers. Advertisers benefit from high engagement here—eMarketer's KPI data show engagement on interactive CTV ads reached 1.94% in Q2 2025, nearly double the 1% recorded a year earlier, and around one-third of users have purchased a product after seeing an ad on a connected TV.
Because we're free, we live and die by engagement—that aligns our incentives to put the viewer first. — Anjali Sud, CEO, Tubi.
{{connected-TV-statistics-2025-1="/tables"}}
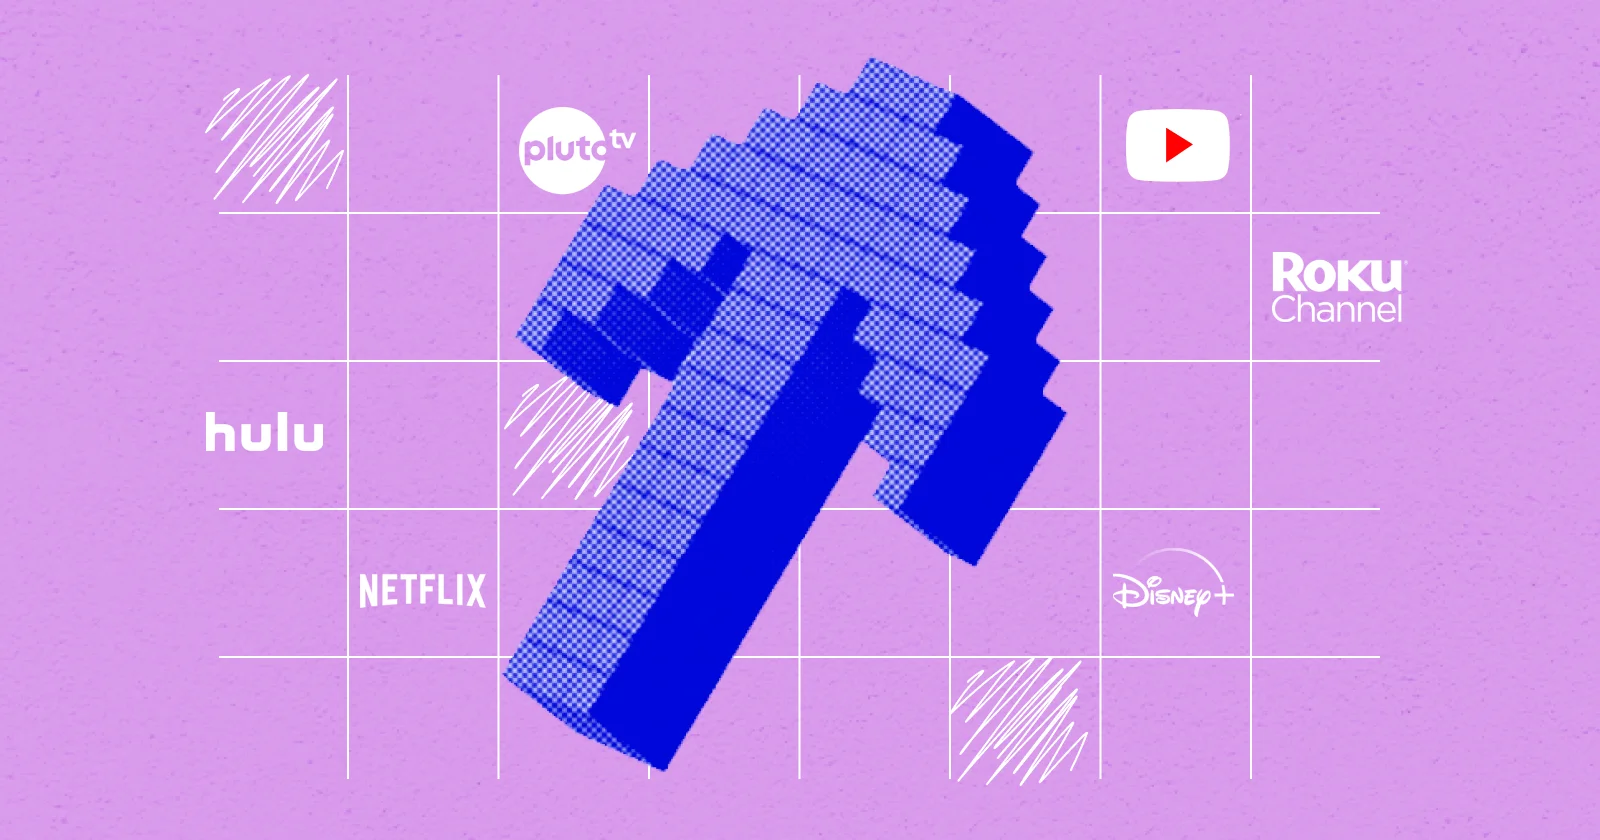
Device and platform preferences
Smart TVs lead device usage, but the CTV ecosystem is diverse. Many households use a combination of smart TV operating systems, streaming sticks, gaming consoles, and even connected cable boxes. The choice of platform often depends on available content, user interface, and subscription bundles.
From an advertising perspective, YouTube remains the single largest CTV ad seller, with eMarketer putting its net U.S. CTV ad revenue at around$9.2 billion in 2026; Amazon and Disney are the only other players above 10% of the market. Netflix and Disney+—newer to ad-supported tiers—have scaled quickly. Netflix's ad tier grew from 70 million monthly active users in 2024 to more than250 million monthly active viewers by its May 2026 Upfront, with over half of new sign-ups now choosing the ad-supported plan and the business on track to roughly $3 billion in annual ad revenue. (Netflix moved to a "monthly active viewers" measure in 2025, counting people per household rather than profiles, so part of that increase reflects the broader definition as well as real growth.)
Audiences may have sparked CTV's growth, but advertiser dollars are driving its momentum. The following figures highlight how quickly budgets are moving, how campaigns perform on the big screen, and why this channel is competing directly with, and in some cases overtaking, traditional television.
Growth of CTV advertising spend
CTV ad spend in the U.S. continues to climb. According to IAB, CTV ad spending rose to $23.6 billion in 2024 (16% year-over-year growth) and reached $26.6 billion in 2025. IAB projects it will climb to roughly$29.3 billion in 2026, up another 11%.
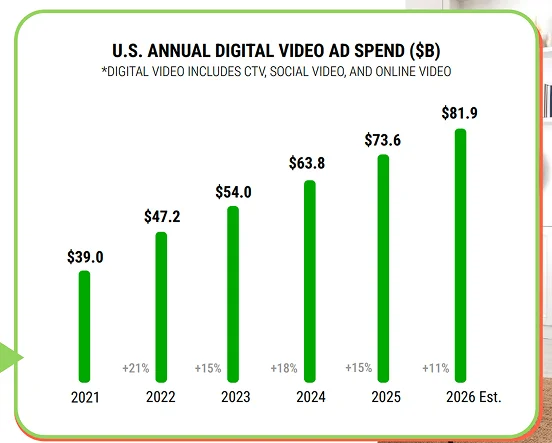
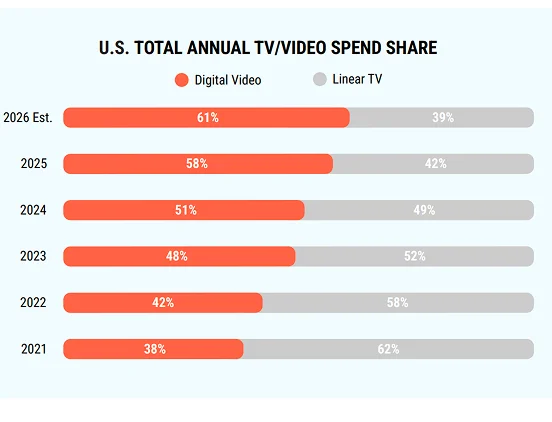
That growth is part of a broader story: IAB's total digital video category (CTV, social video, and online video) hit $72 billion in 2025 and is projected to surpass $80 billion in 2026—growing nearly 20% faster than the total ad market and, for the first time, accounting for more than 60% of all U.S. TV and video ad spend. (Within that category, social video edged ahead of CTV as the largest segment in 2025, though CTV remains the premium streaming environment advertisers turn to as they move budgets off linear.)
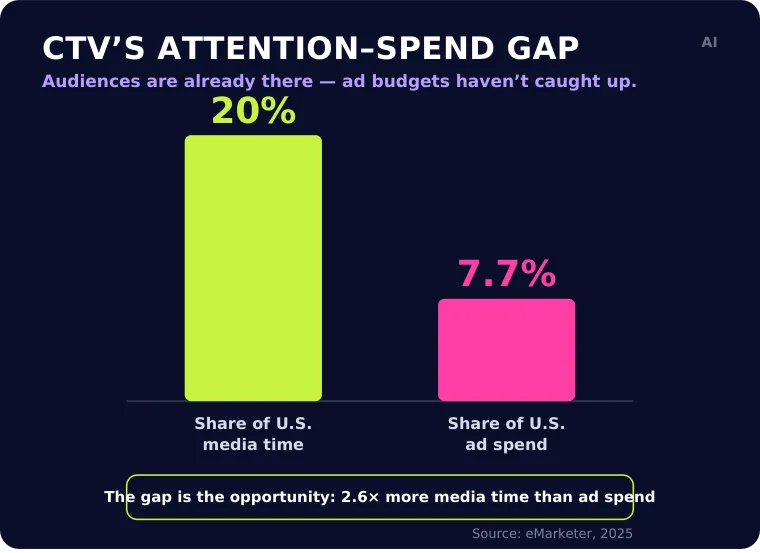
eMarketer, which measures CTV slightly more broadly than IAB, put 2025 U.S. CTV ad spend at$33.35 billion and forecasts$37.95 billion for 2026 (+14.5%), reaching $46.89 billion by 2028—the year it expects CTV to overtake traditional TV ($45.10 billion). Even so, ad budgets still lag attention: CTV captured about20% of U.S. media time in 2025 but just 7.7% of ad spend—a gap eMarketer expects to keep drawing dollars in.
CTV's attention–spend gap.
CTV ad performance metrics (CPM, video completion rates, brand lift)
CTV benchmarks are becoming stronger, but they are still less standartized than search or social metrics. Public CPM ranges typically put CTV/OTT at roughly $20–$65, with pricing shaped by targeting, platform, inventory quality, and premium content such as live sports. CTR is also a less useful benchmark on the TV screen, where the stronger indicators are completed views, incremental reach, attention, frequency, and lift. Innovid’s 2025 CTV benchmarks found that interactive CTV ads generated an average of 71 seconds of additional viewer time compared with standard pre-roll, while QR code usage more than tripled year over year. Brand-lift data also points in the same direction: advanced CTV formats are increasingly being measured against favourability, purchase intent, recall, site visits, and sales rather than exposure alone.
CTV is experiencing explosive growth, but we're still in the early innings of figuring out how to make it work at scale. — Anthony Katsur, CEO, IAB Tech Lab.
CTV’s clearest benchmark advantage is still completion. Recent Innovid data shows completion rates of 94.5% for 15-second CTV ads and 94.1% for 30-second ads, well above typical mobile and desktop video averages. That makes CTV valuable for full-message delivery, especially when advertisers need a story, offer, or brand cue to be seen in full. Still, completion should not be treated as proof of attention by itself. Because much of CTV inventory is non-skippable, VCR works best as a baseline quality signal, then needs to be read alongside other metrics cited above like frequency, attention, site visits, sales outcomes, etc.
CTV can support ROAS, but it should be framed through specific campaign evidence rather than as a universal benchmark against other digital channels. In 2026, TripleLift reported that a premium frozen-food brand using a Product Spotlight CTV unit delivered 116% ROAS among competitive buyers, 100% new-to-brand acquisition and 7 million unique households reached. The stronger takeaway is that CTV is becoming more accountable when creative, audience targeting and retail signals are built into the campaign from the start, not that it automatically outperforms search, social or retail media on ROAS.
Programmatic adoption in CTV
Programmatic buying is now the default direction of travel in CTV, but automation is only part of the story. IAB data shows that 85% of CTV purchases are now made programmatically, up from 75% a year earlier, while buyers expect 47% of CTV inventory to be biddable, up from 34%. The shift reflects advertisers’ demand for more control, more flexible activation and better audience targeting than traditional TV buying can usually provide.
Still, programmatic CTV is not simply “TV bought like display.” As more inventory becomes biddable, advertisers are asking for clearer content signals, show-level reporting and stronger proof of placement quality. Nielsen/Gracenote’s 2026 research found that 86% of U.S. media planners would move more linear TV budget into CTV if show-level targeting and reporting were available. So the next phase of programmatic CTV is not just scale. It is transparency: knowing what was bought, where it ran, who it reached and whether the placement matched the campaign’s goals.
Comparison with traditional TV advertising
Digital video has already moved ahead of linear TV, but CTV’s own crossover is still approaching. IAB reports that digital video—which includes CTV, online video and social video—surpassed linear TV ad spend for the first time in 2024. As mentioned, in 2026, U.S. digital video ad spend is projected to exceed $80 billion and account for more than 60% of total TV/video ad budgets.
Digital video share of total TV/video ad budgets (Source)
CTV is a major driver of that shift, though it should not be treated as synonymous with digital video overall. EMARKETER forecasts that U.S. CTV ad spend will overtake traditional TV by 2028, reaching $46.89 billion versus $45.10 billion for traditional TV. So the near-term story is that digital video has already crossed the line; CTV is expected to follow next.
The connected TV market is evolving fast, driven by changes in how people watch, how platforms monetize, and how advertisers buy. These trends are redefining viewing habits and reshaping the balance between streaming and traditional TV.
Shift from linear to streaming
The move from traditional linear television to streaming is now measurable in nearly every viewing dataset. In July 2023, streaming surpassed cable for the first time in U.S. viewing share, accounting for 38.7% of all TV usage compared to cable's 29.6% and broadcast's 20%. By December 2025, streaming's share had grown to a record47.5%, with linear continuing to contract.
Cord-cutting is a major driver: U.S. pay-TV households dropped below 70 million in 2024, down from over 100 million a decade ago. By 2027, pay TV is expected to drop further, to 47.8 million households.
The migration has pushed advertisers to adopt "converged TV" planning—allocating budgets across both linear and CTV to maintain reach.
Growth of ad-supported streaming services (FAST, AVOD)
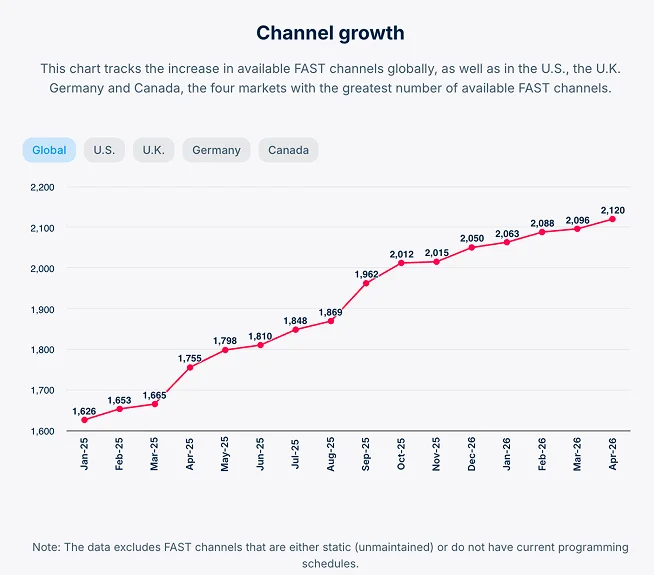
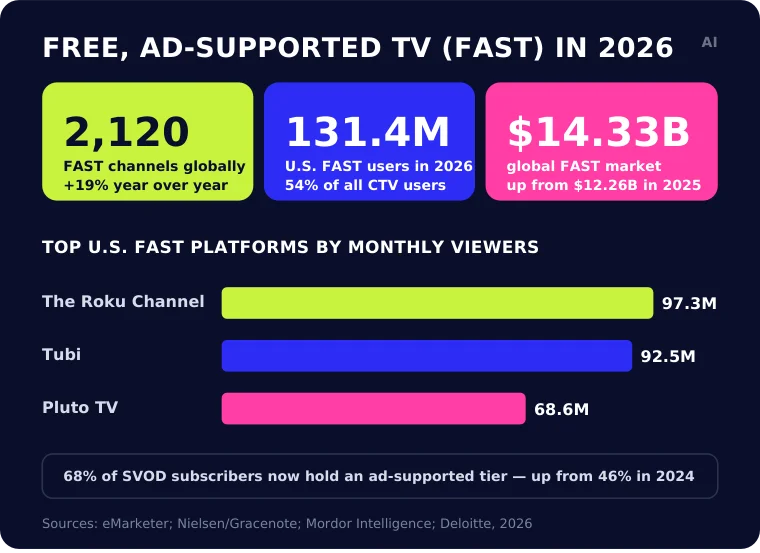
The FAST ecosystem is still expanding, but the story is moving from simple channel growth to scale, discoverability and ad quality. Nielsen/Gracenote’s Q2 2026 data tracks2,120 FAST channels globally, with channel count up 19% year over year. The market is growing too: one 2026 estimate values global FAST at $14.33 billion, up from $12.26 billion in 2025.
In the U.S., FAST is now a mainstream CTV behaviour rather than a niche workaround for subscription fatigue. EMARKETER forecasts131.4 million U.S. FAST users in 2026, equal to 54% of all CTV users. At the same time, Deloitte found that 68% of SVOD subscribers now have at least one ad-supported tier, up from 46% in 2024. In short, viewers still want premium and familiar content, but many are increasingly willing to accept advertising in exchange for lower costs or free access.
FAST in 2026.
FAST platforms offer distinct audience segments for advertisers. According to eMarketer, the Roku Channel leads with about 97.3 million U.S. viewers, followed by Tubi (92.5 million) and Pluto TV (68.6 million), each shaped by unique programming and discovery models.
AVOD services like Netflix, Hulu, Max, and Disney+ are bridging premium and free tiers, offering ad-supported plans that lower costs for subscribers while driving new ad revenue.
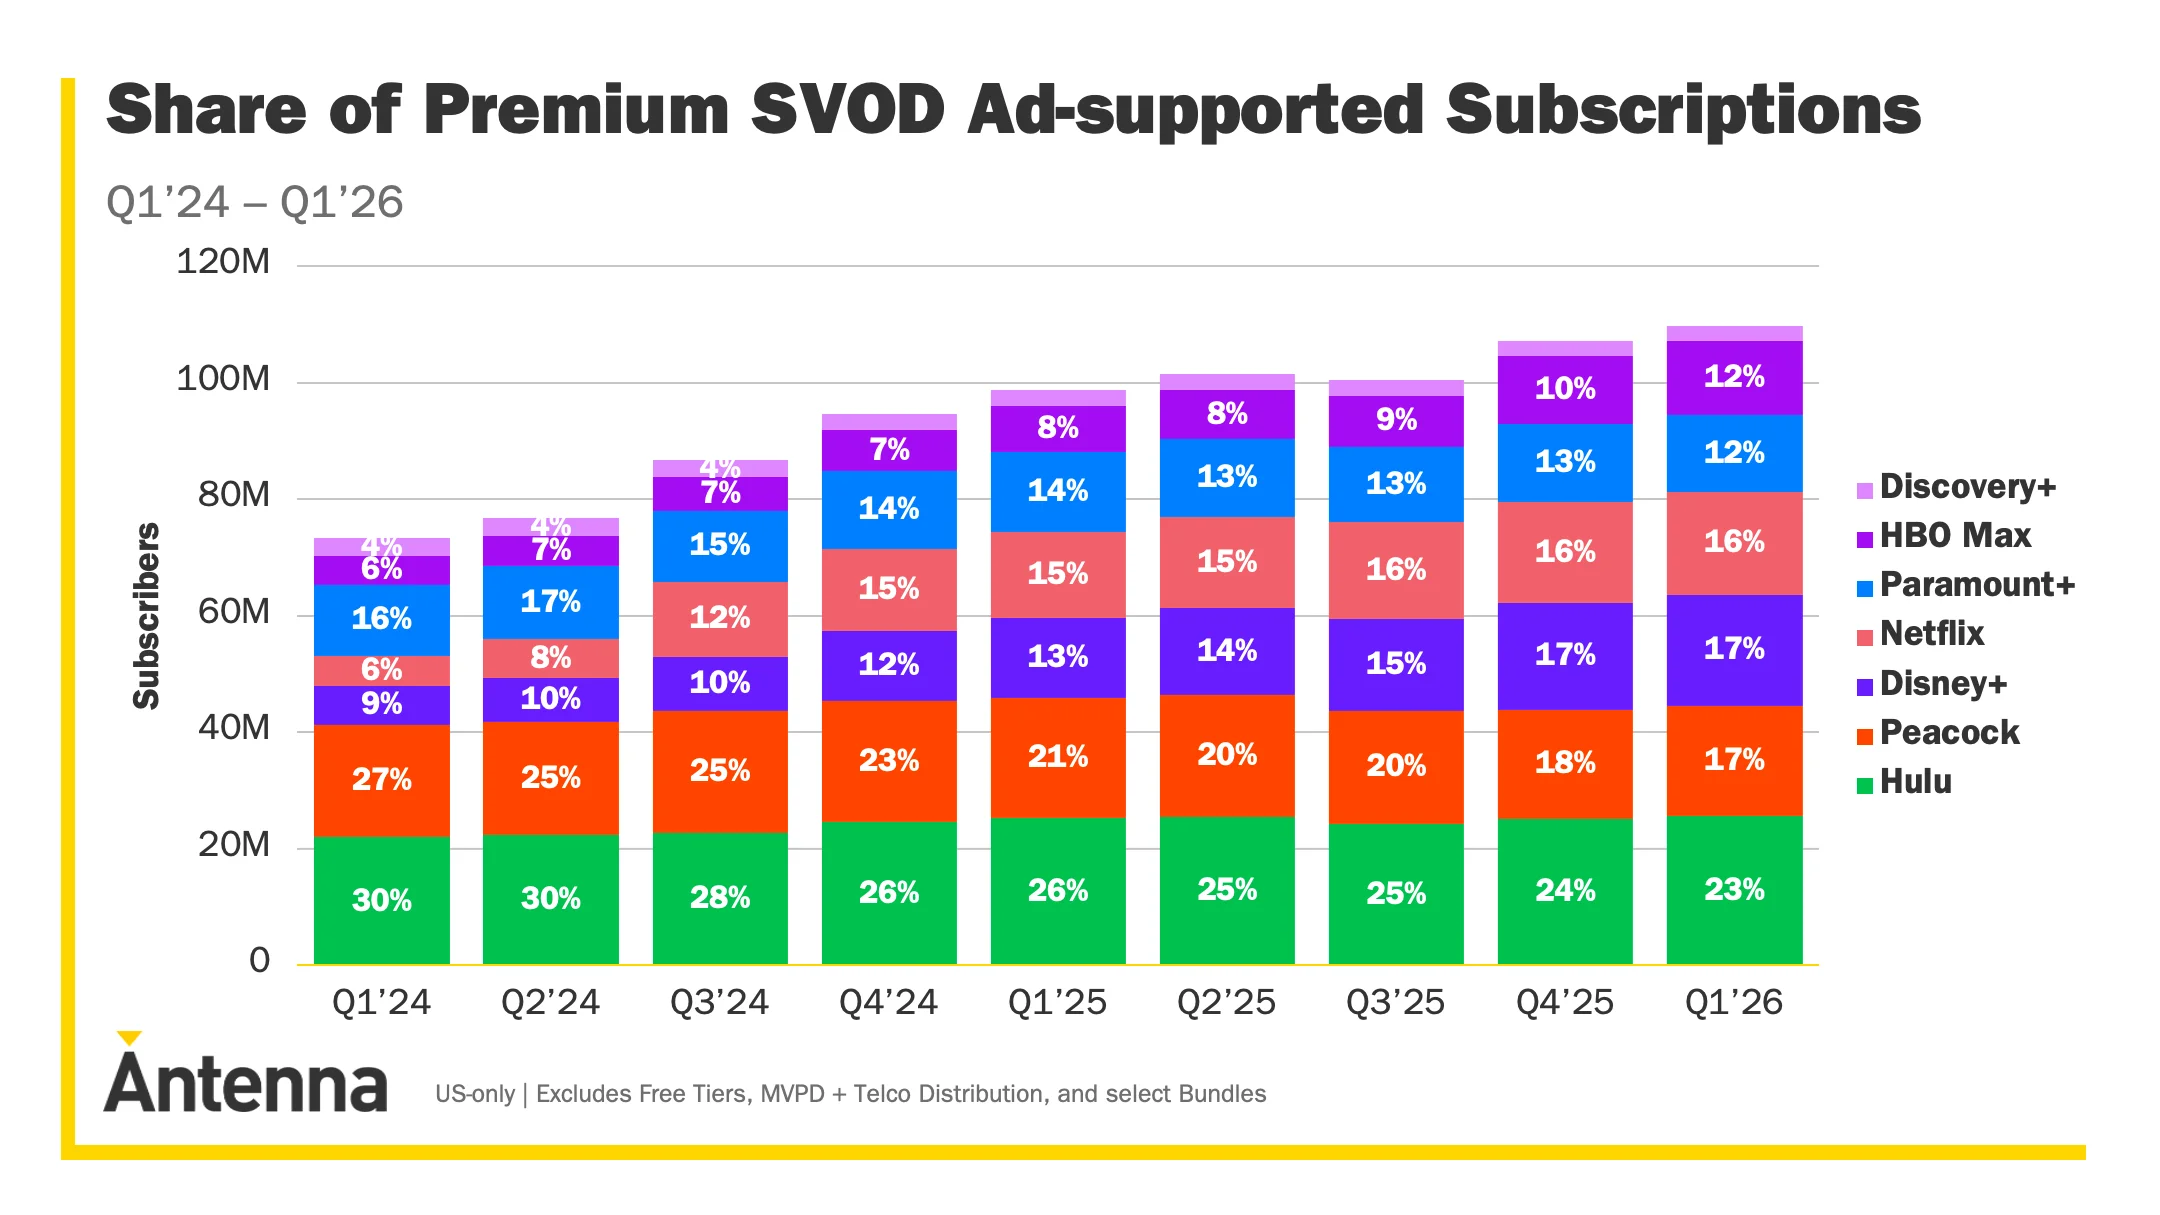
Ad-supported streaming is still growing, but the market is starting to mature. Antenna estimates that U.S. ad-supported premium SVOD subscriptions reached 110 million by the end of Q1 2026, up from nearly 100 million a year earlier and 53 million two years earlier. The bigger shift is in subscriber acquisition: among premium SVOD services with an ad plan, ad-supported tiers accounted for 48% of subscriptions in Q1 2026 and generated 59% of gross subscriber additions. Over the nine quarters ending in Q1 2026, ad-supported plans drove 78% of net subscriber additions, making them the main growth engine for premium streaming.
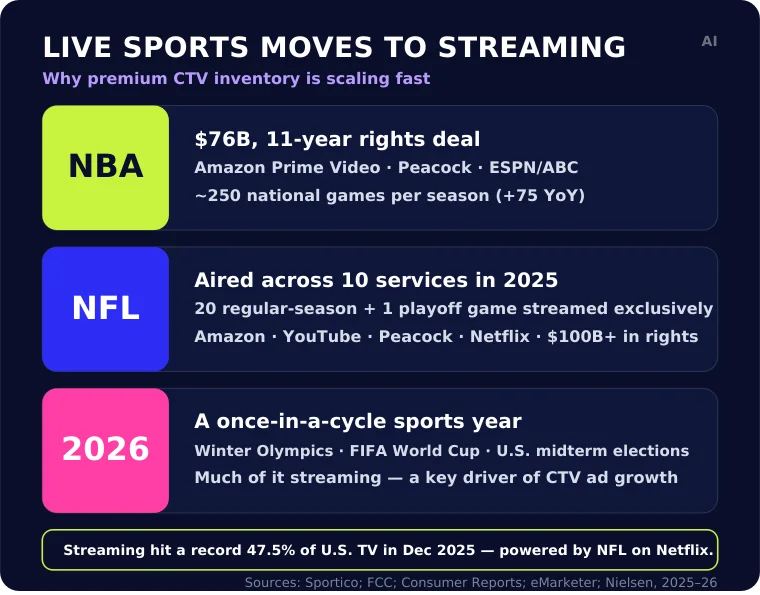
If any single force explains why advertiser dollars keep moving to connected TV, it is live sports. The IAB credits the migration of football, baseball, and soccer to streaming as a direct driver of CTV's recent ad growth. The 2025–26 season marked an inflection point: the NBA began an 11-year, roughly$76 billion rights agreement split across Amazon Prime Video, NBCUniversal's Peacock, and ESPN/ABC, with close to250 NBA games now airing nationally each season—about 75 more than the year before. The NFL, meanwhile, spread its 2025 games across ten different services, with 20 regular-season games and one playoff game streamed exclusively on Amazon, YouTube, Peacock, and Netflix, as its media-rights deals climb past $100 billion over their lifetime.
The advertising consequences are significant. Sports audiences watch live, gather at scale, and expect commercial breaks—exactly the conditions sponsors prize. Streamers building ad businesses have pursued sports precisely because it delivers premium, high-attention inventory that is now available programmatically.
Live sports moves to streaming
2026 compounds the effect. A rare convergence of the Milan-Cortina Winter Olympics, the FIFA World Cup, and the U.S. midterm elections—much of it streaming—is one of the main reasons eMarketer expects CTV ad spend to accelerate this year. For advertisers, live sports on CTV now pairs the reach of traditional broadcast with the targeting and measurement of digital.
Regional and demographic disparities in CTV reach
Connected TV adoption still reflects broader digital-access patterns, but the divide is more nuanced than a simple urban-versus-rural split. U.S. broadband adoption is now fairly close between urban and rural adults, with Pew’s 2025 survey showing home broadband subscriptions at 75% among urban adults and 71% among rural adults, compared with 84% among suburban adults. The sharper gap is income: only 54% of adults in households earning under $30,000 subscribe to home broadband, versus 94% of those earning $100,000 or more.
That matters for CTV because large-screen streaming usually depends on reliable home internet, connected devices and enough household budget for streaming hardware or services. Lower-income viewers are also more likely to rely on smartphones as their main internet connection, which may shift video consumption toward mobile rather than the living-room screen. For advertisers, the practical point is that CTV has broad reach, but it should not be treated as perfectly even reach. Rural, lower-income and broadband-constrained audiences may still require complementary media planning across mobile, linear TV, local media and other channels.
Cultural relevance shapes CTV usage as much as access or age. Hispanic viewers are especially streaming-forward: Nielsen reports that streaming now accounts for 55.8% of their total TV time, compared with 46% for the broader U.S. population. Language still matters too. Earlier Horowitz research found that 75% of Latine viewers watch at least some content in Spanish, and almost 70% of Spanish-dominant and bilingual Latine consumers consider Spanish-language content important when choosing a TV service.
AANHPI audiences show a similar streaming-first pattern. Nielsen’s 2026 data shows that 61% of AANHPI ad-supported TV time is spent with streaming, while 45% of AANHPI adults are cord-nevers—the highest rate of any U.S. racial or ethnic group. For advertisers, the point is clear: CTV planning cannot treat multicultural audiences as a single audience segment. Language, cultural context, content genre and platform choice all affect where attention goes and which messages feel relevant.
Cross-device integration and AI-driven optimization
Advertisers increasingly seek to connect CTV with other screens to manage reach and frequency holistically. Technologies like device graphs and unified IDs link viewing across TVs, smartphones, and desktops, allowing for more precise attribution. Yet adoption is uneven—only32%of global marketers currently measure TV and digital together.
Artificial intelligence is starting to change this. AI tools can analyze connected TV viewership and performance data in real time to adjust bids, placements, and even creative variants. Campaigns that used AI-driven creative optimization reported up to40%higher brand recall than static creative approaches.
CTV's rapid growth has outpaced the development of unified measurement standards. Platforms often rely on proprietary metrics, making it difficult to compare performance across services. Multiple "currencies" coexist—from Nielsen Digital Ad Ratings to Comscore's cross-platform measures—complicating deduplication of reach.
… the real impediment to apples-to-apples comparisons between CTV and linear TV is that CTV providers aren't selling apples—they're selling oranges. So the goal [is] to figure out a fair rate of exchange between linear TV's apples and CTV's oranges—like you would with two different forms of currency. — Germaine Montagne, Head of Marketing, TVision Insights.
Privacy regulation adds another layer of complexity. With laws like CCPA and GDPR affecting how viewing data is collected and shared, advertisers must prioritize compliance while still leveraging first-party and contextual data for targeting.
CTV's value is in the depth of data it provides. When used effectively, that data can sharpen audience targeting, guide creative decisions, and prove the impact of every ad dollar spent.
Targeting strategies based on data insights
CTV's mix of household-level data, platform analytics, and integration with first-party CRM systems makes it one of the most precise TV buying environments available. Advertisers can segment audiences by demographics, location, viewing behavior, and even purchase intent.
A common best practice is to merge first-party data with CTV platform data to reach high-value customers across multiple services. For example, a retailer can retarget website visitors with CTV ads through platforms like Hulu or YouTube TV using privacy-compliant data matching.
💡 Check out our guide on OTT advertising strategies that deliver, complete with tactical frameworks for targeting and measurement across leading platforms.
Campaign optimization tips
CTV campaigns can be optimized in-flight using the same metrics that drive digital performance campaigns. Advertisers can track impression delivery, completion rates, and cost per completed view in real time, moving budget toward the best-performing platforms or creatives.
Interactive ad formats—such as QR codes or overlays—can be tested alongside standard video ads to measure engagement impact.
Frequency management is equally important. Overexposure risks frustrating viewers, especially in ad-supported streaming environments. Programmatic tools allow advertisers to cap impressions per household and spread exposure across multiple apps to maintain message freshness.
💡 Smart Supply is AI Digital's answer to one of CTV's biggest problems: the inefficient supply chain. Instead of routing campaigns through biased platforms or inflated bid streams, Smart Supply builds custom deals focused on your KPIs. Low-value publishers, indirect traffic, and wasteful hops are stripped out, ensuring clean, fraud-free inventory with IVT protection and premium SSP pathways that deliver both quality and scale.
Measuring ROI and engagement
CTV's ability to link ad exposure to measurable outcomes is one of its biggest advantages over traditional TV. Measurement can include:
Brand lift studies to gauge awareness, favorability, or intent.
Attribution analysis matching CTV ad exposures to web visits, app installs, or in-store purchases.
Incremental reach reporting to quantify new audiences reached beyond linear TV.
Some advertisers are embedding QR codes in CTV ads to directly track scans and conversions, shortening the path from impression to action. Brands incorporating direct-response elements into CTV see substantial gains while also outperforming other channels in conversion efficiency.
Connected TV has moved beyond early adoption to become a core part of how Americans watch video—and how advertisers reach them. With roughly 9 in 10 U.S. households connected, ad spend growing in double digits, and measurable outcomes across the funnel, CTV offers a rare combination of scale and precision. The data shows that this channel is no longer optional for brands looking to reach engaged, high-value audiences.
Key takeaways for advertisers:
Prioritize ad-supported streaming, but buy selectively. FAST and AVOD now offer real scale, but not all inventory carries the same value. Focus on environments with clear content signals, reliable supply paths and enough transparency to understand where ads actually ran.
Plan for reach and precision together. CTV can extend TV reach while adding audience, household and first-party data options, but those tools work best when they are used to manage incremental reach, frequency and overlap, not simply to narrow the audience.
Follow live sports, but price it carefully. Rights moving across Amazon, Netflix, Peacock, YouTube and other streaming platforms are creating premium CTV inventory around live, high-demand viewing. The opportunity is strong, especially in a packed 2026 events year, but advertisers still need to watch CPMs, duplication and audience concentration.
Use interactive formats where they fit the viewer moment. QR codes, overlays, pause ads and cross-device retargeting can connect big-screen exposure with measurable action. They work best when the call to action is simple, the creative earns the extra step and frequency is controlled across devices.
Invest in measurement that can survive scrutiny. Brand lift, incrementality testing, attention signals, site visits, sales attribution and incremental reach reporting all have a role. The goal is not to make CTV look like search. It is to prove what CTV adds to the wider media plan: reach, attention, memory, response and measurable business impact.
Connected TV is growing quickly, but the brands seeing the biggest returns are those using data intelligently, optimizing in real time, and measuring impact beyond simple impressions.
Ready to turn insights into results? Reach out. With AI Digital, you get a CTV strategy that blends premium inventory, precision targeting, and AI-powered optimization. We'll help you reach more of the right viewers, cut wasted spend, and deliver measurable growth that proves the value of every dollar.
Blind spot
Key issues
Business impact
AI Digital solution
Lack of transparency in AI models
• Platforms own AI models and train on proprietary data • Brands have little visibility into decision-making • "Walled gardens" restrict data access
• Inefficient ad spend • Limited strategic control • Eroded consumer trust • Potential budget mismanagement
Open Garden framework providing: • Complete transparency • DSP-agnostic execution • Cross-platform data & insights
Optimizing ads vs. optimizing impact
• AI excels at short-term metrics but may struggle with brand building • Consumers can detect AI-generated content • Efficiency might come at cost of authenticity
• Short-term gains at expense of brand health • Potential loss of authentic connection • Reduced effectiveness in storytelling
Smart Supply offering: • Human oversight of AI recommendations • Custom KPI alignment beyond clicks • Brand-safe inventory verification
The illusion of personalization
• Segment optimization rebranded as personalization • First-party data infrastructure challenges • Personalization vs. surveillance concerns
• Potential mismatch between promise and reality • Privacy concerns affecting consumer trust • Cost barriers for smaller businesses
Elevate platform features: • Real-time AI + human intelligence • First-party data activation • Ethical personalization strategies
AI-Driven efficiency vs. decision-making
• AI shifting from tool to decision-maker • Black box optimization like Google Performance Max • Human oversight limitations
• Strategic control loss • Difficulty questioning AI outputs • Inability to measure granular impact • Potential brand damage from mistakes
Managed Service with: • Human strategists overseeing AI • Custom KPI optimization • Complete campaign transparency
Fig. 1. Summary of AI blind spots in advertising
Dimension
Walled garden advantage
Walled garden limitation
Strategic impact
Audience access
Massive, engaged user bases
Limited visibility beyond platform
Reach without understanding
Data control
Sophisticated targeting tools
Data remains siloed within platform
Fragmented customer view
Measurement
Detailed in-platform metrics
Inconsistent cross-platform standards
Difficult performance comparison
Intelligence
Platform-specific insights
Limited data portability
Restricted strategic learning
Optimization
Powerful automated tools
Black-box algorithms
Reduced marketer control
Fig. 2. Strategic trade-offs in walled garden advertising.
Core issue
Platform priority
Walled garden limitation
Real-world example
Attribution opacity
Claiming maximum credit for conversions
Limited visibility into true conversion paths
Meta and TikTok's conflicting attribution models after iOS privacy updates
Data restrictions
Maintaining proprietary data control
Inability to combine platform data with other sources
Amazon DSP's limitations on detailed performance data exports
Cross-channel blindspots
Keeping advertisers within ecosystem
Fragmented view of customer journey
YouTube/DV360 campaigns lacking integration with non-Google platforms
Black box algorithms
Optimizing for platform revenue
Reduced control over campaign execution
Self-serve platforms using opaque ML models with little advertiser input
Performance reporting
Presenting platform in best light
Discrepancies between platform-reported and independently measured results
Consistently higher performance metrics in platform reports vs. third-party measurement
Fig. 1. The Walled garden misalignment: Platform interests vs. advertiser needs.
Key dimension
Challenge
Strategic imperative
ROAS volatility
Softer returns across digital channels
Shift from soft KPIs to measurable revenue impact
Media planning
Static plans no longer effective
Develop agile, modular approaches adaptable to changing conditions
Brand/performance
Traditional division dissolving
Create full-funnel strategies balancing long-term equity with short-term conversion
Capability
Key features
Benefits
Performance data
Elevate forecasting tool
• Vertical-specific insights • Historical data from past economic turbulence • "Cascade planning" functionality • Real-time adaptation
• Provides agility to adjust campaign strategy based on performance • Shows which media channels work best to drive efficient and effective performance • Confident budget reallocation • Reduces reaction time to market shifts
• Dataset from 10,000+ campaigns • Cuts response time from weeks to minutes
• Reaches people most likely to buy • Avoids wasted impressions and budgets on poor-performing placements • Context-aligned messaging
• 25+ billion bid requests analyzed daily • 18% improvement in working media efficiency • 26% increase in engagement during recessions
Full-funnel accountability
• Links awareness campaigns to lower funnel outcomes • Tests if ads actually drive new business • Measures brand perception changes • "Ask Elevate" AI Chat Assistant
• Upper-funnel to outcome connection • Sentiment shift tracking • Personalized messaging • Helps balance immediate sales vs. long-term brand building
• Natural language data queries • True business impact measurement
Open Garden approach
• Cross-platform and channel planning • Not locked into specific platforms • Unified cross-platform reach • Shows exactly where money is spent
• Reduces complexity across channels • Performance-based ad placement • Rapid budget reallocation • Eliminates platform-specific commitments and provides platform-based optimization and agility
• Coverage across all inventory sources • Provides full visibility into spending • Avoids the inability to pivot across platform as you’re not in a singular platform
Fig. 1. How AI Digital helps during economic uncertainty.
Trend
What it means for marketers
Supply & demand lines are blurring
Platforms from Google (P-Max) to Microsoft are merging optimization and inventory in one opaque box. Expect more bundled “best available” media where the algorithm, not the trader, decides channel and publisher mix.
Walled gardens get taller
Microsoft’s O&O set now spans Bing, Xbox, Outlook, Edge and LinkedIn, which just launched revenue-sharing video programs to lure creators and ad dollars. (Business Insider)
Retail & commerce media shape strategy
Microsoft’s Curate lets retailers and data owners package first-party segments, an echo of Amazon’s and Walmart’s approaches. Agencies must master seller-defined audiences as well as buyer-side tactics.
AI oversight becomes critical
Closed AI bidding means fewer levers for traders. Independent verification, incrementality testing and commercial guardrails rise in importance.
Fig. 1. Platform trends and their implications.
Metric
Connected TV (CTV)
Linear TV
Video Completion Rate
94.5%
70%
Purchase Rate After Ad
23%
12%
Ad Attention Rate
57% (prefer CTV ads)
54.5%
Viewer Reach (U.S.)
85% of households
228 million viewers
Retail Media Trends 2025
Access Complete consumer behaviour analyses and competitor benchmarks.
Identify and categorize audience groups based on behaviors, preferences, and characteristics
Michaels Stores: Implemented a genAI platform that increased email personalization from 20% to 95%, leading to a 41% boost in SMS click through rates and a 25% increase in engagement.
Estée Lauder: Partnered with Google Cloud to leverage genAI technologies for real-time consumer feedback monitoring and analyzing consumer sentiment across various channels.
High
Medium
Automated ad campaigns
Automate ad creation, placement, and optimization across various platforms
Showmax: Partnered with AI firms toautomate ad creation and testing, reducing production time by 70% while streamlining their quality assurance process.
Headway: Employed AI tools for ad creation and optimization, boosting performance by 40% and reaching 3.3 billion impressions while incorporating AI-generated content in 20% of their paid campaigns.
High
High
Brand sentiment tracking
Monitor and analyze public opinion about a brand across multiple channels in real time
L’Oréal: Analyzed millions of online comments, images, and videos to identify potential product innovation opportunities, effectively tracking brand sentiment and consumer trends.
Kellogg Company: Used AI to scan trending recipes featuring cereal, leveraging this data to launch targeted social campaigns that capitalize on positive brand sentiment and culinary trends.
High
Low
Campaign strategy optimization
Analyze data to predict optimal campaign approaches, channels, and timing
DoorDash: Leveraged Google’s AI-powered Demand Gen tool, which boosted its conversion rate by 15 times and improved cost per action efficiency by 50% compared with previous campaigns.
Kitsch: Employed Meta’s Advantage+ shopping campaigns with AI-powered tools to optimize campaigns, identifying and delivering top-performing ads to high-value consumers.
High
High
Content strategy
Generate content ideas, predict performance, and optimize distribution strategies
JPMorgan Chase: Collaborated with Persado to develop LLMs for marketing copy, achieving up to 450% higher clickthrough rates compared with human-written ads in pilot tests.
Hotel Chocolat: Employed genAI for concept development and production of its Velvetiser TV ad, which earned the highest-ever System1 score for adomestic appliance commercial.
High
High
Personalization strategy development
Create tailored messaging and experiences for consumers at scale
Stitch Fix: Uses genAI to help stylists interpret customer feedback and provide product recommendations, effectively personalizing shopping experiences.
Instacart: Uses genAI to offer customers personalized recipes, mealplanning ideas, and shopping lists based on individual preferences and habits.
Medium
Medium
Share article
Url copied to clipboard
No items found.
Subscribe to our Newsletter
THANK YOU FOR YOUR SUBSCRIPTION
Oops! Something went wrong while submitting the form.
Questions? We have answers
Have other questions?
If you have more questions, contact us so we can help.

.svg)
.svg)