Digital Display Advertising: A Complete Guide to Formats, Visibility, Targeting & Performance
Mary Gabrielyan
December 1, 2025
23
minutes read
Display advertising wins when quality beats quantity—visible, human, attention-worthy impressions that you can tie to lift. This guide unpacks formats, targeting and the auction tech, then shows how to use viewability, attention and AI-led optimization to turn spend into measurable outcomes.
Digital display advertising has come a long way from static banners tucked into the margins of websites. Today it’s an AI-assisted, programmatic marketplace that buys a single impression in milliseconds, optimizes toward outcomes, and increasingly values the quality of human attention— not just whether a pixel appeared on a screen. In this guide, we unpack what display advertising is (and is not), where it fits next to search and native, which formats to use, how visibility and attention work, what to measure, and the technology that makes it all happen. Throughout, you’ll find recent research and practical steps you can apply right away.
⚡ Impressions are the invitation; attention is acceptance. Optimize for both, and you earn outcomes.
What is digital display advertising?
Digital display advertising is any paid visual ad unit delivered across the open web and apps—typically purchased programmatically—using images, HTML5, video, or interactive elements to build awareness, drive consideration, or prompt action. Display inventory spans desktop, mobile web, and in-app placements across publishers, news, lifestyle sites, utilities, forums, and more. It includes standard banners, rich media, video, interstitials, and native display placements.
Display differs from legacy “ad network” buys because most delivery now happens via real-time bidding (RTB) on demand-side platforms (DSPs), where algorithms evaluate each opportunity against your targeting, budget, and bid strategy, then transact on an impression if it’s likely to achieve your goal.
In the U.S., programmatic already accounts for over 90% of all display ad spending—underscoring how automated the channel has become.
Display ads vs. banner ads
“Banner ad” is a subset of “display ad.” Banners are standard, rectangular units (e.g., 300×250, 728×90, 300×600). “Display” is the umbrella term covering banners plus rich media, expandable/interactive units, in-feed native display, interstitials, and out-stream video.
⚡ If you need a mental shortcut: all banners are display, but not all display is a banner.
{{advertising-seo-1="/tables"}}
How display ads work
Display buying is a real-time auction for a single impression. Every time a page or app loads, multiple buyers compete for that one ad slot. The decision (who wins, what price, which creative) is made in a fraction of a second, then measurement and optimization kick in for the next opportunity.
Page/app loads → the ad request is created: The publisher’s page or app calls its ad server or supply-side platform (SSP) with details about the opportunity: slot size, page/app context, approximate location, device type, and any available first-party signals. The SSP packages this into a bid request and sends it to one or more ad exchanges.
Auction kicks off across exchanges: Demand-side platforms (DSPs) receive the bid request and decide whether to bid. Each DSP evaluates the impression against your campaign settings:
Performance history: how similar placements performed for your goal (e.g., attentive time, conversions, lift).
Pacing and budget: how much is left to spend and how quickly.
Bid strategy: target CPA/ROAS, viewability or attention pre-bid filters, brand suitability rules. If the impression looks promising, the DSP submits a bid and the creative ID that should run.
Best eligible bid wins → the ad is served: The exchange runs a lightning-fast auction among all valid bids and selects a winner (highest price that meets the publisher’s rules). The publisher’s ad server then returns the winning ad markup. The user’s device fetches the creative assets (image, HTML5, video) and renders the ad in the slot.
Verification and quality controls run: Quality checks occur both pre-bid and post-bid:
Post-bid: measurement pixels confirm viewability, time-in-view, geography, and detect IVT; brand-safety tools validate the page/app content that actually rendered.
Measurement and optimization close the loop: All signals flow back into your DSP or optimization layer: impressions, viewability, attention/time-in-view, interactions, conversions, and lift (if a study is running). The system then:
Raises or lowers bids by placement, domain, app, and audience.
Shifts budget to higher-quality supply paths.
Rotates or suppresses creatives based on fatigue and performance.
Adjusts frequency so the same user isn’t overexposed.
⚡ Your bid request is your résumé: pre-bid quality decides whether you enter the auction at all.
This feedback happens continuously so the next auction reflects what just worked (or didn’t).
💡 For a deeper primer on real-time bidding, auctions, and roles of DSPs/SSPs/ad exchanges, see AI Digital’s overview of programmatic advertising.
Display vs. search vs. native advertising
Choosing between display advertisement, search, and native starts with intent and context:
Search meets people at the moment they’re actively looking for an answer.
Display introduces or reinforces a message while they browse, using visual formats to build familiarity and spark consideration.
Native blends into the reading or scrolling experience to educate and nudge without breaking flow.
⚡ Search harvests intent, display creates it, and native persuades inside the content experience.
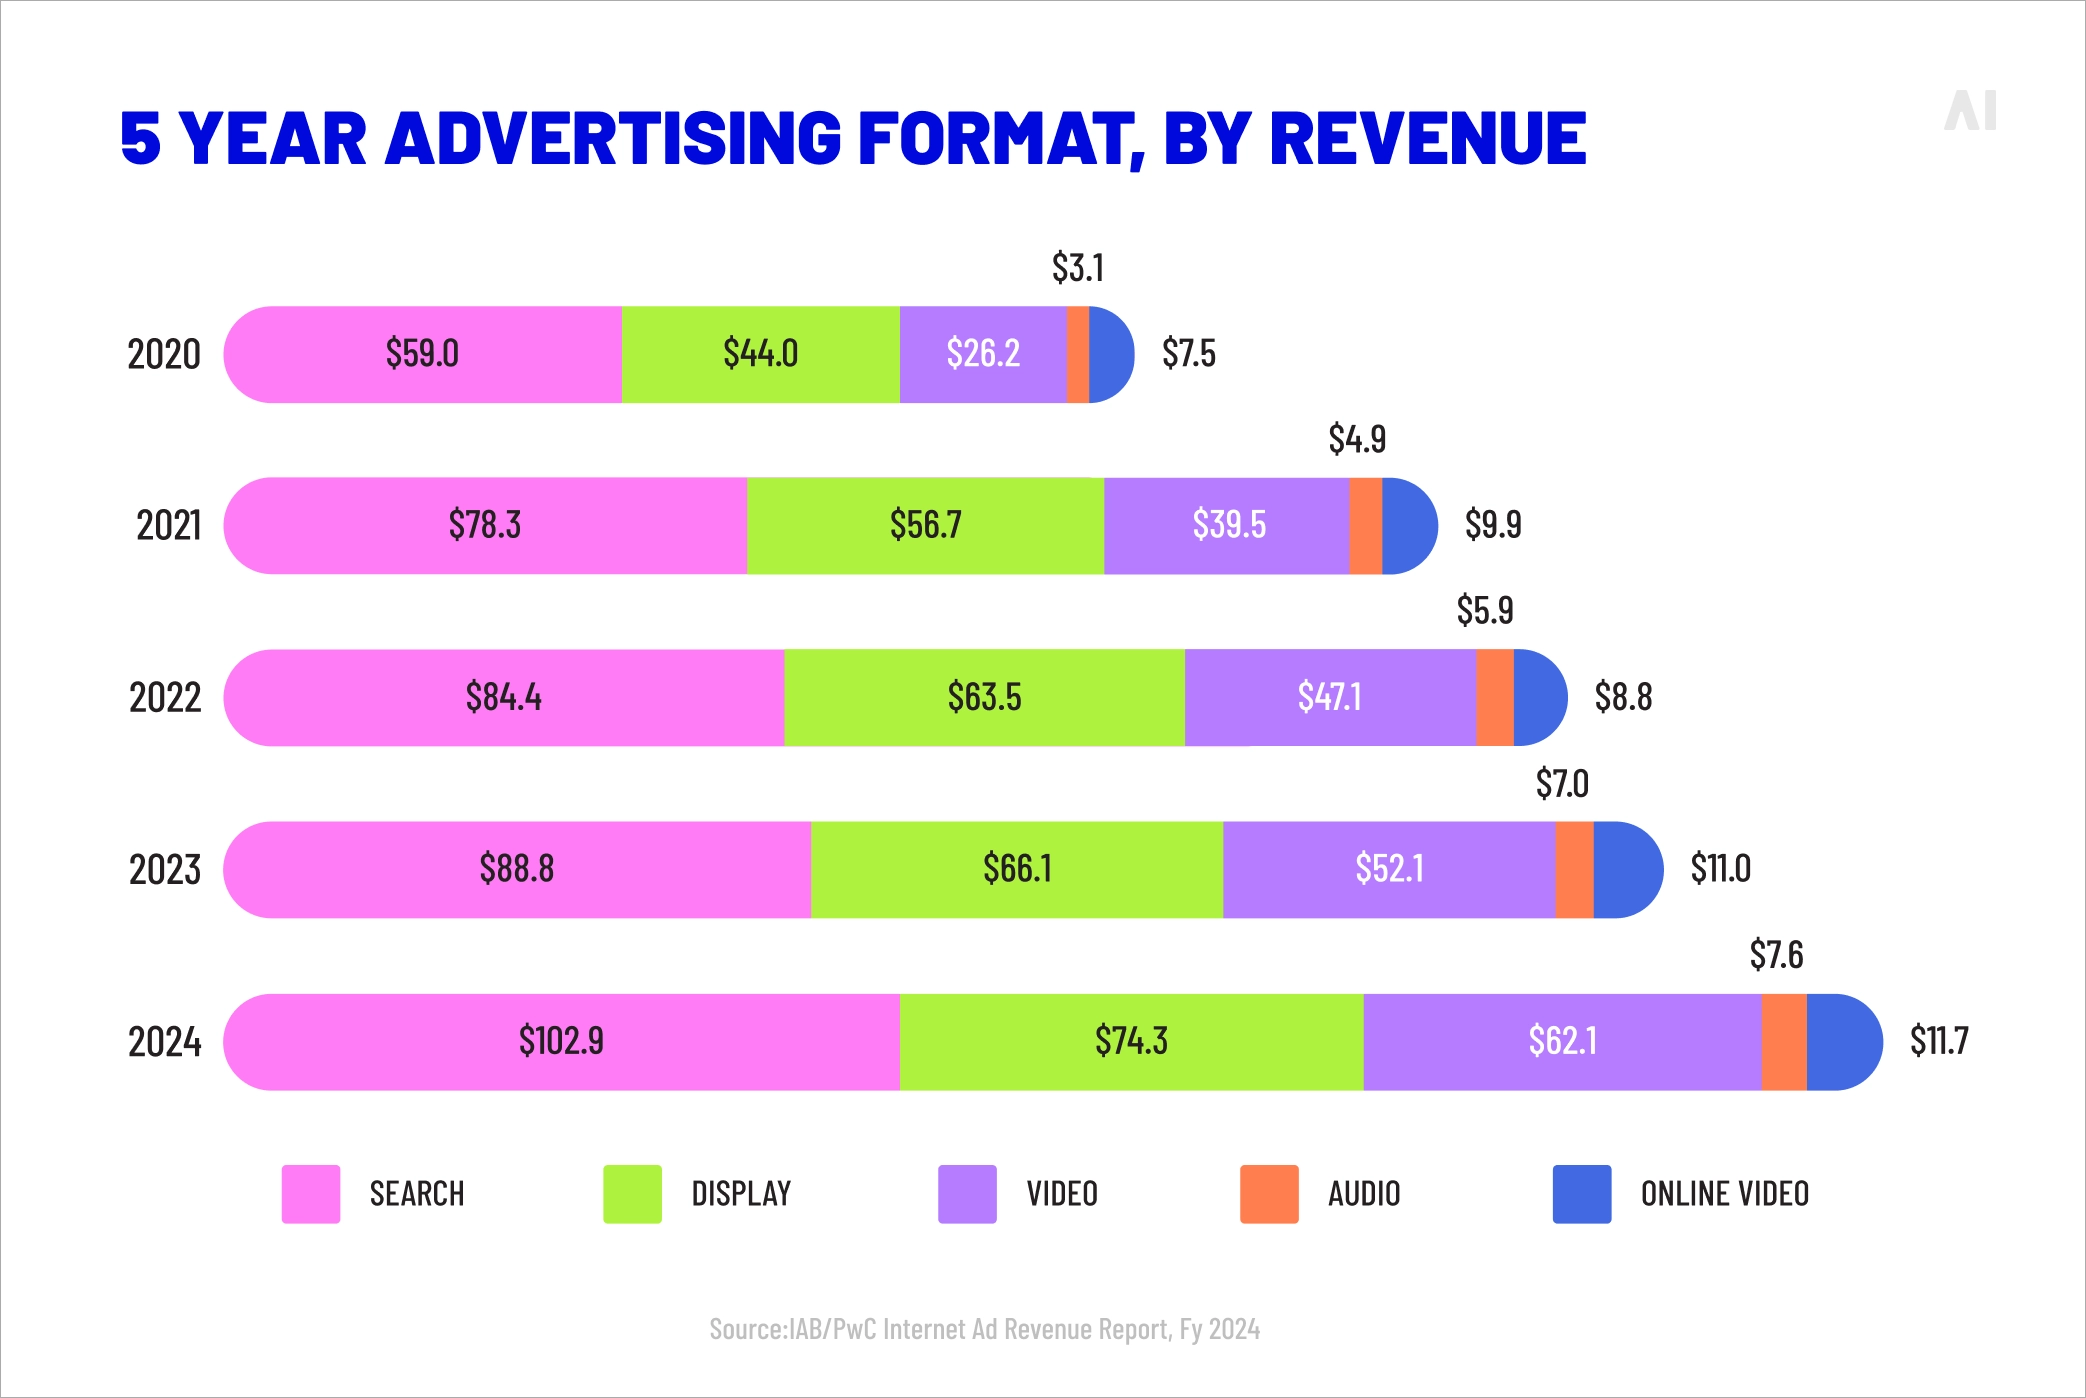
Five year (2020-2024) advertising format, by share (Source).
Most plans use all three: search to harvest demand, display to create and sustain it, and native to deepen engagement within content. The table below summarizes how they differ across goals, placements, targeting, creative, and the kind of attention each one typically earns.
Five year (2020-2024) advertising format, by revenue (Source)
Main types of digital display ads
Below are the principal formats you’ll use, plus what recent research says about their effectiveness.
Banner ads
Standard IAB units (e.g., 300×250, 728×90) are the workhorse of display. Their effectiveness depends heavily on viewability, creative clarity, and supply quality. U.S. Google Display Network (GDN) reach remains a major advantage—Google cites coverage of over 90% of internet users globally, giving banners unparalleled scale when bought through GDN or via DSP access to Google inventory.
Benchmark click-through rates (CTR) vary widely.
WordStream’s U.S. Google Display benchmarks (updated May 2025) report a 0.46% average CTR across industries—useful as a directional baseline, not a target.
Your real goal is qualified attention and outcomes (e.g., brand lift, post-view conversions), not raw CTR.
Rich media ads
Rich media units invite interaction (animation, hover, expand, product carousels, scratch-offs). They often increase engagement and time-in-view relative to static banners because interaction introduces dwell time and can trigger polite expansion into more immersive canvases. Specific performance differentials vary by creative and placement; attention-based vendors (e.g., Lumen, Adelaide) consistently find that richer formats and higher-quality placements correlate with stronger brand and performance outcomes.
Video ads
Video is now a dominant slice of display spending. Insider Intelligence/eMarketer’s U.S. digital video ad spending series shows video continues to grow as a share of display outlays, reflecting marketers’ preference for sight-sound-motion across mobile and desktop. (Exact shares depend on definition and publisher mix.)
⚡ Motion buys seconds; seconds buy memory—use video and rich media when the story needs time to land.
Use out-stream placements (video units that play within article or feed environments) to layer brand storytelling into the open web.
Interstitials are full-screen units shown at natural transition points in mobile apps (e.g., between game levels). They deliver high visibility and can outperform small banners on interaction, but they must be timed and frequency-capped to avoid user frustration. Platform documentation (Unity LevelPlay/ironSource) positions interstitials as “the industry’s most popular in-app format” and recommends showing them at natural breaks. Treat them as a premium, sparingly used canvas for campaigns that need impact at specific app moments.
Native display ads
Native display units match the surrounding feed’s look and feel while remaining clearly labeled as advertising (per FTC guidance). Eye-tracking research (Sharethrough/IPG Media Lab) has long shown higher visual attention for native vs. classic banners, and multiple studies and publisher audits continue to findstronger engagement and brand outcome correlations when attention-friendly native placements are used.
⚡ Use native to educate, promote content, and soften the step between discovery and action.
Retargeting re-engages users who visited your site/app or interacted with your brand. It’s a proven performance lever that increases the probability of conversion and cross-channel activity (e.g., branded searches). While specific lifts vary, robust, recent analyses show strong incremental gains when retargeting is executed with frequency and creative controls and evaluated incrementally (via PSA holdouts or conversion-lift).
For example, DoubleVerify notes growing emphasis on post-view impact and quality signals, while industry experiments show retargeting can lift lower-funnel outcomes when measured beyond last click.
⚡Retargeting works when it’s respectful. Cap frequency, vary creative, and prove incrementality.
Why visibility & attention matter in display advertising
Visibility is the starting point; attention is what moves the needle. An impression only creates value if a real person actually has the opportunity to see it and, for a few seconds, notices it. That’s why modern display planning sets a quality floor for viewability and then optimizes for attention—the signal most closely linked to brand lift and downstream actions. Before we discuss how to improve either, it helps to define what they measure and how they differ.
Viewability vs attention metrics explained
Viewability tells you the ad had a chance to be seen. The IAB/MRC standard defines a viewable display impression as 50% of pixels in view for at least 1 continuous second (and 2 seconds for video). Think of viewability as the floor.
Attention goes further. It combines measures such as eyes-on dwell time, audibility, screen coverage, scroll speed, ad clutter, and creative properties to estimate the likelihood that a human actually paid attention—and links that to outcomes. Large-scale reports and audits in 2024–2025 show:
47% of media buyers planned to use attention metrics on most buys in 2024 (DoubleVerify Global Insights), reflecting a shift from “was it viewable?” to “did it attract attention likely to drive results?”
Attention vendors (Adelaide, Teads, and Lumen) have published peer-reviewed methods and dozens of case studies connecting higher attention scores to upper- and lower-funnel lifts (awareness, consideration, sales proxies), and the AU metric has been independently audited for methodological rigor.
In 2025, Nielsen and Adelaide integrated AU into Nielsen ONE, signaling that cross-platform reach and attention are converging in mainstream planning stacks.
Bottom line: viewability is necessary but insufficient. Use it to eliminate waste; use attention to prioritize quality and predict outcomes.
⚡ Buy fewer impressions and earn more attention—viewability is the floor, attention is the engine.
The role of AI and automation in improving visibility
AI now operates at three layers to improve real-world visibility and reduce waste:
Pre-bid quality filters (brand suitability, fraud, MFA avoidance, and attention pre-bid segments) remove low-quality inventory before you bid. Adelaide’s pre-bid segments in The Trade Desk and Yahoo DSP, for instance, let you buy by attention score and have shown meaningful ROAS, CTR, and brand-lift gains in case studies. IAS also introducedpre-bid attention optimization to maximize high-attention delivery at scale.
Supply path optimization (SPO/QPO) uses algorithms to favor transparent, efficient routes to inventory and to avoid duplicative hops that tax your CPM without adding quality. The ANA’s 2024 Programmatic Benchmark study found that $439 out of every $1,000 now reaches the consumer, a 7.9% efficiency improvement vs. prior years—evidence that quality-focused buying is moving more dollars into working media.
Adaptive bidding & creative rotation leverage predictive signals (historical attention, time-in-view by placement, page geometry) to pay appropriately for high-quality impressions and shift spend toward the inventory that actually earns human attention.
💡 For a deeper strategy discussion on AI’s role across planning and optimization, see AI Digital’s overview of AI in digital marketing.
Reducing wasted impressions
Wasted impressions come from non-viewable loads, invalid traffic (IVT)/fraud, MFA pages, TV-off or autoplay scenarios in video, and over-frequency. Benchmarks highlight the scale of progress and remaining risk:
U.S. viewability continues to improve: IAS’s 20th Media Quality Report (May 2025) showsmobile app display viewability rising to 86.8% in the U.S. (2024) and mobile web video at 79.4%. Time-in-view on desktop display sits around 16.6 seconds in the U.S. (lower than global). Use these as directional guardrails when auditing partners.
Fraud/IVT remains real but manageable with robust controls. The Trustworthy Accountability Group (TAG) reported$10.8B in U.S. fraud savings in 2023 due to certification and standards adoption; meanwhile, DoubleVerify’s 2024/2025 reporting spotlights persistent bot schemes (especially in CTV) and underscores the value of platform-level protections (e.g., Roku’s Advertising Watermark).
⚡ High viewability on MFA does not equal impact—track attentive time and lift to find real value.
Benefits of digital display advertising
Display earns its place in the plan by doing several jobs at once. It delivers broad, flexible reach across the open web, but it also ties that reach to verifiable outcomes—brand lift, qualified traffic, and sales. With precise targeting, privacy-safe data, and optimization that rewards viewable, high-attention impressions, the channel can balance awareness and performance without blowing up budgets. The sections that follow outline the core benefits and point to recent research that confirms them.
High reach with measurable outcomes
Display is the fastest route to national-scale reach across the open web. As mentioned, Google cites the GDN’s reach at 90%+ of global internet users; when combined with major SSPs and curated marketplaces, you can reach virtually all addressable U.S. audiences—then measure via brand lift, conversion lift, post-view outcomes, and modeled sales.
Brand awareness + performance in one channel
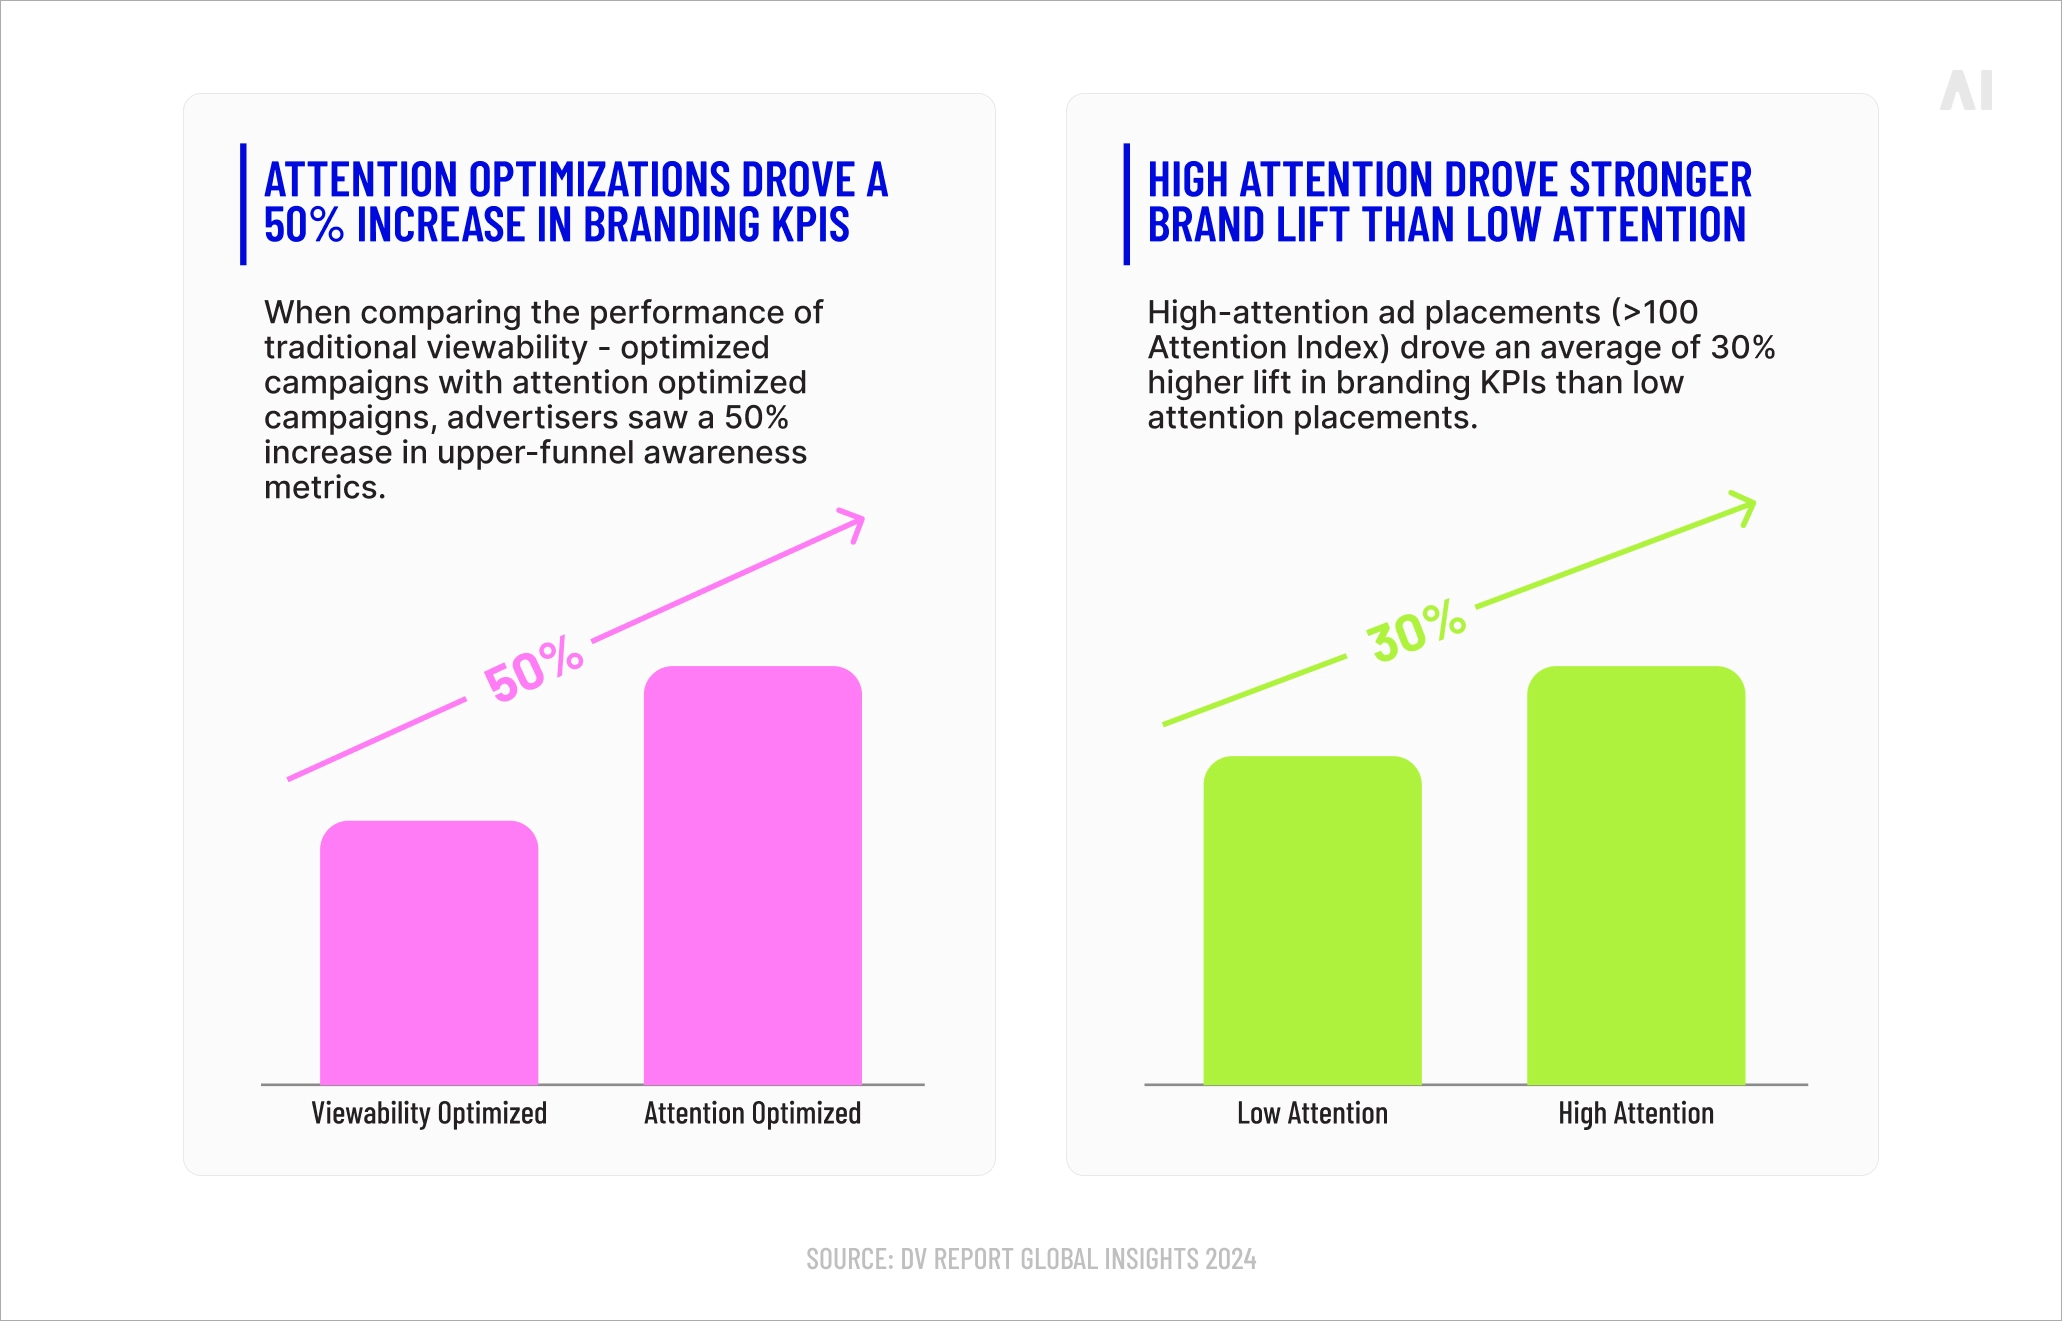
The days of “display only builds awareness” are long gone. Attention research at scale shows that placements with higher attention scores produce stronger lifts across the entire funnel, including lower-funnel outcomes when dwell time is sufficient. As mentioned previously, 2023–2025 reports from Lumen, Teads, Havas/Brand Metrics, and Adelaide document these relationships, with case studies citing 40%+ lifts in upper-funnel KPIs and 50%+ gains in lower-funnel KPIs when optimizing for attention quality.
💡 For a practical take on turning attention into conversions, see AI Digital’s note on conversion marketing.
Precision targeting and personalization
Even as third-party cookie deprecation shifts (more below), privacy-safe precision is flourishing via first-party data, contextual signals, curated PMPs, and clean rooms. In 2024, 66% of U.S. data and ad professionals reported adopting data clean rooms in response to privacy legislation and signal loss—demonstrating how audience collaboration and measurement are evolving without third-party cookies.
Cost efficiency and scalability
Programmatic automates price discovery at scale. Combined with SPO/QPO and pre-bid quality, you redirect budget from bloat (duplicate hops, MFA, IVT) to working, viewable, attentive impressions. As mentioned, the ANA’s 2024 findings—$439 per $1,000 reaching consumers, up 7.9%—demonstrate tangible waste reduction as the industry leans into quality and transparency.
Display ad metrics and measurement
Display advertising is only as strong as your ability to measure it. You’re not just buying impressions anymore; you’re buying proof that those impressions were seen, noticed, and capable of driving impact. That means tracking quality (Was it viewable? Was it human? Was it in a suitable environment?), attention (Did anyone actually look at it long enough to matter?), and outcome (Did it move awareness, intent, or revenue?). The next sections outline how to think about that stack.
Key metrics to track
To judge whether display is working, you need a layered view of performance. At the base are exposure metrics like reach and viewability. Above that are quality and attention signals. On top are the actual business outcomes.
{{advertising-seo-3="/tables"}}
⚡ Guiding principle: Use viewability to enforce a floor; use attention and outcomes to optimize what you buy.
Relying on last-click attribution undervalues display—especially upper- and mid-funnel exposures that prime search and direct response. Modern stacks combine multi-touch attribution, geo-matched lift, and tagged brand-lift studies to capture the incremental effect of exposures that are seen but not clicked. This shift is reflected in the measurement roadmaps from Nielsen and attention vendors and in the broader media-quality literature from DoubleVerify and IAS.
⚡ Clicks are a hint; incrementality is the verdict—prove it with brand and conversion lift.
Using AI for predictive optimization
Predictive models forecast which placements, supply paths, and creatives will deliver the most attentive seconds and incremental outcomes at the next auction. This is where attention pre-bid segments and QPO-guided supply curation shine—bidding more for likely high-attention inventory and less for low-quality opportunities. Case studies showmeaningful ROAS and lift gains when attention data informs pre-bid decisions. For instance, in the
Pricing models: CPM, vCPM, CPC & CPA
Pricing sets the rules for what you value and when you pay:
CPM (cost per thousand impressions). You pay for exposures served, regardless of whether they’re viewable or clicked. It’s the long-standing standard for display and video, useful when your priority is scaled reach and visibility at a predictable unit cost.
vCPM (viewable CPM). You pay only when an impression is measured viewable under your provider’s standard (commonly aligned to MRC: ≥50% pixels in view for 1s display/2s video). vCPM shifts spend toward impressions that at least had a chance to be seen and is supported natively by platforms like Microsoft Monetize/ Xandr.
CPC (cost per click). You pay only when someone clicks. Good for traffic and direct response when click quality is strong; you’ll still want to monitor post-click behavior to avoid paying for accidental or low-intent clicks. CPA (cost per action) goes a step further—you pay only when a defined conversion happens (lead, sale, install). Both models are part of the broader “CPx” pricing family in IAB definitions.
Attention-based CPM (emerging). Instead of paying for every served or viewable impression, you transact against attention—for example, attentive seconds per 1,000 impressions (APM) or a verified attention quality score (e.g., Adelaide’s AU). Some marketplaces now support AU-CPM buys or report aCPM (attentive cost per thousand) to normalize cost against the attention you actually earned. This reframes price around quality of exposure, not just quantity.
{{advertising-seo-4="/tables"}}
Pick the model that matches your objective and risk tolerance: many teams prospect on vCPM or attention CPM, then shift remarketing to CPC/CPA while brand flights run on CPM with clear viewability and attention floors.
⚡ Pricing is a strategy choice—pick the model that pays for the quality you want to buy.
Display advertising platforms and technology
Display advertising runs on a connected stack. Publishers expose inventory through ad servers and SSPs, exchanges run the auctions, and DSPs let advertisers bid, target, and optimize in real time. Around that core are data platforms (first-party, clean rooms, and curated segments), verification for viewability, suitability, and fraud, and standards like ads.txt, sellers.json, and schain that keep supply paths transparent. Modern buying also relies on header bidding, SPO/QPO to prioritize efficient routes, and emerging attention pre-bid signals so you can value quality, not just volume—all in a few hundred milliseconds.
Now, let’s take a slightly closer look at each of those platforms/standards below.
Demand-side platforms (DSPs): DSPs connect advertisers to multiple exchanges and SSPs, enabling centralized targeting, bidding, and optimization. IAB definitions frame a DSP as the system that allows auction-based buying and audience/data activation across inventory sources from a single pane of glass.
Supply-side platforms (SSPs): SSPs help publishers maximize yield across exchanges and demand sources, including header bidding and private marketplaces. They expose valuable first-party signals (page context, quality) and implement standards to authenticate sellers.
Ad exchanges & marketplaces: These are the auction venues where bids clear in real time.
Ad verification and measurement tools: Independent partners (IAS, DoubleVerify, Moat, Pixalate, etc.) verify viewability, brand suitability, geo, fraud/IVT, and now attention. Recent U.S. benchmarks from IAS and DV provide country-level norms for viewability, time-in-view, and fraud to calibrate your QA.
Standards that keep the pipes clean: IAB Tech Lab’s ads.txt / app-ads.txt, sellers.json, and the SupplyChain (schain) object let buyers authenticate authorized sellers and trace each hop in the supply chain—essential for SPO/QPO and MFA avoidance. Keep these turned on in your DSP filters.
How AI Digital elevates display performance
Teams rarely struggle to find impressions; they struggle to find the ones that matter. Budgets seep into non-viewable loads, made-for-advertising domains, and needlessly long supply paths that add fees without adding value. Platform incentives complicate things—some stacks nudge buyers toward their own inventory, which can distort what wins the auction. And when creative tires or frequency creeps, post-click quality slides even as surface-level metrics look fine. We built our approach to tackle those frictions—quality, bias, waste, and slow feedback—head on.
AI Digital is built for the open internet. Our Open Garden model keeps you in control of the DSPs and publishers you prefer, while we focus on two levers that consistently move outcomes:
Smart Supply cleans and optimizes the path before you bid, privileging quality and efficiency.
Elevate learns what truly shifts your KPIs and reallocates spend accordingly, with explainable guidance as it goes.
Let’s talk about both in detail below.
Smart Supply: make quality the default
Picture a live auction. A reader opens an article; an ad slot becomes available. In many setups the buy side casts a wide net and lets post-bid verification catch issues later. Smart Supply flips the order: we select first, then compete.
Outcome-first selection. Where others start with a generic contextual seed or a static data recipe, Smart Supply starts with your KPI and builds the deal around it. Each deal ID is custom, continuously optimized, and aligned to the inventory type and outcome you care about—no one-size-fits-all library that never evolves.
Neutralizing platform bias. We level the playing field when platforms subtly favor their own inventory, so priority is awarded on performance, not politics. That keeps decisions KPI-led rather than stack-led.
A selection funnel that removes waste. First, we select inventory with your preferred SSP mix (or recommend one) and keep you in control. Then we filter out low-performing publishers using historical data and AI models, strip indirect hops that inflate CPMs, and apply IVT protection. Only premium, direct paths remain; the goal is fewer leaks and cleaner auctions.
Fixing bid-stream recycling. It’s common for a $25 CPM bid to bounce across intermediaries and arrive at $34+ by the time it clears—pure margin stacking. Smart Supply shortens the path to the same impression, preserving working media for what actually shows on screen.
Targeting add-ons (optional). When your brief calls for it, we layer proprietary contextual crawling for brand-safe, relevant pages and people-based audience options via third-party data—both tuned to your campaign goals.
Activation designed for momentum. No direct billing to you (agreements sit with SSPs via revenue share), no minimums, DSP-agnostic execution, and rapid activation—deal IDs within ~24 hours—so tests move from idea to live quickly.
Two ways to work. Choose Deal Libraries—generalized, AI-optimized pools for scale objectives like completed views—or Campaign-Specific Deals—tightly tailored pools built for aggressive KPIs and optimized with your feedback loop.
Programmatic buying software runs across display, streaming video, CTV, and even streaming audio (small but growing), so the same hygiene and efficiency principles carry into adjacent channels when you’re ready to expand.
Net effect: bids fire only when the odds of a human, on-screen, attention-worthy exposure are high, and the path to that exposure is efficient. That’s how you lift viewability, lower IVT, and increase the share of budget that becomes working media.
Elevate: turn signal into action
An hour later, a stream of signals returns—viewability, attention/time-in-view, post-click behavior, and (where it’s running) brand or conversion lift. Elevate ingests that feed and decides what to do next—not tomorrow, but this hour.
Plan in seconds, based on history. The AI planning assistant creates a first-cut plan from a short brief—trained on 100+ campaign datasets—then checks real-time inventory across multiple DSPs. The average plan generation time is about 30 seconds, which means you can iterate quickly and push to testing while the insight is fresh.
Predict before you spend. A predictive planning engine processes 20+ performance metrics, integrates cross-platform data, and updates forecasts in real time as new signals arrive. It’s built to suggest budget mixes that are efficient before launch.
Optimize to the KPIs that matter. Our custom KPI optimization aligns to business metrics—not just CTR or a generic CPA—and supports 20+ KPI combinations. Budgets reallocate automatically, and the system can run multi-variable tests to find combinations of audience, placement, format, and creative that win on your terms.
Prioritize with Impact Score. Elevate scores the next best changes across 15+ campaign variables, refreshing the ranking every 15 minutes and incorporating third-party verification data. You’re not guessing which lever to pull; you’re acting on the one with the largest predicted effect.
Ask, don’t dig.“Ask Elevate” turns complex performance reads into plain-language answers in under two seconds, then proposes the next move. Real-time analytics, anomaly detection, and cross-channel views keep strategy and execution connected.
How it all comes together. Elevate aggregates data across platforms, adjusts parameters roughly every 15 minutes, and explains why spend is shifting. In documented programs, reallocations like this have produced double-digit improvements in cost efficiency, precisely because the model learns where attention and outcomes meet.
Net effect: fewer autopilot bets and more budget flowing to the context + audience + creative + path combinations that produce attentive, incremental outcomes—backed by explainable reasoning you can take to stakeholders.
Display’s biggest hurdles aren’t mysterious—they’re persistent. Creative wears out, cookies fade, junk inventory slips into the mix, and measurement can blur what really moved the needle. The fix isn’t one tactic but a system: refresh creative with purpose, control frequency, harden supply quality and fraud checks, and measure incrementality rather than clicks alone. The sections that follow break down each challenge and the practical steps to keep performance on track.
Ad fatigue and creative blindness
People tune out what they’ve seen too often or what blends into the page. Repeating a single headline/visual across weeks trains the audience to skim past it, and small canvases make this worse when the same elements appear in the same placements at similar scroll depths. You see the symptoms in data: falling attentive time, lower expansion and completion rates, rising frequency without proportional lift, and weaker post-click quality. Large-scale attention research backs up what teams observe in dashboards—creative quality and placement quality work together to drive outcomes, and you need enough attentive exposure (not just viewability) to shift memory and intent.
How to fix it: Fatigue creeps in when people see the same idea too often in the same places. Break the pattern, refresh the message, and buy placements that earn real attention—not just viewability.
{{advertising-seo-5="/tables"}}
Privacy and cookieless targeting
Chrome’s third-party-cookie story took a turn in 2025. Google opted not to ship a standalone cookie-prompt plan and retained the user-choice model in Chrome, while continuing to develop Privacy Sandbox APIs. The UK Competition and Markets Authority (CMA) then consulted on and moved toward releasing Google from the Privacy Sandbox commitments it had previously imposed, reflecting the change in approach. For U.S. advertisers, the net effect is ambiguity rather than a clean cutover: cookies remain present for now, but their reliability is uneven across browsers and users, and measurement/identity still face ongoing fragmentation.
At the same time, teams have been building privacy-first rails: data clean rooms moved into the mainstream—roughly two-thirds (66%) of U.S. data and ad professionals reported adoption in 2024—alongside greater reliance on first-party data and contextual signals. Standards and guidance are maturing as well (IAB Tech Lab issued Data Clean Room guidance and an interoperability standard in 2024/2025), which helps with practical implementation.
How to fix it: Cookies are inconsistent and the rules keep shifting. Treat them as transitional, build on consented first-party data, and use privacy-safe collaboration and measurement.
Fraud follows budgets. As spend has flowed into open-web video and CTV, bot operators have followed. Open-programmatic CTV invalid traffic (IVT) rate was 18% in the United States in Q1 2025. CTV is attractive to fraudsters because device IDs can be spoofed, traffic can be laundered through apps and SSAI, and “it looks premium,” so weak controls still find buyers. Even outside CTV, viewability and completion can appear healthy on low-quality or MFA inventory while real business impact remains thin—a reminder that surface metrics can be gamed.
There is good news: joint platform–verification efforts work. Roku’s Advertising Watermark and DV’s investigations have cut falsified Roku-device impressions, demonstrating that device-level authentication reduces spoofing at scale.
How to fix it: Fraud follows budgets, especially into video and CTV. Reduce exposure by authenticating supply, filtering aggressively before the bid, and measuring outcomes that are hard to fake.
{{advertising-seo-7="/tables"}}
Best practices for running digital display ads campaigns
Great display work is part craft, part system. You’ll get farther when strong creative meets clean supply, frequency discipline, and a feedback loop that never sleeps. The sections below outline how to set that up and keep it running.
Design creatives for clarity, relevance & attention
People decide in seconds. Make that moment easy: one idea per ad, a clear visual hierarchy, and a call to action that’s hard to miss. Then tune the message to the context so it feels timely, not generic.
Lead with a single, concrete message; use brand elements early.
Build for fast comprehension (2–3 seconds).
Size-specific design matters—optimize for 300×250, 300×600, 320×50/100, 728×90, 970×250, 336×280, and out-stream video canvases.
For native: match tone and topic, but disclose clearly (FTC).
Test and iterate continuously
Testing isn’t a one-off. Treat each flight as an experiment: define the hypothesis, ship the variants, read the results, and roll the winner forward. Small, steady gains compound.
A/B test creative concepts, not just color swaps.
Use geo-split or PSA holdouts for incrementality.
Rotate new concepts to prevent fatigue every 2–4 weeks at typical U.S. frequencies.
Balance reach with relevance
Reach fills the top of the funnel; relevance turns impressions into memory. Calibrate who you target and how often they see you so coverage grows without wasting budget on the same people.
Set frequency caps by funnel stage (e.g., 2–3/week for prospecting; 3–6/week for remarketing with burnout rules).
Use contextual + first-party audiences together.
Avoid MFA domains via supply curation and attention pre-bid segments.
Automate optimization
There are too many decisions for manual tuning alone. Let automation handle bidding, pacing, and routing while you set the rules and goals. Your job is to choose the signals that matter and keep the guardrails tight.
Turn on QPO/SPO and pre-bid attention where available.
Use pacing guardrails and bid shading to avoid overpaying for low-quality impressions.
Align optimization to custom KPIs (not just CTR/CPA)—lifetime value, lead quality, or qualified traffic.
The future of digital display advertising
Display is moving from buying “impressions” to buying quality exposures that earn attention and outcomes. Three forces are driving that shift: creative that assembles itself to the moment, metrics that value attention rather than mere presence, and privacy-first data collaboration that lets you plan, target, and prove lift without leaning on brittle identifiers. Add the continued rise of CTV and you get an omnichannel system where formats cooperate, frequency is unified, and optimization learns across screens.
AI-driven creative automation & DCO 2.0
Creative is becoming modular and responsive. Instead of uploading a handful of static banners, you’ll maintain a design system—headlines, subheads, product frames, price blocks, backgrounds, and CTAs—each tagged with metadata (audience, context, objective, compliance limits). A creative decisioning model then assembles the right combination for each impression, using signals such as page context, device, geo, recency of site visits, and predicted attention or propensity to convert.
What changes versus classic DCO is the objective function. It’s not just “likelihood of click” anymore; models optimize for dwell time, attentive seconds, and downstream lift.
Expect multi-armed bandit or reinforcement-learning approaches that explore new variants while exploiting known winners, all under brand guardrails—approved copy pools, legal constraints, and safety rules the model can’t cross.
On the production side, generative tools will fill variant gaps (e.g., product crops, background swaps, copy rewrites) but ship only after automated checks for brand tone, contrast/legibility, and policy compliance.
Advanced attention and quality metrics
Viewability remains your floor, but attention becomes the planning input and the buying lever. Major measurement stacks already surface attention metrics (e.g., attentive seconds, eyes-on probability, AU-style quality scores), and exchanges and publishers are beginning to support attention-based guarantees—the attention analogue to vCPM. In practice, that means you can set a pre-bid threshold (only bid when predicted attention exceeds X) and then optimize pacing and creative toward attentive time per dollar, not just impressions per dollar.
Crucially, attention doesn’t live in a vacuum. The most useful setups calibrate attention to business outcomes—brand or conversion lift—so your threshold targets are tied to a proven performance curve rather than an arbitrary benchmark. Expect planning tools that recommend attention budgets the way they currently recommend reach and frequency, and reporting that translates price back into attentive cost per thousand (aCPM) for clean comparisons across formats.
CTV + Display + Omnichannel integration
CTV continues to scale, and its media-quality practices are bleeding into display: device authentication, TV-off detection, and attention guarantees are becoming standard asks. The bigger shift, though, is operational—brands want one plan that manages reach, frequency, and lift across CTV, open-web video, and display. Identity will stay patchy, so you’ll rely on a mix of publisher graphs, household-level signals, contextual cues, and clean-room joins to unify measurement and suppress over-frequency.
Creative sequencing will follow suit. A 15-second CTV story can introduce the promise, with display/native reinforcing the proof points in environments where people browse and read. As verification tools clamp down on spoofed devices and MFA inventory, you’ll see more curated CTV and high-attention open-web supply packaged together, priced on quality (vCPM or attention CPM) rather than raw tonnage.
Chrome’s course adjustment in 2025 reduced the drama but not the direction: third-party cookies are unreliable, and privacy-first collaboration is now the norm. Clean rooms moved from experiment to standard practice, enabling retailers, publishers, and brands to join audiences, cap frequency, and read lift without swapping raw data. In parallel, publisher first-party signals and high-fidelity contextual have stepped up as durable prospecting tools.
The future is a layered approach: consented first-party data where you have it; publisher cohorts and contextual where you don’t; and clean-room analytics to prove incrementality. Identity solutions will remain part of the mix, but governance—consent capture, purpose limitation, deletion pathways—will decide which partners you can actually use at scale.
Conclusion on display digital advertising: Where marketers should focus next
Display performance isn’t about piling up impressions; it’s about buying quality exposure and turning it into measurable lift. The path is straightforward: set a hard floor for visibility, optimize for attention (not just presence), use AI to steer creative and budget in real time, and prove impact with disciplined testing. Do those four things well and the channel pulls its weight—brand and performance—in the same plan.
Here’s what to do next:
Clean up supply and set quality floors: Enforce viewability and invalid-traffic thresholds, block MFA domains, and require ads.txt/app-ads.txt, sellers.json, and schain. Shorten supply paths so more budget becomes working media, and add pre-bid attention or time-in-view filters where available.
Make attention and outcomes buy-side inputs: Put attentive seconds and time-in-view on the same dashboard as reach and CPA. Pilot attention-screened buying, track attentive cost per thousand (aCPM), and set target thresholds by funnel stage. Validate with always-on brand or conversion lift—not clicks alone.
Turn creative into a system, not a set of files: Build a component library (headlines, visuals, offers) with clear guardrails. Rotate concepts on a schedule, sequence messages by stage, and instrument assets so you can see which elements earn attention and which fatigue early.
Automate optimization—and make it explainable: Let models reallocate budgets intra-day across audiences, placements, formats, and routes that are winning now. Keep frequency shaped by cohort, run incrementality tests on a cadence, and make sure every shift in spend has a clear “why” you can share with stakeholders.
If you’d like help putting this into practice, reach out to AI Digital—we’re happy to review your current setup and outline a plan that raises quality, concentrates attention, and proves outcomes.
Blind spot
Key issues
Business impact
AI Digital solution
Lack of transparency in AI models
• Platforms own AI models and train on proprietary data • Brands have little visibility into decision-making • "Walled gardens" restrict data access
• Inefficient ad spend • Limited strategic control • Eroded consumer trust • Potential budget mismanagement
Open Garden framework providing: • Complete transparency • DSP-agnostic execution • Cross-platform data & insights
Optimizing ads vs. optimizing impact
• AI excels at short-term metrics but may struggle with brand building • Consumers can detect AI-generated content • Efficiency might come at cost of authenticity
• Short-term gains at expense of brand health • Potential loss of authentic connection • Reduced effectiveness in storytelling
Smart Supply offering: • Human oversight of AI recommendations • Custom KPI alignment beyond clicks • Brand-safe inventory verification
The illusion of personalization
• Segment optimization rebranded as personalization • First-party data infrastructure challenges • Personalization vs. surveillance concerns
• Potential mismatch between promise and reality • Privacy concerns affecting consumer trust • Cost barriers for smaller businesses
Elevate platform features: • Real-time AI + human intelligence • First-party data activation • Ethical personalization strategies
AI-Driven efficiency vs. decision-making
• AI shifting from tool to decision-maker • Black box optimization like Google Performance Max • Human oversight limitations
• Strategic control loss • Difficulty questioning AI outputs • Inability to measure granular impact • Potential brand damage from mistakes
Managed Service with: • Human strategists overseeing AI • Custom KPI optimization • Complete campaign transparency
Fig. 1. Summary of AI blind spots in advertising
Dimension
Walled garden advantage
Walled garden limitation
Strategic impact
Audience access
Massive, engaged user bases
Limited visibility beyond platform
Reach without understanding
Data control
Sophisticated targeting tools
Data remains siloed within platform
Fragmented customer view
Measurement
Detailed in-platform metrics
Inconsistent cross-platform standards
Difficult performance comparison
Intelligence
Platform-specific insights
Limited data portability
Restricted strategic learning
Optimization
Powerful automated tools
Black-box algorithms
Reduced marketer control
Fig. 2. Strategic trade-offs in walled garden advertising.
Core issue
Platform priority
Walled garden limitation
Real-world example
Attribution opacity
Claiming maximum credit for conversions
Limited visibility into true conversion paths
Meta and TikTok's conflicting attribution models after iOS privacy updates
Data restrictions
Maintaining proprietary data control
Inability to combine platform data with other sources
Amazon DSP's limitations on detailed performance data exports
Cross-channel blindspots
Keeping advertisers within ecosystem
Fragmented view of customer journey
YouTube/DV360 campaigns lacking integration with non-Google platforms
Black box algorithms
Optimizing for platform revenue
Reduced control over campaign execution
Self-serve platforms using opaque ML models with little advertiser input
Performance reporting
Presenting platform in best light
Discrepancies between platform-reported and independently measured results
Consistently higher performance metrics in platform reports vs. third-party measurement
Fig. 1. The Walled garden misalignment: Platform interests vs. advertiser needs.
Key dimension
Challenge
Strategic imperative
ROAS volatility
Softer returns across digital channels
Shift from soft KPIs to measurable revenue impact
Media planning
Static plans no longer effective
Develop agile, modular approaches adaptable to changing conditions
Brand/performance
Traditional division dissolving
Create full-funnel strategies balancing long-term equity with short-term conversion
Capability
Key features
Benefits
Performance data
Elevate forecasting tool
• Vertical-specific insights • Historical data from past economic turbulence • "Cascade planning" functionality • Real-time adaptation
• Provides agility to adjust campaign strategy based on performance • Shows which media channels work best to drive efficient and effective performance • Confident budget reallocation • Reduces reaction time to market shifts
• Dataset from 10,000+ campaigns • Cuts response time from weeks to minutes
• Reaches people most likely to buy • Avoids wasted impressions and budgets on poor-performing placements • Context-aligned messaging
• 25+ billion bid requests analyzed daily • 18% improvement in working media efficiency • 26% increase in engagement during recessions
Full-funnel accountability
• Links awareness campaigns to lower funnel outcomes • Tests if ads actually drive new business • Measures brand perception changes • "Ask Elevate" AI Chat Assistant
• Upper-funnel to outcome connection • Sentiment shift tracking • Personalized messaging • Helps balance immediate sales vs. long-term brand building
• Natural language data queries • True business impact measurement
Open Garden approach
• Cross-platform and channel planning • Not locked into specific platforms • Unified cross-platform reach • Shows exactly where money is spent
• Reduces complexity across channels • Performance-based ad placement • Rapid budget reallocation • Eliminates platform-specific commitments and provides platform-based optimization and agility
• Coverage across all inventory sources • Provides full visibility into spending • Avoids the inability to pivot across platform as you’re not in a singular platform
Fig. 1. How AI Digital helps during economic uncertainty.
Trend
What it means for marketers
Supply & demand lines are blurring
Platforms from Google (P-Max) to Microsoft are merging optimization and inventory in one opaque box. Expect more bundled “best available” media where the algorithm, not the trader, decides channel and publisher mix.
Walled gardens get taller
Microsoft’s O&O set now spans Bing, Xbox, Outlook, Edge and LinkedIn, which just launched revenue-sharing video programs to lure creators and ad dollars. (Business Insider)
Retail & commerce media shape strategy
Microsoft’s Curate lets retailers and data owners package first-party segments, an echo of Amazon’s and Walmart’s approaches. Agencies must master seller-defined audiences as well as buyer-side tactics.
AI oversight becomes critical
Closed AI bidding means fewer levers for traders. Independent verification, incrementality testing and commercial guardrails rise in importance.
Fig. 1. Platform trends and their implications.
Metric
Connected TV (CTV)
Linear TV
Video Completion Rate
94.5%
70%
Purchase Rate After Ad
23%
12%
Ad Attention Rate
57% (prefer CTV ads)
54.5%
Viewer Reach (U.S.)
85% of households
228 million viewers
Retail Media Trends 2025
Access Complete consumer behaviour analyses and competitor benchmarks.
Identify and categorize audience groups based on behaviors, preferences, and characteristics
Michaels Stores: Implemented a genAI platform that increased email personalization from 20% to 95%, leading to a 41% boost in SMS click through rates and a 25% increase in engagement.
Estée Lauder: Partnered with Google Cloud to leverage genAI technologies for real-time consumer feedback monitoring and analyzing consumer sentiment across various channels.
High
Medium
Automated ad campaigns
Automate ad creation, placement, and optimization across various platforms
Showmax: Partnered with AI firms toautomate ad creation and testing, reducing production time by 70% while streamlining their quality assurance process.
Headway: Employed AI tools for ad creation and optimization, boosting performance by 40% and reaching 3.3 billion impressions while incorporating AI-generated content in 20% of their paid campaigns.
High
High
Brand sentiment tracking
Monitor and analyze public opinion about a brand across multiple channels in real time
L’Oréal: Analyzed millions of online comments, images, and videos to identify potential product innovation opportunities, effectively tracking brand sentiment and consumer trends.
Kellogg Company: Used AI to scan trending recipes featuring cereal, leveraging this data to launch targeted social campaigns that capitalize on positive brand sentiment and culinary trends.
High
Low
Campaign strategy optimization
Analyze data to predict optimal campaign approaches, channels, and timing
DoorDash: Leveraged Google’s AI-powered Demand Gen tool, which boosted its conversion rate by 15 times and improved cost per action efficiency by 50% compared with previous campaigns.
Kitsch: Employed Meta’s Advantage+ shopping campaigns with AI-powered tools to optimize campaigns, identifying and delivering top-performing ads to high-value consumers.
High
High
Content strategy
Generate content ideas, predict performance, and optimize distribution strategies
JPMorgan Chase: Collaborated with Persado to develop LLMs for marketing copy, achieving up to 450% higher clickthrough rates compared with human-written ads in pilot tests.
Hotel Chocolat: Employed genAI for concept development and production of its Velvetiser TV ad, which earned the highest-ever System1 score for adomestic appliance commercial.
High
High
Personalization strategy development
Create tailored messaging and experiences for consumers at scale
Stitch Fix: Uses genAI to help stylists interpret customer feedback and provide product recommendations, effectively personalizing shopping experiences.
Instacart: Uses genAI to offer customers personalized recipes, mealplanning ideas, and shopping lists based on individual preferences and habits.
Medium
Medium
Share article
Url copied to clipboard
No items found.
Subscribe to our Newsletter
THANK YOU FOR YOUR SUBSCRIPTION
Oops! Something went wrong while submitting the form.
Questions? We have answers
Why use display advertising?
It delivers broad, flexible reach across the open web with precise targeting and measurable outcomes, combining visual storytelling for brand building with retargeting and performance in the same channel.
How effective is display advertising today?
Effectiveness has improved as buyers enforce viewability and suitability, avoid low-quality supply, and use attention metrics. When campaigns optimize for quality exposure and prove incrementality, display reliably lifts both awareness and conversions.
How is AI used in display advertising?
AI curates cleaner supply paths, applies pre-bid quality and attention filters, predicts which placements and creatives will perform, automates budget shifts and frequency control, and explains why changes are made so teams can act with confidence.
How do you measure display ad performance?
Start with exposure quality (viewability, IVT, suitability), add attention and time-in-view, and judge success by lift and conversions. Use brand and conversion lift studies, post-view incrementality tests, and model-based attribution to capture impact beyond clicks.
How much does display advertising cost?
Pricing varies by format and quality: CPM remains standard, vCPM pays only for viewable impressions, CPC/CPA tie cost to clicks or actions, and attention-based models price the quality of exposure. The right choice depends on your objective and risk tolerance.
Is display still worth it vs social & CTV?
Yes—display advertisement complements social and CTV by offering open-web scale, contextual control, and transparent pricing. Plan them together, unify frequency, and allocate budget based on attention and lift across channels.
What's the difference between online display advertising and mobile display advertising?
Online display advertising is the umbrella term for visual ads across the open web—desktop and mobile web, and sometimes video—bought and optimized through the same programmatic pipes. Mobile display focuses specifically on smartphones and tablets, including in-app inventory, smaller canvases, touch interactions (tap/swipe), and mobile-specific signals and constraints (e.g., device IDs, iOS ATT, lighter file weights). In practice, the strategy is similar, but mobile requires tighter creative specs, stricter load times, and different measurement nuances for viewability and attention in app environments.
Have other questions?
If you have more questions, contact us so we can help.


%20hits%2018_%20in%20Q1%202025.webp)

.svg)
.svg)


_%20Industry%20Benchmarks%20%26%20Optimization%20Tips%20(1).webp)