Attention metrics in advertising: what marketers should actually measure


For most of the past decade, media quality was assessed through delivery. An impression was counted, a viewability threshold was met, a click was or was not registered, and the campaign was judged on that basis. Attention metrics in advertising have gained ground because those measures describe the conditions of an ad rather than the response to it. A viewable impression on a fast-scrolling feed and a viewable impression on a page someone is reading are recorded identically, yet almost nobody buying media believes they are worth the same.
That gap has pulled attention into planning conversations, into programmatic decisioning, and into creative testing. It has also pulled in a crowd of vendors, each measuring something slightly different and calling the result attention. The industry now has its first common vocabulary for sorting through them, published in late 2025, along with independent research testing how far the various methods actually agree.
What follows sets out what attention data actually measures, which planning, creative, and programmatic decisions it can sharpen, and the limits that keep it from proving anything on its own.
TL;DR: key takeaways
Six points carry most of the weight in what follows.
- Attention is not a single metric. Different providers measure visual focus, cognitive processing, behavioral response, or modeled probability, and the ARF's 2026 research found these methods often produce different results for the same media.
- Viewability and audibility create an opportunity for attention without proving it occurred. They describe a condition of the ad, not a response from a person.
- Provider scores are not interchangeable. Methodologies, thresholds, training data, and benchmarks vary, so two attentive-second figures rarely mean the same thing.
- Attention data earns its place when it changes a decision. Its value shows up in inventory comparison, creative diagnosis, and supply selection rather than in a dashboard tile.
- Correlation with outcomes is a starting point, not proof. Causal claims need controlled testing.
- More attention is not automatically better. Industry guidance explicitly allows for diminishing, nonlinear, and even negative effects.
What are attention metrics in advertising?
Attention metrics are measurements or modeled estimates used to understand whether an ad was seen or heard by a person, for how long, and with what depth of processing. Some are observed directly through eye tracking or physiological monitoring. Others are inferred from exposure conditions, behavioral signals, contextual data, or historical patterns, then projected across campaigns at scale.
Viewability, in the language of the IAB and MRC Attention Measurement Guidelines, measures a condition of the ad: whether enough pixels were visible for long enough to represent an opportunity to see it, regardless of whether any person did. Attention measures whether the ad was seen or heard by a person and to what depth. Audibility works the same way for sound.
That distinction organizes a ladder of measurement that runs from delivery upward.
- Delivery confirms the ad was served.
- Viewability and audibility confirm the conditions under which it could have been perceived.
- Attention addresses whether perception occurred and how deeply.
- Outcomes record what changed in the business as a result.
Each rung answers a narrower question than the one above it, and no rung substitutes for another.
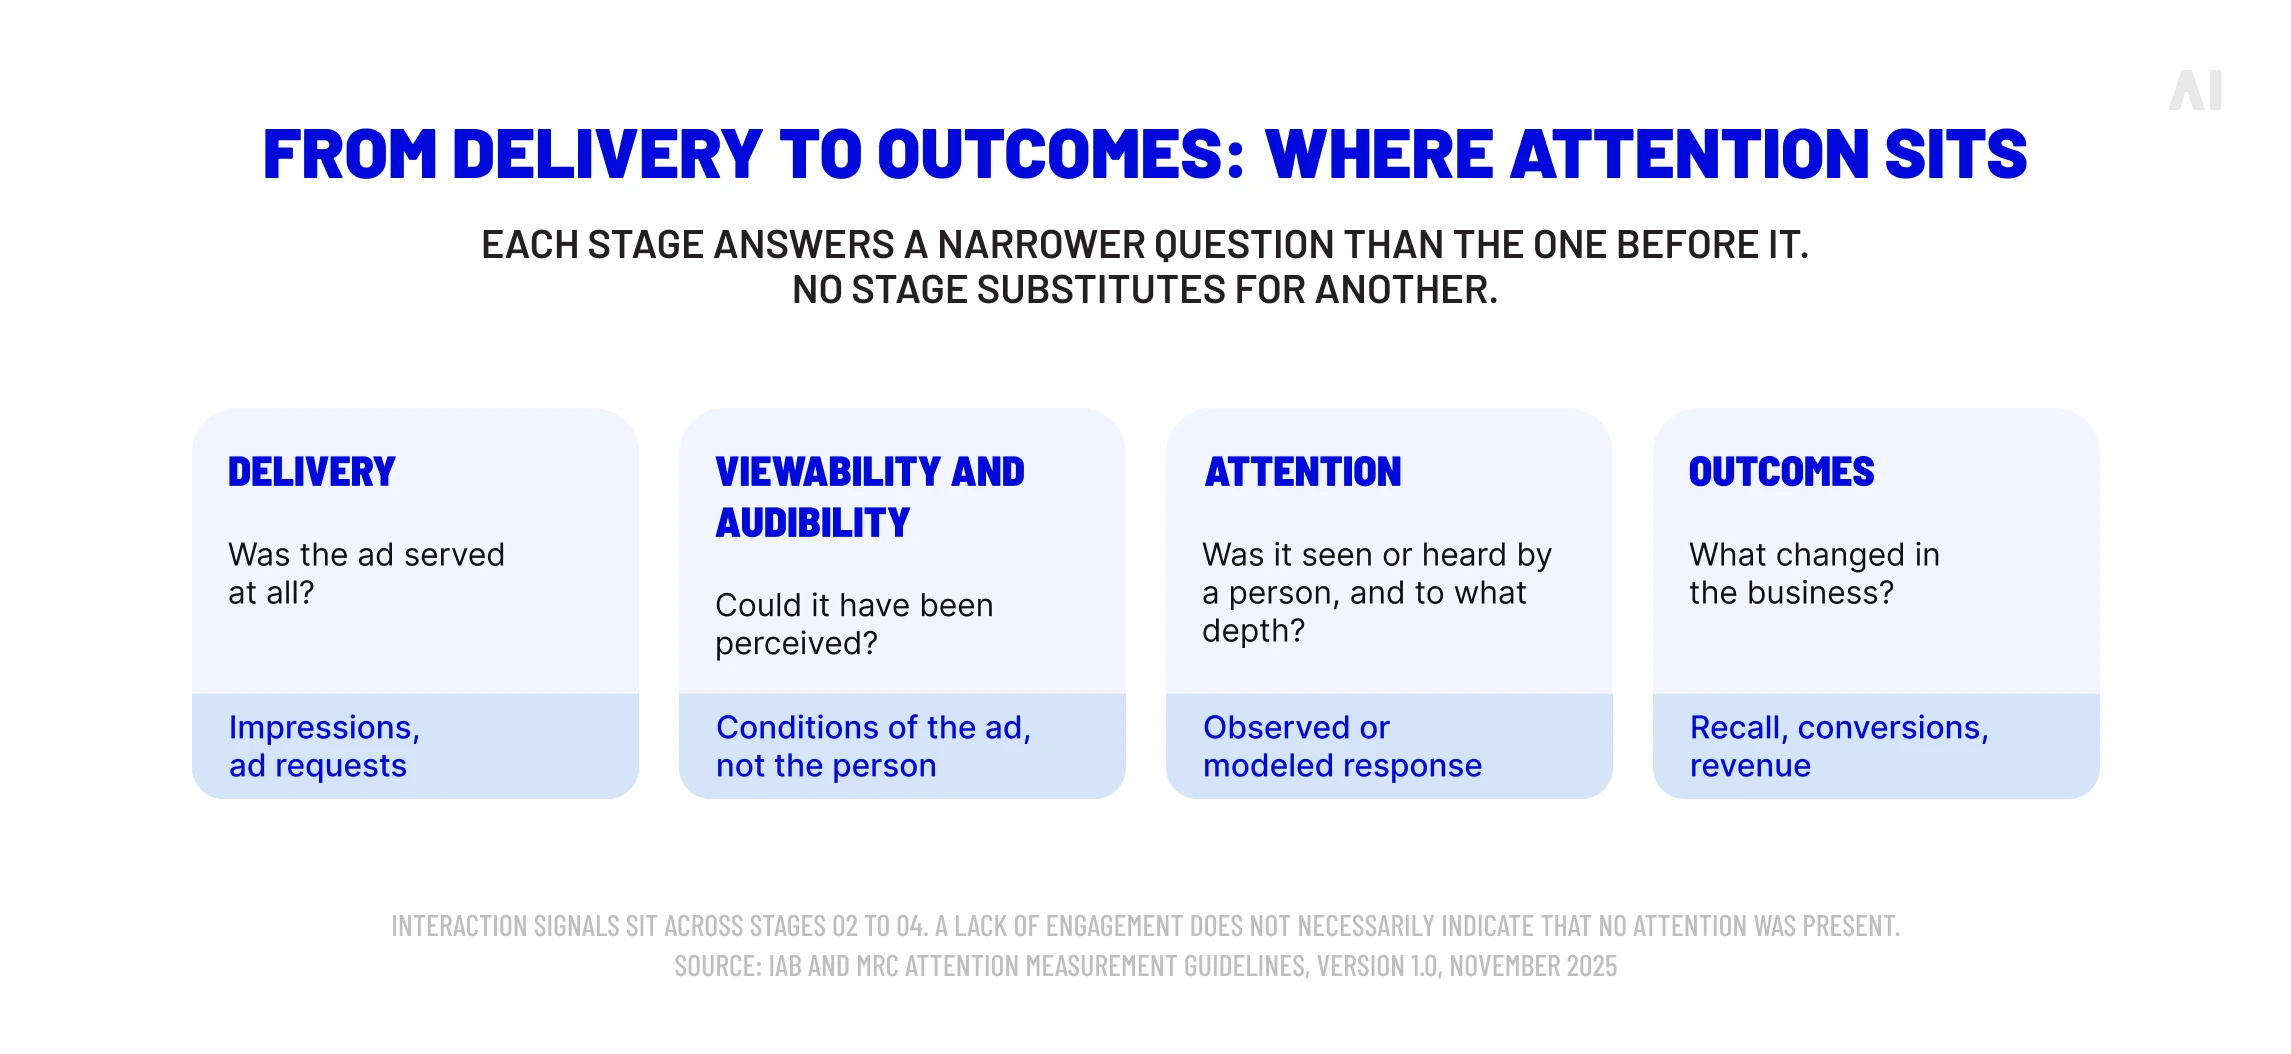
Interaction refuses to sit on any single rung. A click, a swipe, or a hover proves someone engaged, yet silence proves very little, and engagement itself carries no verdict on whether the person liked what they saw. On this the guidelines are explicit: a lack of engagement does not necessarily indicate that no attention was present.
How is advertising attention measured?
No single method measures attention across every channel and format. The IAB and MRC framework organizes the field into five approaches, each collecting different data through different instruments, and each answering a question the others cannot.
The guidelines are deliberate about not ranking these. They decline to identify any approach as generally superior or to recommend one for specific use cases, and they direct measurement users toward independent work (such as the Advertising Research Foundation's Attention Initiative for method comparison) while encouraging buyers to require independent audit and validation from any provider.
Predictive modeling is worth pausing over, since it explains why published summaries disagree about how many approaches exist. It observes nobody. It takes what visual tracking, physiological observation, and panels establish under controlled conditions and projects those findings across log-level data where such instruments cannot reach. Three separate quality questions determine what the output is worth:
- how good the data signals are,
- how good the underlying observational research is, and
- how good the model joining them together is.
A weakness in any one carries straight through to the score.
⚡ Different measurement approaches are not competing answers to one question. They are answers to different questions, and treating their outputs as interchangeable is where most attention analysis goes wrong.
Which attention metrics and signals should marketers actually track?
Which method is best is the wrong question. The right one is which output answers what you are trying to find out. Campaign reports, planning tools, and vendor dashboards surface the signals below in roughly six varieties, and they fall into four tiers whose behavior differs sharply.
Which tier a signal belongs to does more work than the row itself. Read a modeled score as though it were an observation, or time in view as though it were attention, and you arrive at a confident conclusion resting on the wrong evidence.
Exposure and opportunity-to-attend signals
Exposure signals describe the circumstances under which an ad could have been noticed. Viewability is the anchor. Under MRC standards an impression qualifies when at least 50% of the ad's pixels are in view for one continuous second for display or two continuous seconds for video, with a stricter 100% pixel requirement applied for cross-media measurement.
Around that anchor sit the conditions that shape how much opportunity existed.
- Time in view and visible time describe duration, and they differ: visible time counts any period the ad was on screen, including moments below the viewability threshold.
- Share of screen captures prominence relative to surrounding content.
- Ad position and ad density describe where the ad sat and how much it competed with.
On the audio side, audibility, audible time, mute status, and volume level determine whether sound had any chance of contributing.
💡 These sit alongside the broader set of display advertising KPIs that most teams already report.
The guidelines also recommend standardized collection through IAB Tech Lab's Open Measurement protocol, which improves consistency and coverage when signals are compared across publishers and vendors.
None of it establishes that a person looked. The stage was set, the lighting was right, and whether anyone watched belongs to the next tier.
Attentive time and visual focus
Here the measurement turns to focus itself.
- Attentive time estimates how long a person's visual attention rested on the ad.
- Fixation duration measures how long the eye held a specific point,
- Gaze location identifies where on the screen focus fell, and
- Dwell time captures how long it stayed there.
Gaze-based measures depend on calibrated eye or gaze tracking, which confines them to panels, opt-in webcam samples, and controlled studies.
Attentive time is the exception, and the source of most confusion. It appears in campaign reporting at full scale, which means it is usually modeled rather than observed. Two providers can both report attentive seconds while one derives them from measured gaze on a panel and the other predicts them from placement, format, device, and historical patterns. The number looks the same and rests on entirely different evidence.
Reporting attentive time against viewable time is the comparison the guidelines strongly encourage across all approaches, and it does more than either figure alone, because the ratio separates opportunity from response. Two placements can deliver identical viewable seconds while one converts far more of that exposure into focus. The ratio, rather than the raw attentive figure, is what makes placements comparable.
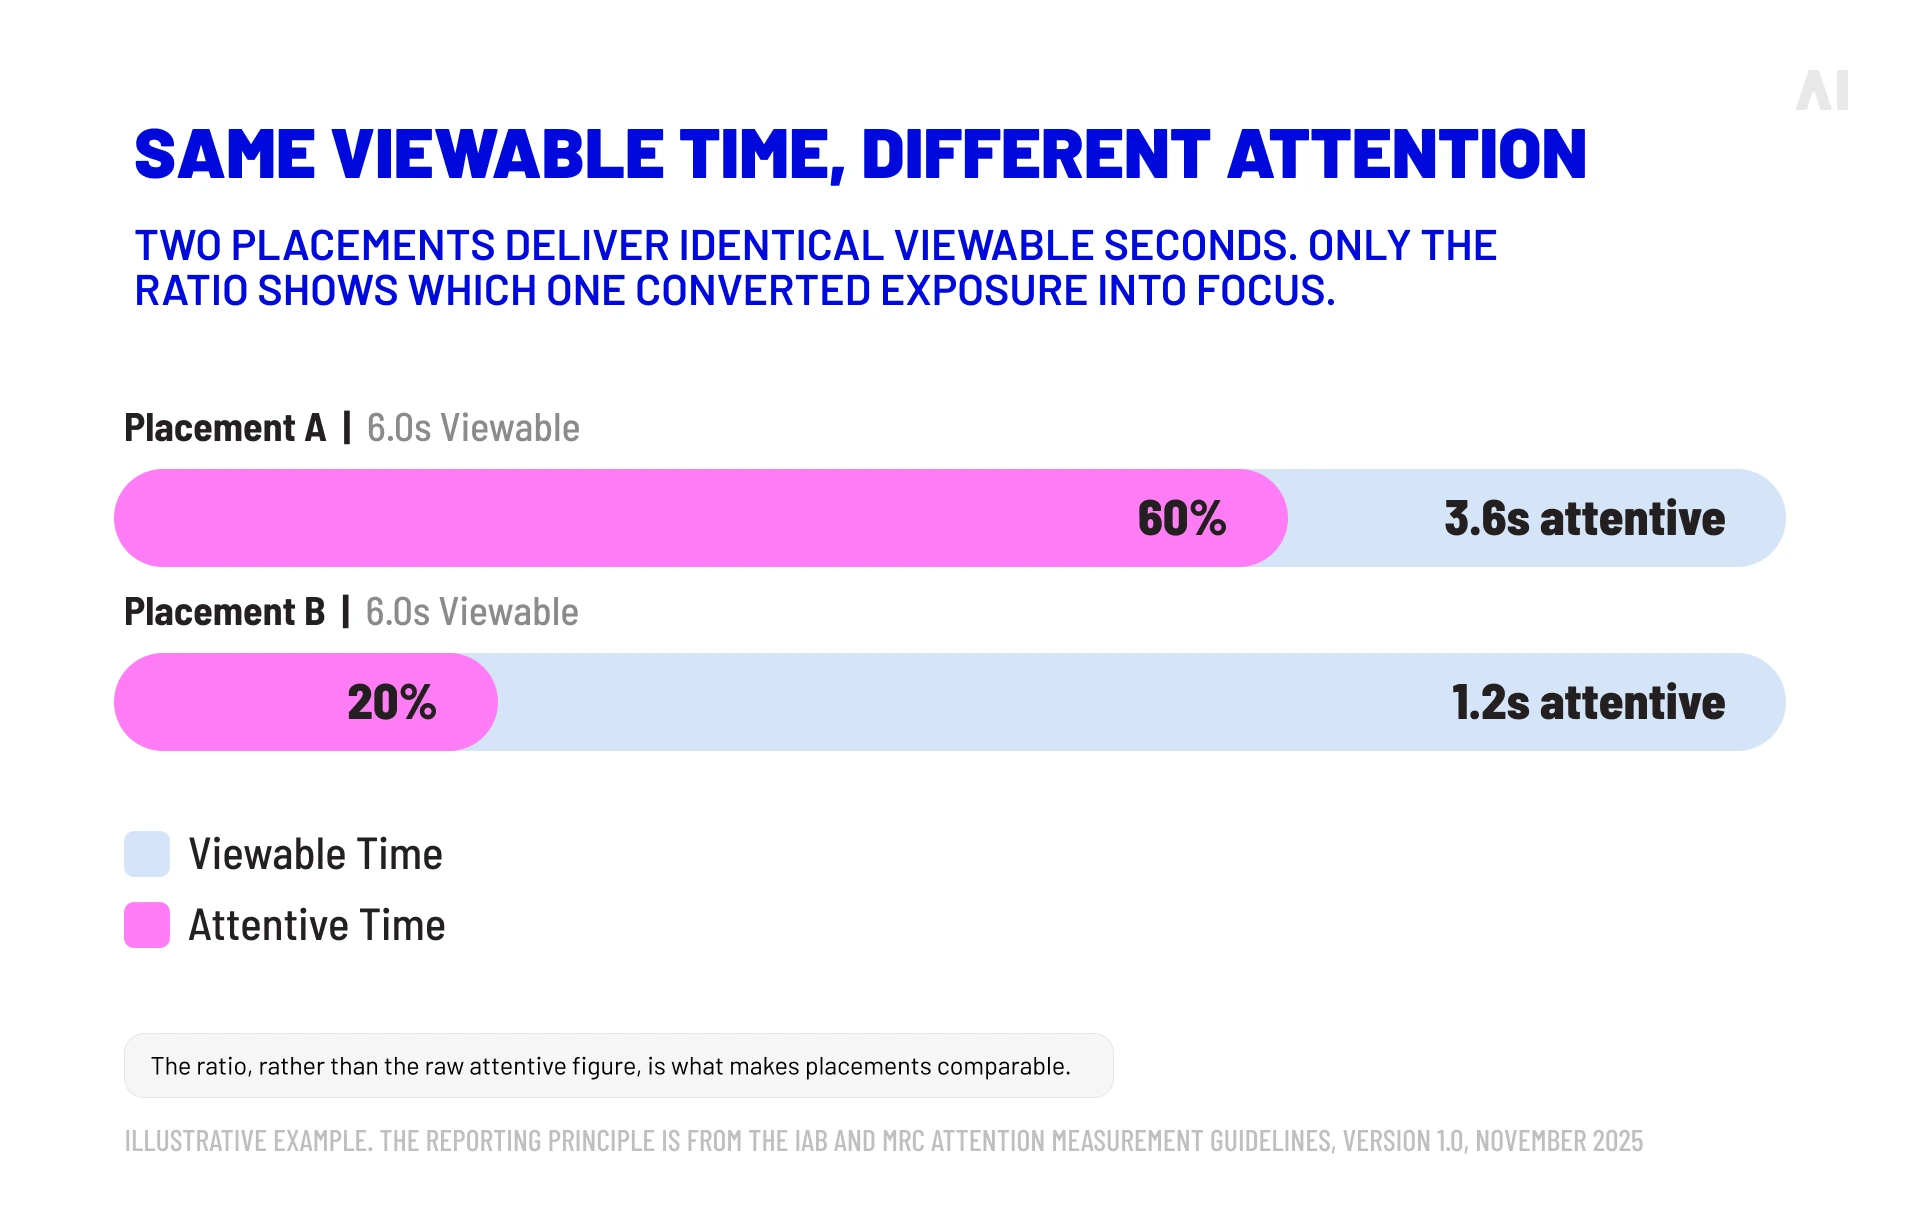
Before treating attentive seconds from different vendors as equivalent, check what generated them.
Interaction and behavioral signals
Behavioral signals record what a person did: scrolling speed and pauses, skips, swipes, hovers, cursor movement, replays, clicks, and engagement with interactive creative. They are attractive because they are unambiguous events rather than estimates, and they feed most attention models as inputs.
Marketers over-read them more often than any other tier. Someone can watch an entire video attentively and touch nothing, which is the norm across CTV and out-of-home, where interaction is barely possible in the first place. An interaction, conversely, carries no inherent sentiment. Pausing and rewinding suggest interest; skipping and closing suggest the opposite. Well-built attention models weight these differently rather than counting them together.
One case in the guidelines shows how far a literal reading can go wrong. A click ends the session on the original property, which stops further contribution to interaction rate and can lower the resulting attention score, even though the user has landed on the advertiser's product page exactly as intended. The signal moves down while the campaign succeeds. MRC guidance encourages providers to weight received or resolved clicks accordingly and to report them distinctly, which is worth asking about during vendor evaluation.
Composite and predictive attention scores
Most attention data reaching campaign reporting arrives as a composite score. Providers combine exposure conditions, placement characteristics, device, behavioral signals, and calibration data from gaze studies, panels, or outcome sets into a single number, usually normalized to a benchmark.
These scores are useful and they are probabilistic. The CIMM and IAB Attention Measurement Playbook for Marketers, built from more than 40 industry interviews, is blunt that attention metrics are probabilistic rather than deterministic, and that adoption succeeds when marketers treat them that way.
Scores therefore carry no shared scale. Two providers may weight duration and interaction differently, set different thresholds for what counts as attentive, train on different data, and benchmark against different inventory sets. A score of 60 from one and 60 from another are not the same claim. Comparing them as though they were is a category error rather than a rounding issue.
Outputs from physiological, neurological, panel, and survey methods appear in this territory too, in the form of cognitive load indices, emotional response scores, and recall lift. These are genuinely informative for creative research. They are not campaign KPIs available across every media environment, and presenting them as such oversells what is running.
How to use attention metrics for campaign decisions
Attention data becomes useful at the point where it changes something. Three applications qualify, each supplying information that reach, frequency, and cost cannot.
Media planning and inventory quality
Attention data supports comparison. It can rank placements, publishers, formats, devices, and environments before a buy, and it can explain performance differences after one.
The most substantial independent evidence here comes from the ARF, which released Phase 3 of its Attention Measurement Validation Initiative in June 2026, analyzing four live national campaigns across television, online video, social media, and digital display. Television and online video consistently generated higher attention than social and display, reflecting differences in screen size, format, and viewing conditions. That is a useful planning input and a dangerous one if read as a ranking. The same research found attention measures aligned most clearly at the broad channel level and diverged more often at platform and placement level, precisely where buying decisions are made.
Two habits protect against reading a channel average as a placement verdict.
- Benchmark across several dimensions rather than one, with performance criteria agreed in advance, since format, device, environment, and forced or unskippable placements all shape what a normal attention level looks like.
- Then request historical platform norms from providers, so that any score can be read against the right comparison set.
Attention belongs alongside reach, frequency, cost, audience quality, and the campaign objective rather than above them. Buying the highest-attention inventory available is a strategy only if attention is the constraint. Often it is not.
Creative testing and optimization
Attention data is at its most diagnostic in creative work, where it can show where viewers looked, which elements held focus, and at what point attention fell away.
Credit for what the media did tends to end up on the creative's account. Guarding against that starts with the three dimensions the guidelines separate:
- content, meaning the environment surrounding the ad,
- placement, meaning its position, size, and format, and
- creative, meaning the ad itself.
Disentangling them has a method. Placement attention is often measured historically, agnostic to the specific creative, which establishes how a slot normally performs. Set that historical baseline against the delivered creative's measured attention and the creative's own contribution comes into view. Reporting should distinguish the two.
MRC guidance adds a requirement worth knowing when evaluating publishers: attention to surrounding content must be measured and considered alongside ad attention when using these measures to assess properties or channels. Judging inventory on ad attention alone ignores the role of the environment and the creative in producing it.
None of this establishes causation. A high-attention creative element correlates with a business result until a controlled test says otherwise.
Programmatic buying and in-flight optimization
In programmatic advertising, attention data supports pre-bid filtering, inventory scoring, curated PMPs, custom bidding algorithms, and in-flight adjustment. The operational distinction to hold onto is between measured and predicted attention.
Impression-level decisioning cannot observe a viewer in real time. Pre-bid attention segments and bid multipliers run on modeled scores derived from placement, format, device, context, and historical attention patterns. That is a legitimate and useful application, and it is a probability estimate about inventory rather than an observation about a person. The distinction changes how much weight the score should carry.
Used as a binary filter, attention scores narrow supply in ways that can raise CPMs, cut reach, and push budget toward formats that score well by being intrusive. Used as one weighted input alongside audience quality, frequency, cost, and business performance, they improve supply selection without those side effects. Attention works better as a bid modifier than as a gate.
How attention metrics connect to business outcomes
Attention becomes commercially meaningful when tested against the outcomes a campaign was built to produce. Industry guidance is unusually direct on this point: attention in and of itself should not be considered or used as a measure of outcomes for evaluating campaign performance, though it is valuable for understanding exposure and engagement alongside outcome measures.
Validation comes in two levels, and conflating them accounts for most of the overclaiming in this category.
- Observational validation covers correlations, historical benchmarks, and comparisons against norms, and it can show that higher attention tends to appear where stronger outcomes appear.
- Causal validation covers randomized control trials, A/B tests, holdouts, and incrementality tests, supported where experiments are impractical by non-experimental methods such as k-fold cross-validation, truth sets built from directly observed first-party data, and placebo analysis.
Only the second supports a claim that changing attention changed the business result.
Treat those pairings as a starting structure rather than a template, since which signal is relevant depends on what your provider actually measures. The validation column is where most attention programs either succeed or fail to prove anything at all. Building attention into a broader marketing measurement strategy is what turns it from an interesting number into evidence.
⚡ The useful question is not how much attention a campaign generated. It is whether the attention it generated was associated with anything the business cared about, and whether that association survives a controlled test.
How attention metrics are being standardized
The IAB and MRC published the final Attention Measurement Guidelines, Version 1.0, in November 2025, developed with the Coalition for Innovative Media Measurement and input from more than 200 experts across brands, agencies, publishers, and measurement companies. They establish common definitions, minimum requirements for each measurement approach, data quality and modeling standards, privacy expectations, disclosure requirements, and auditing guidance.
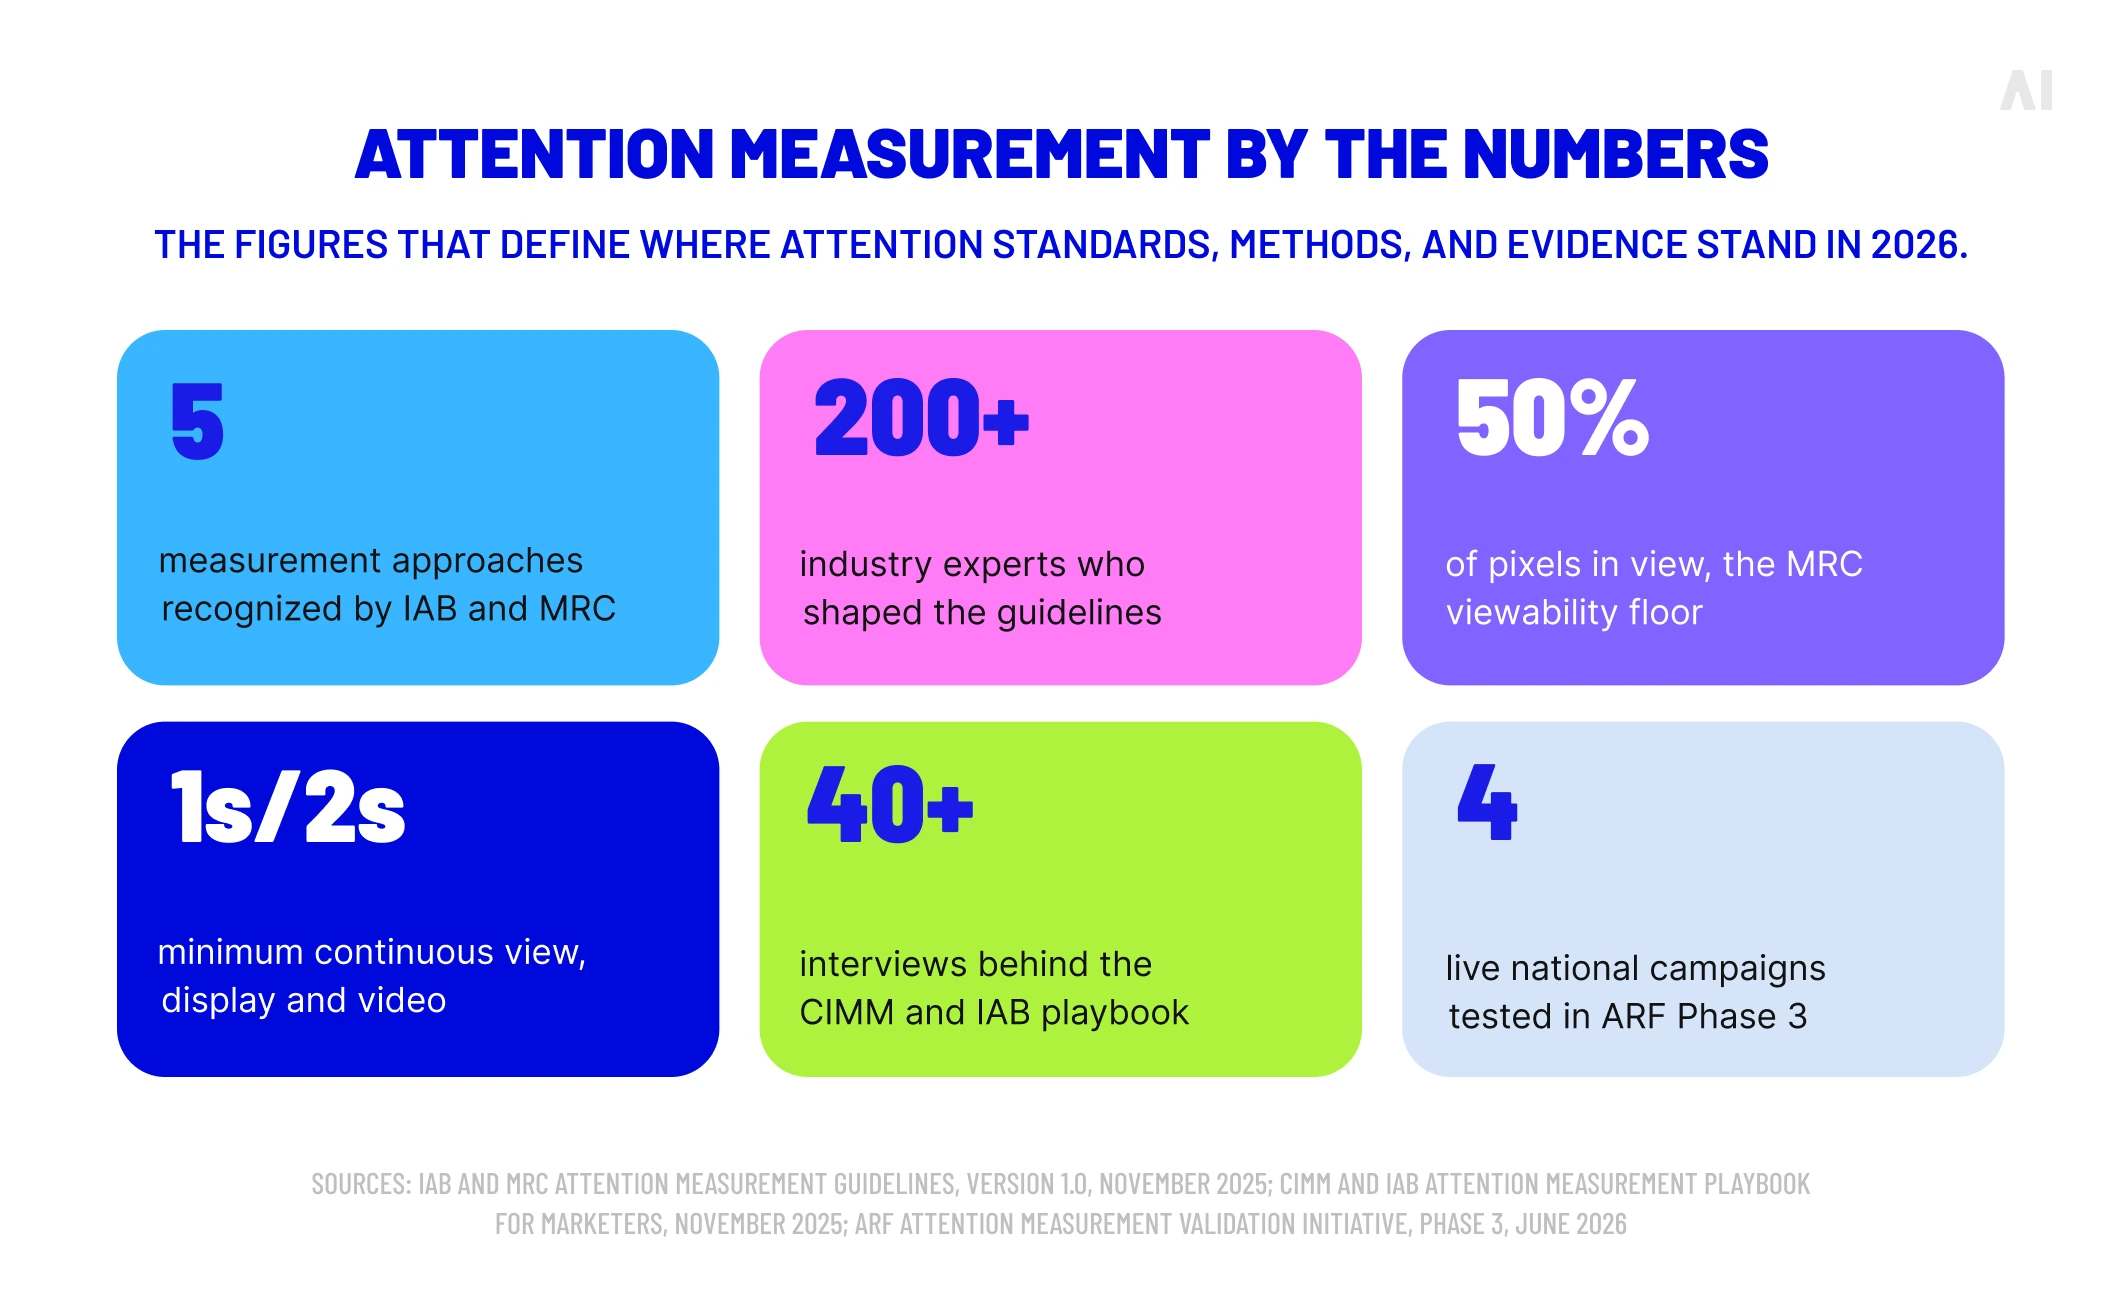
Most of the substance sits in the minimum requirements. MRC treats attention as a measure of persons rather than devices, on the reasoning that persons generate attention, and three prerequisites follow for any compliant attention measure:
- a base of viewable or audible impressions,
- full sophisticated invalid traffic filtration, and
- confirmation or reasonable indication that a user was present.
Providers may also report attention measured before or without the viewable condition, though they must identify those figures separately as diagnostic.
Standardization has not made vendor outputs comparable. The guidelines define what good practice looks like without collapsing methodological differences, and the ARF's finding that methods diverge at platform and placement level was published seven months after the guidelines were finalized. Nor is accreditation universal. Accreditation is granted per metric and per environment rather than as a vendor-level badge, which means a provider's accredited status for one product says nothing about the product being sold. DoubleVerify's Authentic Attention metrics were first accredited in January 2023, and in April 2026 the MRC continued that accreditation while extending it to cover authentic non-viewable and authentic modeled video impressions. The right question for a vendor is which specific metrics carry accreditation, in which environments, and when they were last audited.
Risks and limitations of attention metrics
Attention data improves decisions and produces confident errors, sometimes in the same report. Five failure modes account for most of the second kind.
Provider methodologies and scores are not directly comparable
Providers differ in the signals they collect, the samples they calibrate against, the models they build, the thresholds they set for attentive exposure, the channels they cover, and the benchmarks they normalize to. The ARF found the resulting measures aligned reasonably at broad channel level and diverged at granular levels, which is where optimization decisions actually get made.
Evaluate methodology and validation rather than comparing scores. Ask what is observed and what is modeled, what the calibration data consists of, how thresholds were derived and validated, which environments are covered, and what error margins the provider discloses. Then keep one methodology consistent across a campaign, because switching providers mid-flight makes the resulting trend meaningless.
Privacy, consent, and data collection
Attention measurement does not require identifying individuals. The guidelines are explicit that meeting audience requirements does not mean or require identification of a person or the assignment of demographic or behavioral characteristics.
Methods differ sharply in what they do require. Data-signal approaches operate on device and placement information without person-level identification. Eye tracking, webcam-based measurement, panels, and physiological monitoring involve person-level data collection and demand explicit consent, with GDPR and CCPA compliance built into the collection design. Some countries prohibit neurological monitoring and comparable methods for marketing purposes outright.
No methodology is inherently privacy-safe. Requirements vary by jurisdiction and by implementation, and they change.
Modeling bias and coverage gaps
Modeled attention inherits the properties of its training data. If the panel underrepresents certain devices, environments, or populations, the model carries that gap into every score it produces. The guidelines require that limitations in measuring the intended universe, including systematic biases from unsampled geographies or respondent types, are fully disclosed and quantified where they can be, and that estimates are projected to the intended universe rather than to whatever coverage the vendor achieved.
A subtler risk hides in data rules. Excluding outliers is standard engineering practice and a recognized source of bias, since outliers often represent real consumers who simply differ from the mean. Broad exclusion policies need empirical support rather than acceptance as housekeeping.
Coverage itself varies dramatically by channel, and data signals do not reach everywhere.
Cross-channel attention comparisons run straight into these differences. The measurement is not merely less precise in some environments, it is produced by a different method answering a slightly different question.
Correlation does not prove causation
Higher attention appearing alongside stronger outcomes is a pattern, not a mechanism. The ARF's Phase 3 work found no simple one-to-one relationship between attention and upper-funnel brand lift. Lower-attention channels sometimes delivered meaningful recall and awareness gains when they carried sufficient media weight, reach, and frequency, while higher-attention channels did not always produce the strongest lift on their own.
That finding should temper any budget decision made on attention scores alone. Media weight shapes whether attention converts into brand impact, which means an attention score read without exposure volume beside it is missing half the explanation. Validate with a controlled test before reallocating spend.
More attention is not always better
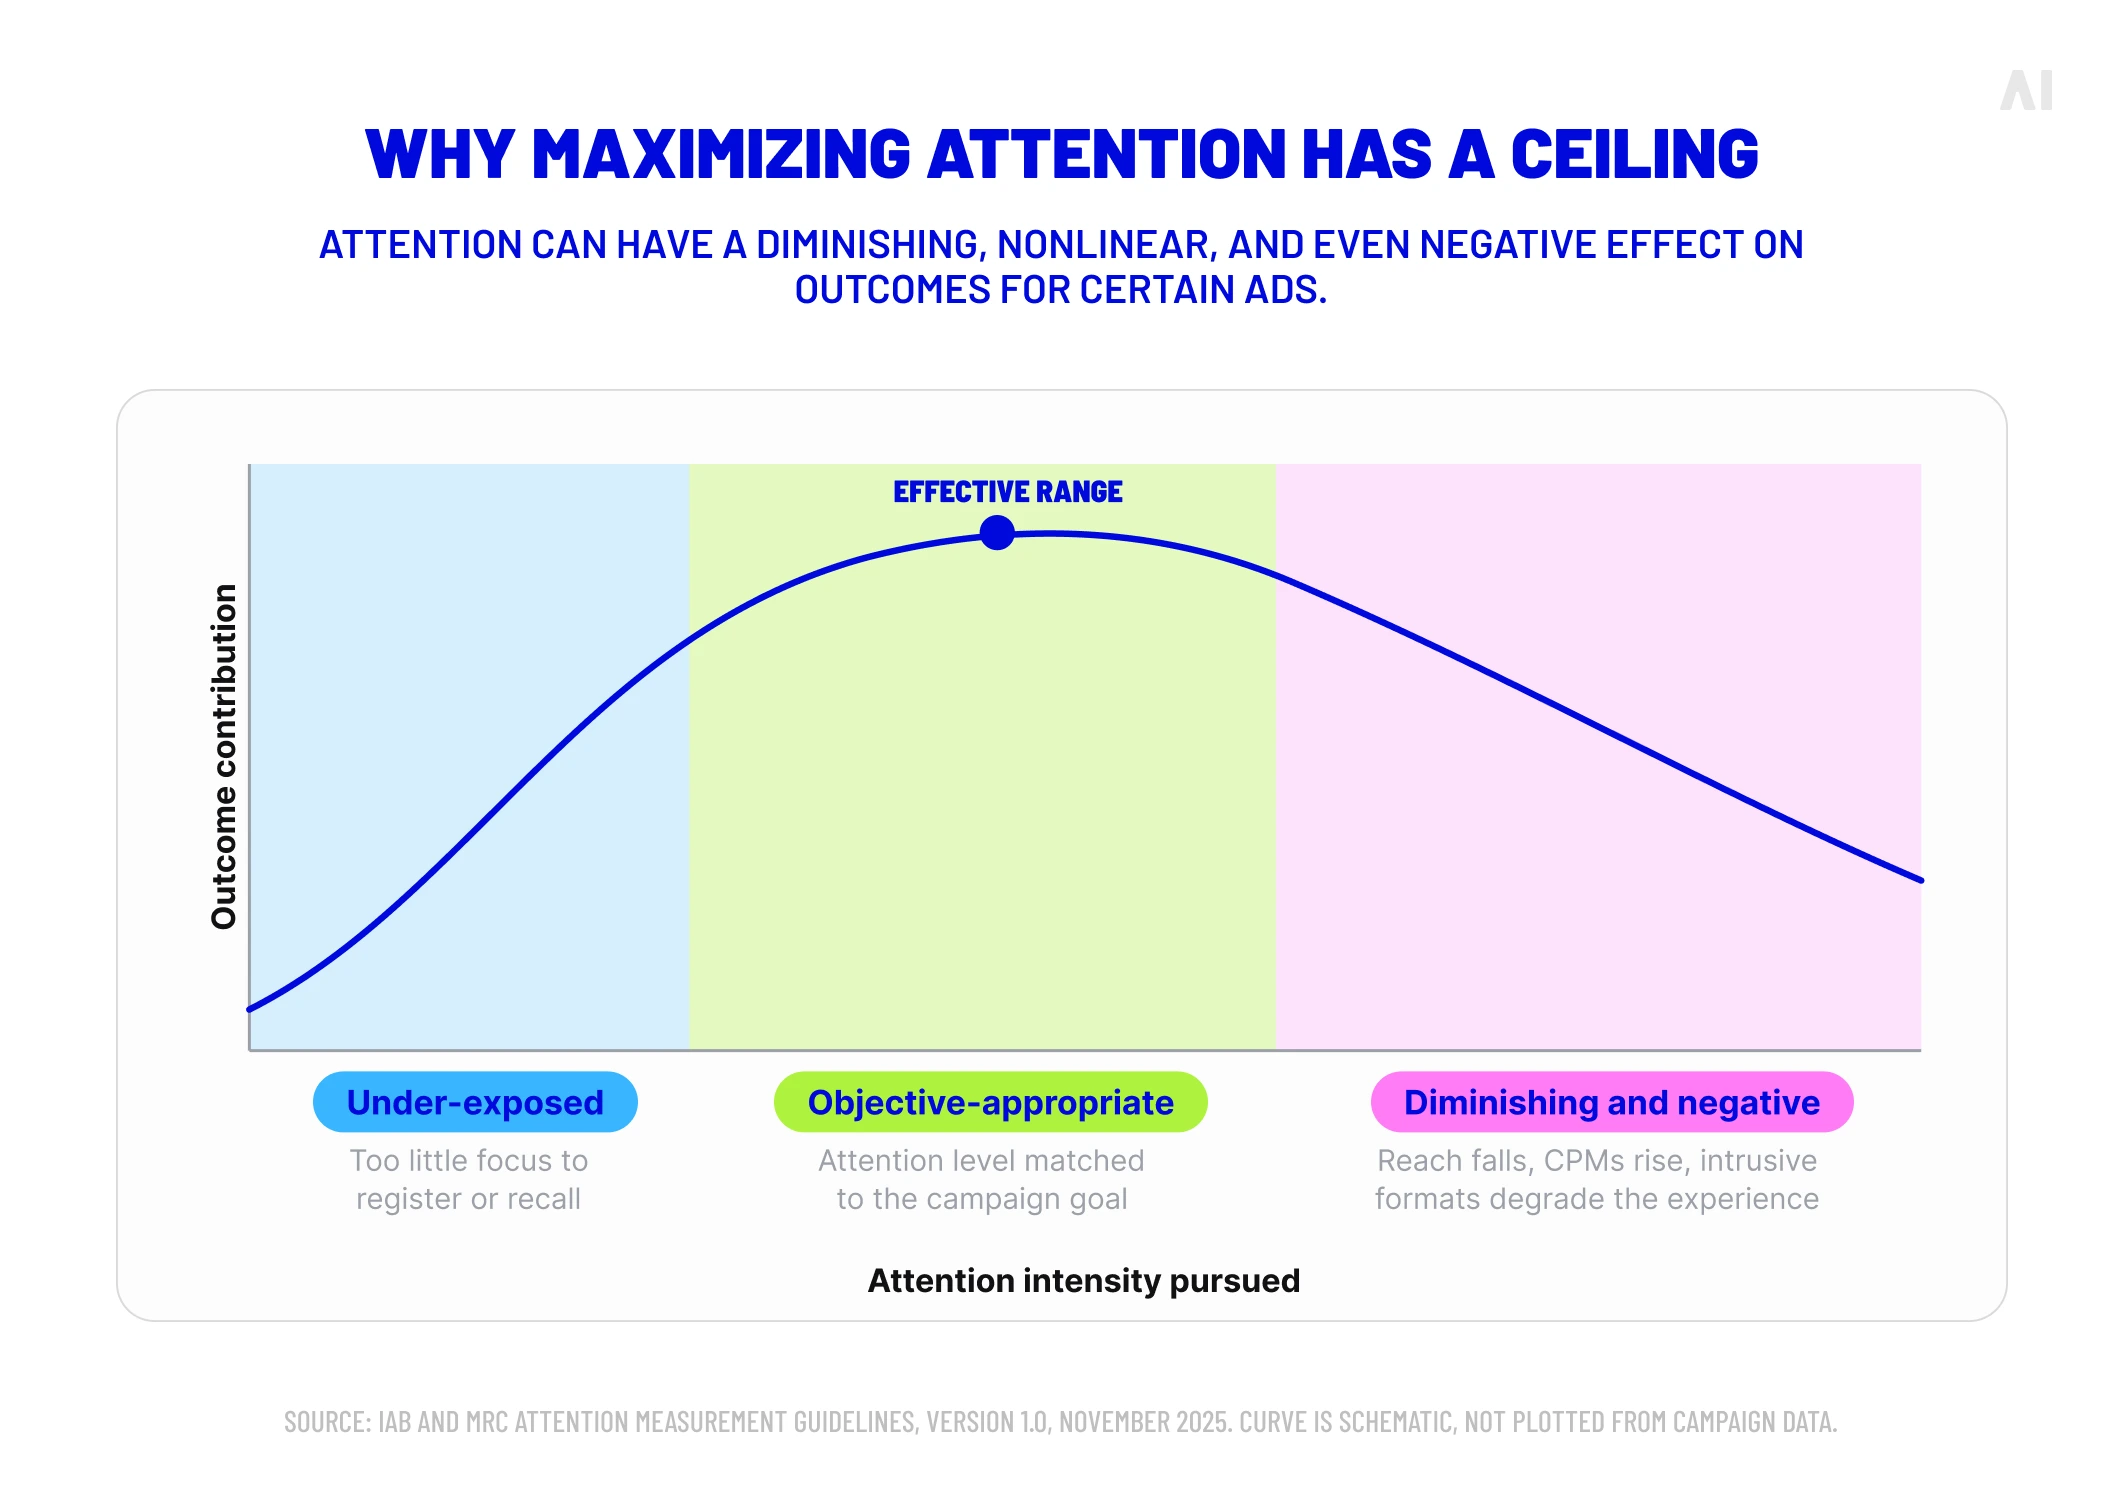
Maximizing an attention score is a strategy with a ceiling and a cost. Pushing for it can reduce reach, raise CPMs, favor formats that hold attention by being difficult to ignore, and degrade the user experience in ways that damage the brand the campaign is meant to build.
Industry guidance anticipates this directly, noting that attention may have a diminishing, nonlinear, and even negative effect on outcomes for certain ads, and that planning should account for those diminishing effects along with the user experience consequences of optimizing for attention. Treat attention as a graduated quality signal with an appropriate level for each objective rather than a number to maximize. A direct response campaign that drives a click is not failing because the click ended the attention measurement.
How AI Digital keeps attention in a broader measurement framework
Attention data is most useful when it sits inside a measurement system that also holds delivery data, audience quality, cost, and business outcomes. Read in isolation, an attention score describes media quality without saying whether the media worked.
Elevate, AI Digital's marketing intelligence platform, is built for that kind of consolidation. It unifies research and intelligence, strategic planning, optimization and reporting, and a library of AI agents in one environment, drawing on 150 billion monthly data points and more than 10,000 audience attributes, with reporting centralized across 12+ integrated DSPs alongside search and social.
Its governing principle is KPI-first optimization, meaning it optimizes toward real revenue and actual conversions rather than platform metrics. Attention scores are platform-adjacent in exactly the sense that framing implies. They describe the quality of an exposure, and they become decision-grade only once tested against something a business books. Elevate's Path to Conversion mapping and marketing mix modeling are where that test happens, connecting media-level signals to cross-channel influence and to the touchpoints preceding conversion.
Attention enters this picture as one possible external input among many. Elevate does not generate proprietary attention scores, perform eye tracking, or integrate specific attention measurement providers. Third-party attention data can inform planning and optimization decisions in the same way other external quality signals do, evaluated against the outcome measures already running rather than trusted on its own authority.
Conclusion on attention metrics advertising: Measure attention without losing sight of outcomes
Which attention metric is most useful depends entirely on the question.
- Comparing placement quality calls for exposure signals and the ratio of attentive to viewable time.
- Diagnosing a creative calls for observed visual focus and the moment it dropped away.
- Scaling supply decisions calls for modeled scores, read as probability estimates about inventory.
Establishing that any of it moved the business calls for something else entirely, and that something is a controlled test.
What holds across all of them is that attention describes a stage in a process rather than its conclusion. It is a stronger media quality signal than viewability and a weaker evidence base than an incrementality test, and it performs best when marketers are precise about which of those two things they need. Providers who explain their methodology, disclose their limitations, and submit to independent audit are the ones whose numbers can carry weight in a budget conversation.
If you are working out where attention data fits in your measurement stack, get in touch with AI Digital to talk through how it connects to the outcomes you are accountable for.