Display Ad KPIs That Actually Drive Performance (Not Just Reports)
Mary Gabrielyan
May 14, 2026
16
minutes read
Most senior marketers can name their top display advertising KPIs from memory, yet most still struggle to explain to the CFO which of those numbers moved the needle on revenue last quarter — a disconnect that's costing the industry billions and eroding confidence in the channel itself. What follows is a working framework for choosing, reading, and acting on display KPIs — the ones that actually shape business outcomes, not the ones that exist to make a dashboard look busy.
Display advertising has never been more measurable. Every impression served, every pixel that loaded into a viewable browser window, every click, every view-through—all of it streams back in near-real time across a dozen platforms and as many dashboards. US programmatic display spending approached$180 billion in 2025, and programmatic now accounts for over 90% of all digital display buying in the US. WARC's forecast has global ad spend growing 8.1% in 2026 to reach $1.27 trillion, with almost every incremental dollar flowing to digital channels.
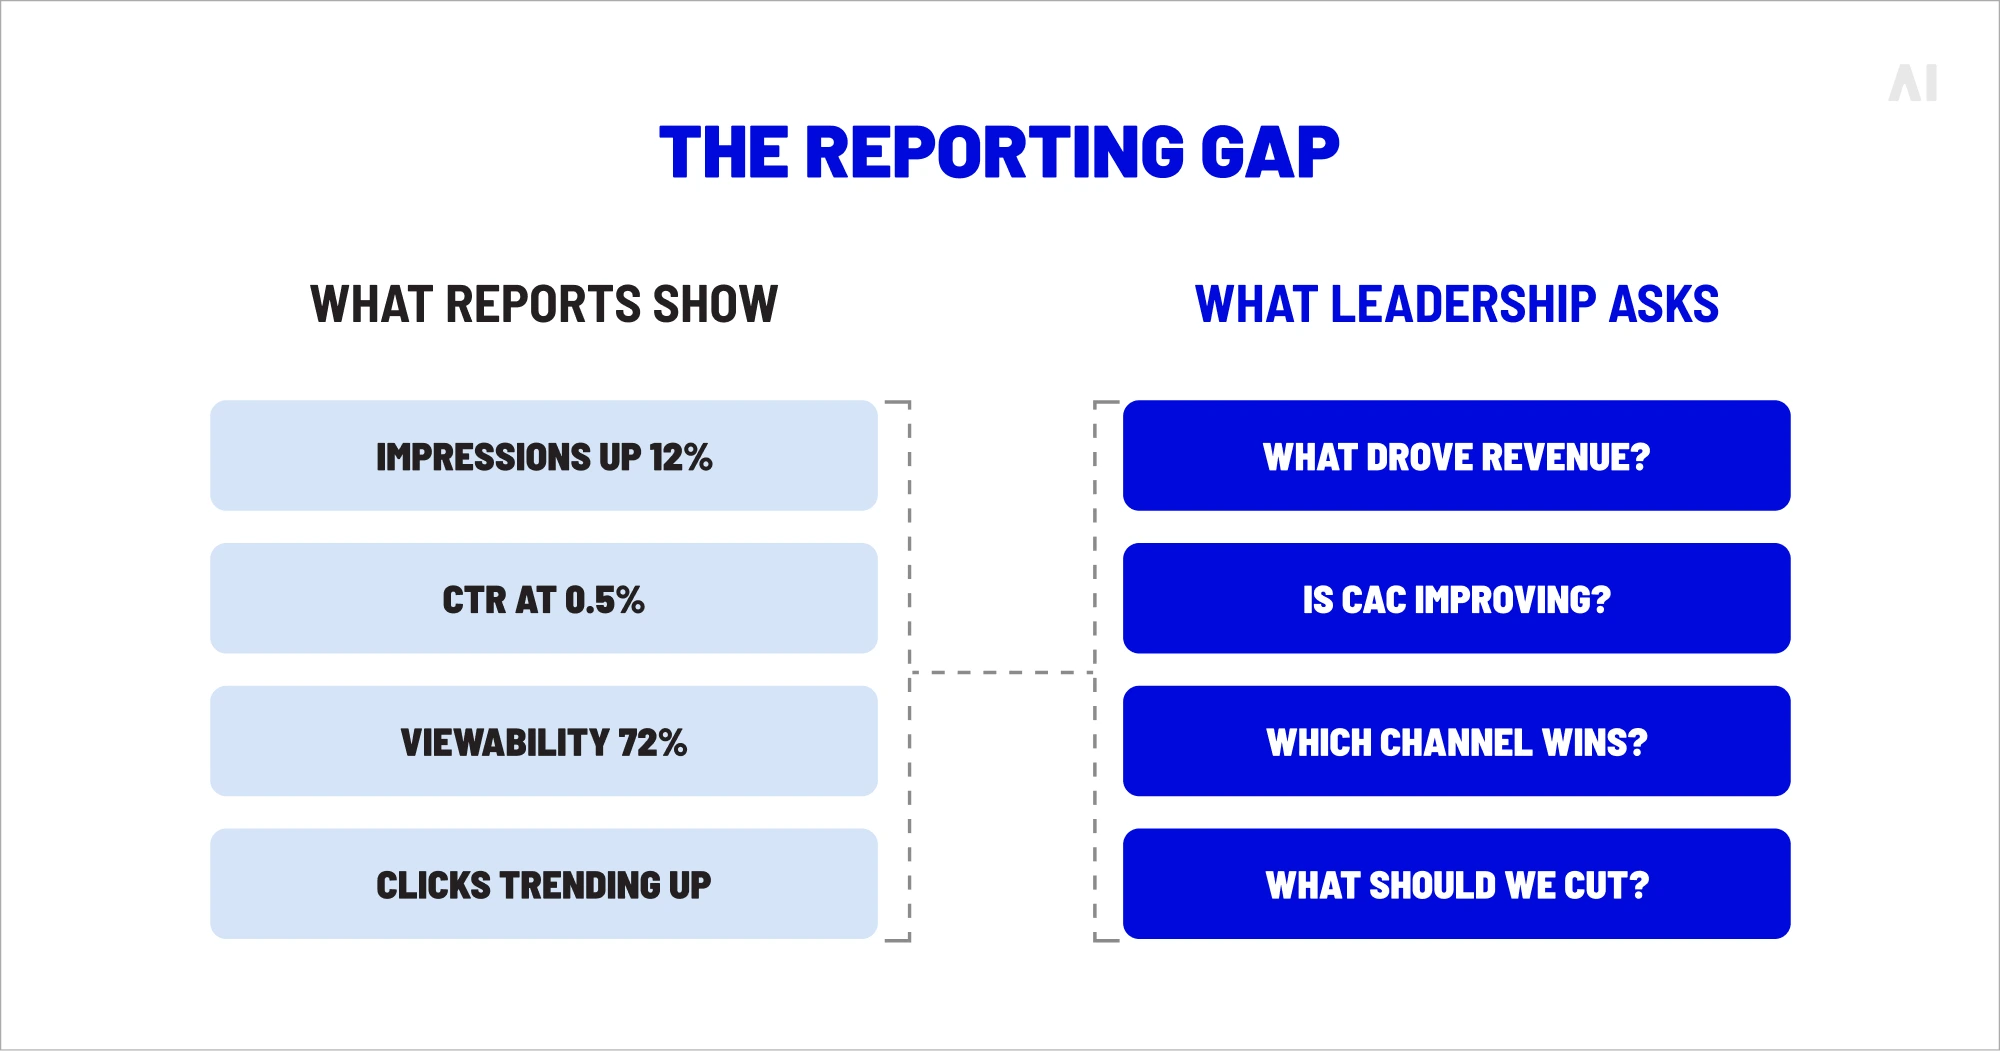
And yet the gap between what gets reported and what actually drives growth keeps widening. Impression counts climb, click-through rates twitch up or down by a tenth of a percent, viewability hits the benchmark—and meanwhile the CFO is asking, again, what any of it contributed to revenue last quarter. Display advertising KPIs have multiplied faster than the business logic connecting them to outcomes, and most display reports reflect that imbalance.
This article is a practical guide to closing the gap. It covers which display ad metrics actually matter for senior marketing decision-makers, how to choose them, how to interpret them in funnel context, and how to turn the resulting display ad monitoring into optimization, budget allocation, and growth decisions rather than passive reporting. We'll cover theten KPIs that belong in every report, the advanced metrics that separate teams measuring attention from teams measuring impressions, and the common mistakes that quietly distort performance conclusions.
💡 For more on how media planning decisions shape the metrics you end up measuring, see our guide on media planning and buying.
Why most display advertising KPIs fail
Most display reports fail not because the numbers are wrong, but because they answer the wrong questions:
They tell you how many times your ads were served, not how many of those served impressions were seen by a real human with a budget to spend.
They tell you the click-through rate, not whether the people clicking were the people you paid to reach.
They tell you viewability, not whether the viewable ad captured any actual attention.
The result is a dashboard full of green ticks sitting on top of a performance picture that nobody at leadership level finds remotely reassuring.
The reporting gap.
Three failure patterns recur across the industry.
The first is vanity-metric inflation. Platforms optimize for the numbers they're best at producing, and media teams report against what the platforms show them. An ANA and eMarketer analysis found programmatic ad waste grew 34% in two years—and that's waste inside systems that report themselves as performing to plan. Rising reported metrics and rising wasted spend are not mutually exclusive; they frequently coexist.
The second is fragmentation. Display campaigns now span multiple DSPs, SSPs, walled gardens, and direct deals, each measuring events with its own definitions, attribution windows, and filtering logic. An IAB study found that 88% of professionals reported major confusion stemming from the shifting third-party cookie and identity guidance across 2024 and 2025. If the inputs don't align, the outputs can't.
The third is the missing revenue link. Gartner's 2025 CMO Spend Survey found marketing budgets flatlined at 7.7% of company revenue, and63% of CMOs named budget constraints as their top challenge for 2026. CMOs under that pressure don't need another slide showing that impressions grew quarter on quarter—they need to know which media investment actually generated demand. When KPIs stop at the media layer and never cross into business outcomes, reports become evidence of activity rather than evidence of impact.
⚡ Reports tell you what happened. KPIs should tell you what to do next.
💡 For a broader view of how display fits into the modern ad tech stack, read our primer on digital display advertising.
Choosing display metrics is, whether it feels like it or not, a strategic decision. A useful framework for making it has three parts.
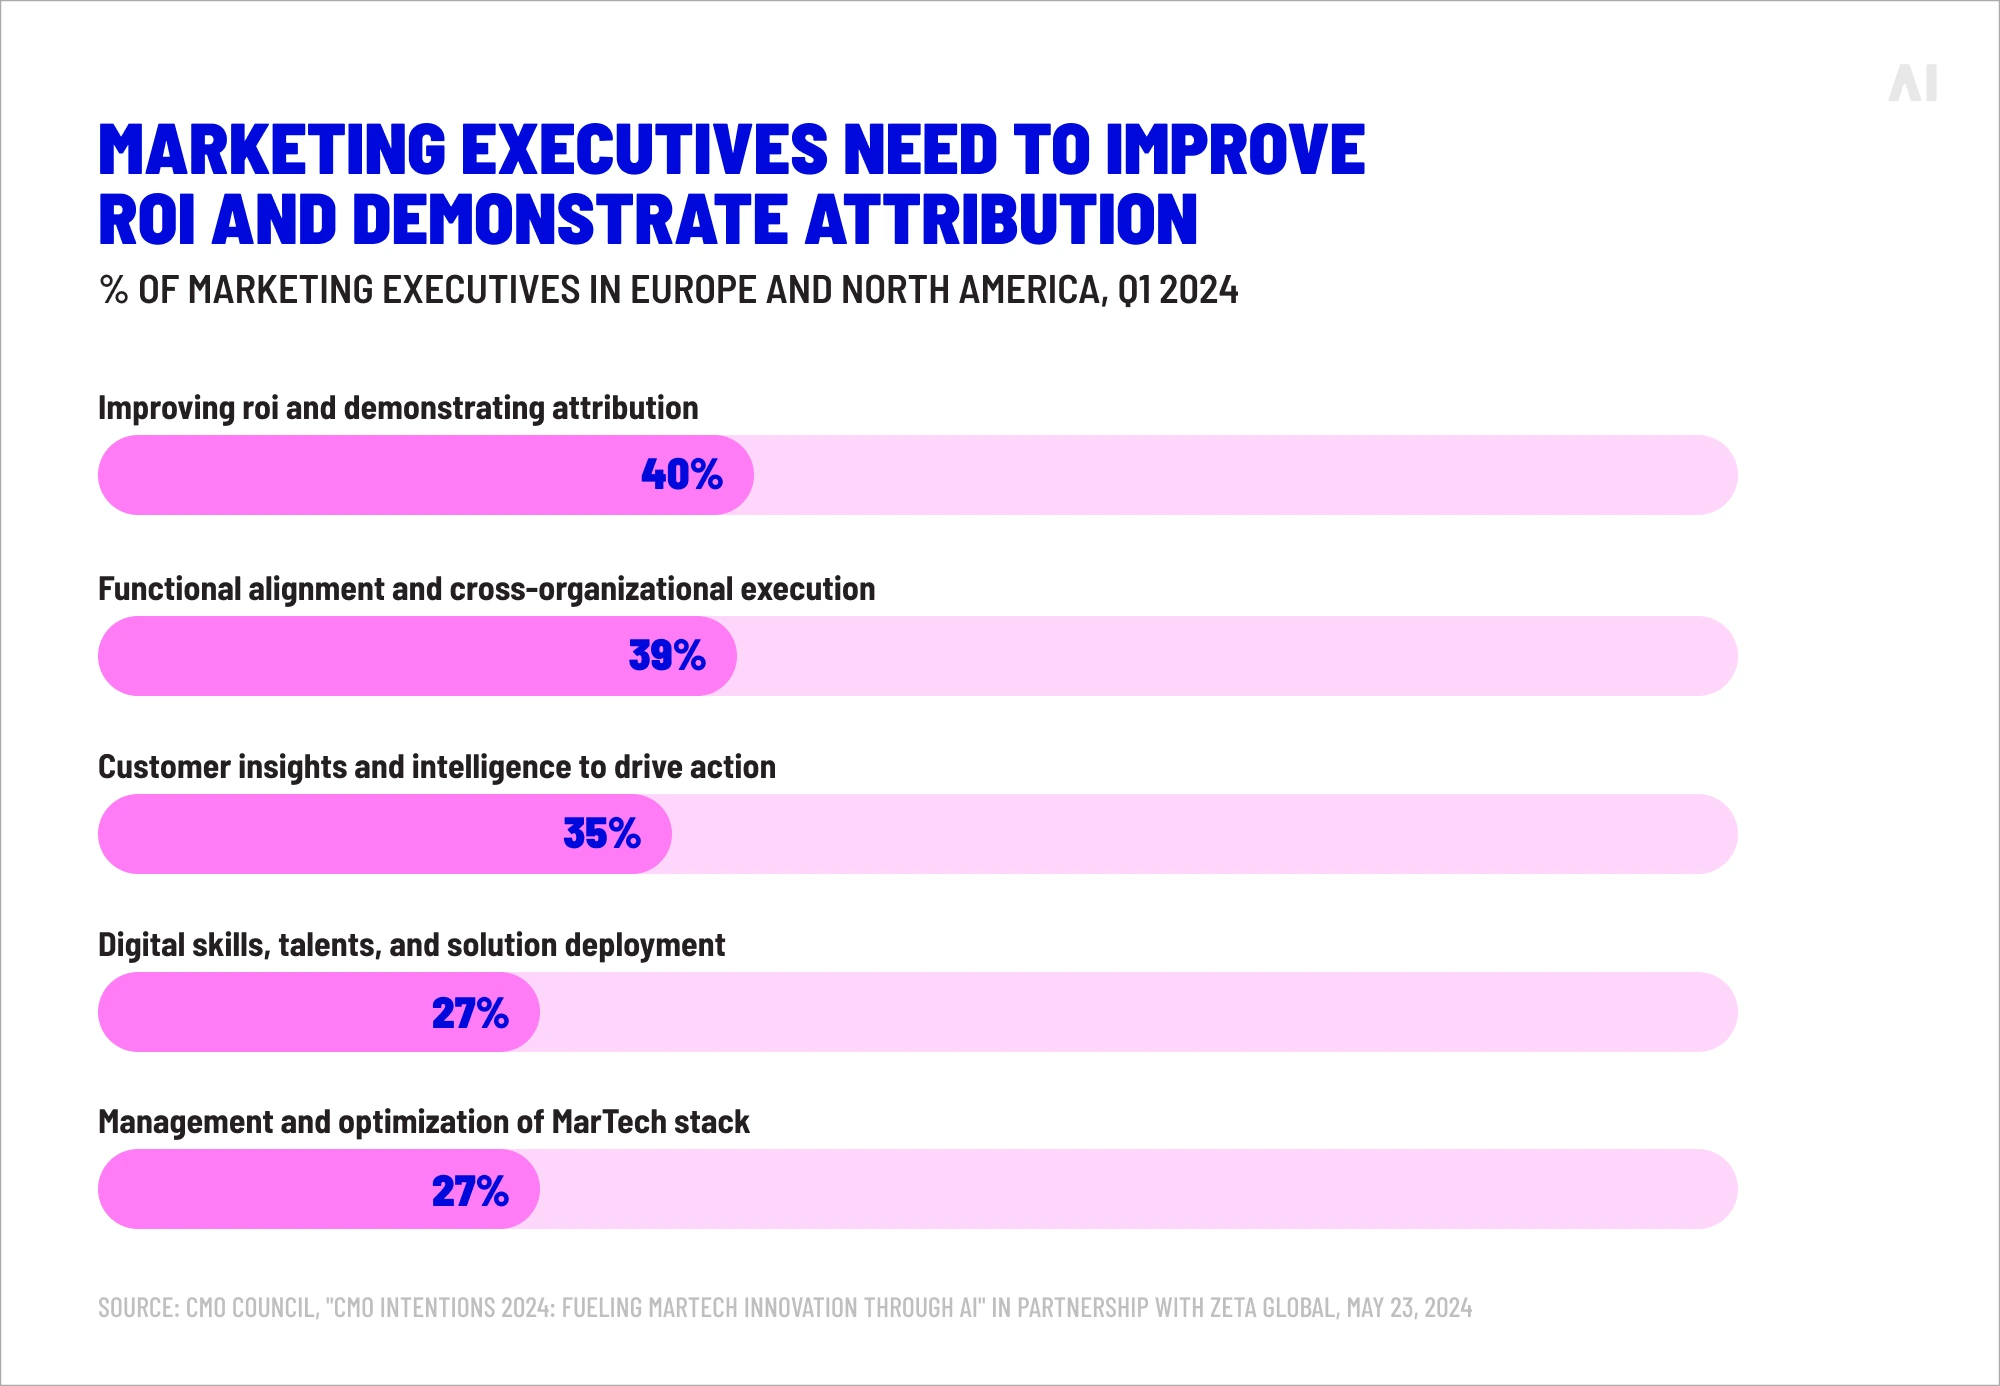
Start with the business goal, then work backwards to the metric. If the objective is new customer acquisition, CPA and incremental reach matter more than CTR. If the objective is category entry against an incumbent, attention quality and share of voice carry more weight than clicks. This sounds obvious, yet a striking share of reports still lead with whichever metric the platform surfaces most prominently. AneMarketer finding shows 40% of CMOs now prioritize demonstrating attribution across every element of the marketing mix—a shift driven precisely by the recognition that platform-default metrics no longer satisfy a revenue-focused conversation.
Map metrics to funnel stage. Upper-funnel campaigns should be judged on reach, frequency, viewability, and attention. Mid-funnel campaigns deserve CTR, engagement depth, and view-through contribution. Lower-funnel campaigns live or die by CVR, CPA, and ROAS. Applying a single KPI set uniformly across the funnel is one of the most common causes of misallocated spend—we'll return to this in the mistakes section.
Balance leading and lagging indicators with defined benchmarks. CTR and viewability are leading indicators; they tell you quickly whether creative and placement are working. CPA and ROAS are lagging indicators; they confirm whether the leading signals translated into business outcomes. You need both, and you need benchmarks for both—otherwise optimization turns into reacting to noise.
% of marketing executives on how to improve marketing operations (Source)
This framework only works at scale when measurement is consistent across channels and platforms. That's where AI Digital's Open Garden framework fits. Unlike walled-garden environments that silo audience data and report on their own terms, the Open Garden approach gives advertisers cross-DSP visibility, transparent inventory access, and unified performance reporting—the infrastructure that makes consistent KPI measurement across the whole display ecosystem possible rather than aspirational. The framework discipline above sets the rules; Open Garden makes the rules enforceable in practice.
The same urgency applies on the technology side. The earlier citedGartner survey of 413 marketing technology leaders found81% were either piloting or had already implemented AI agents in their organizations. Measurement is moving in an obvious direction—faster, more automated, increasingly capable of drawing a line between media activity and commercial results. The catch, as ever, is that none of it delivers much without the right data and framework underneath.
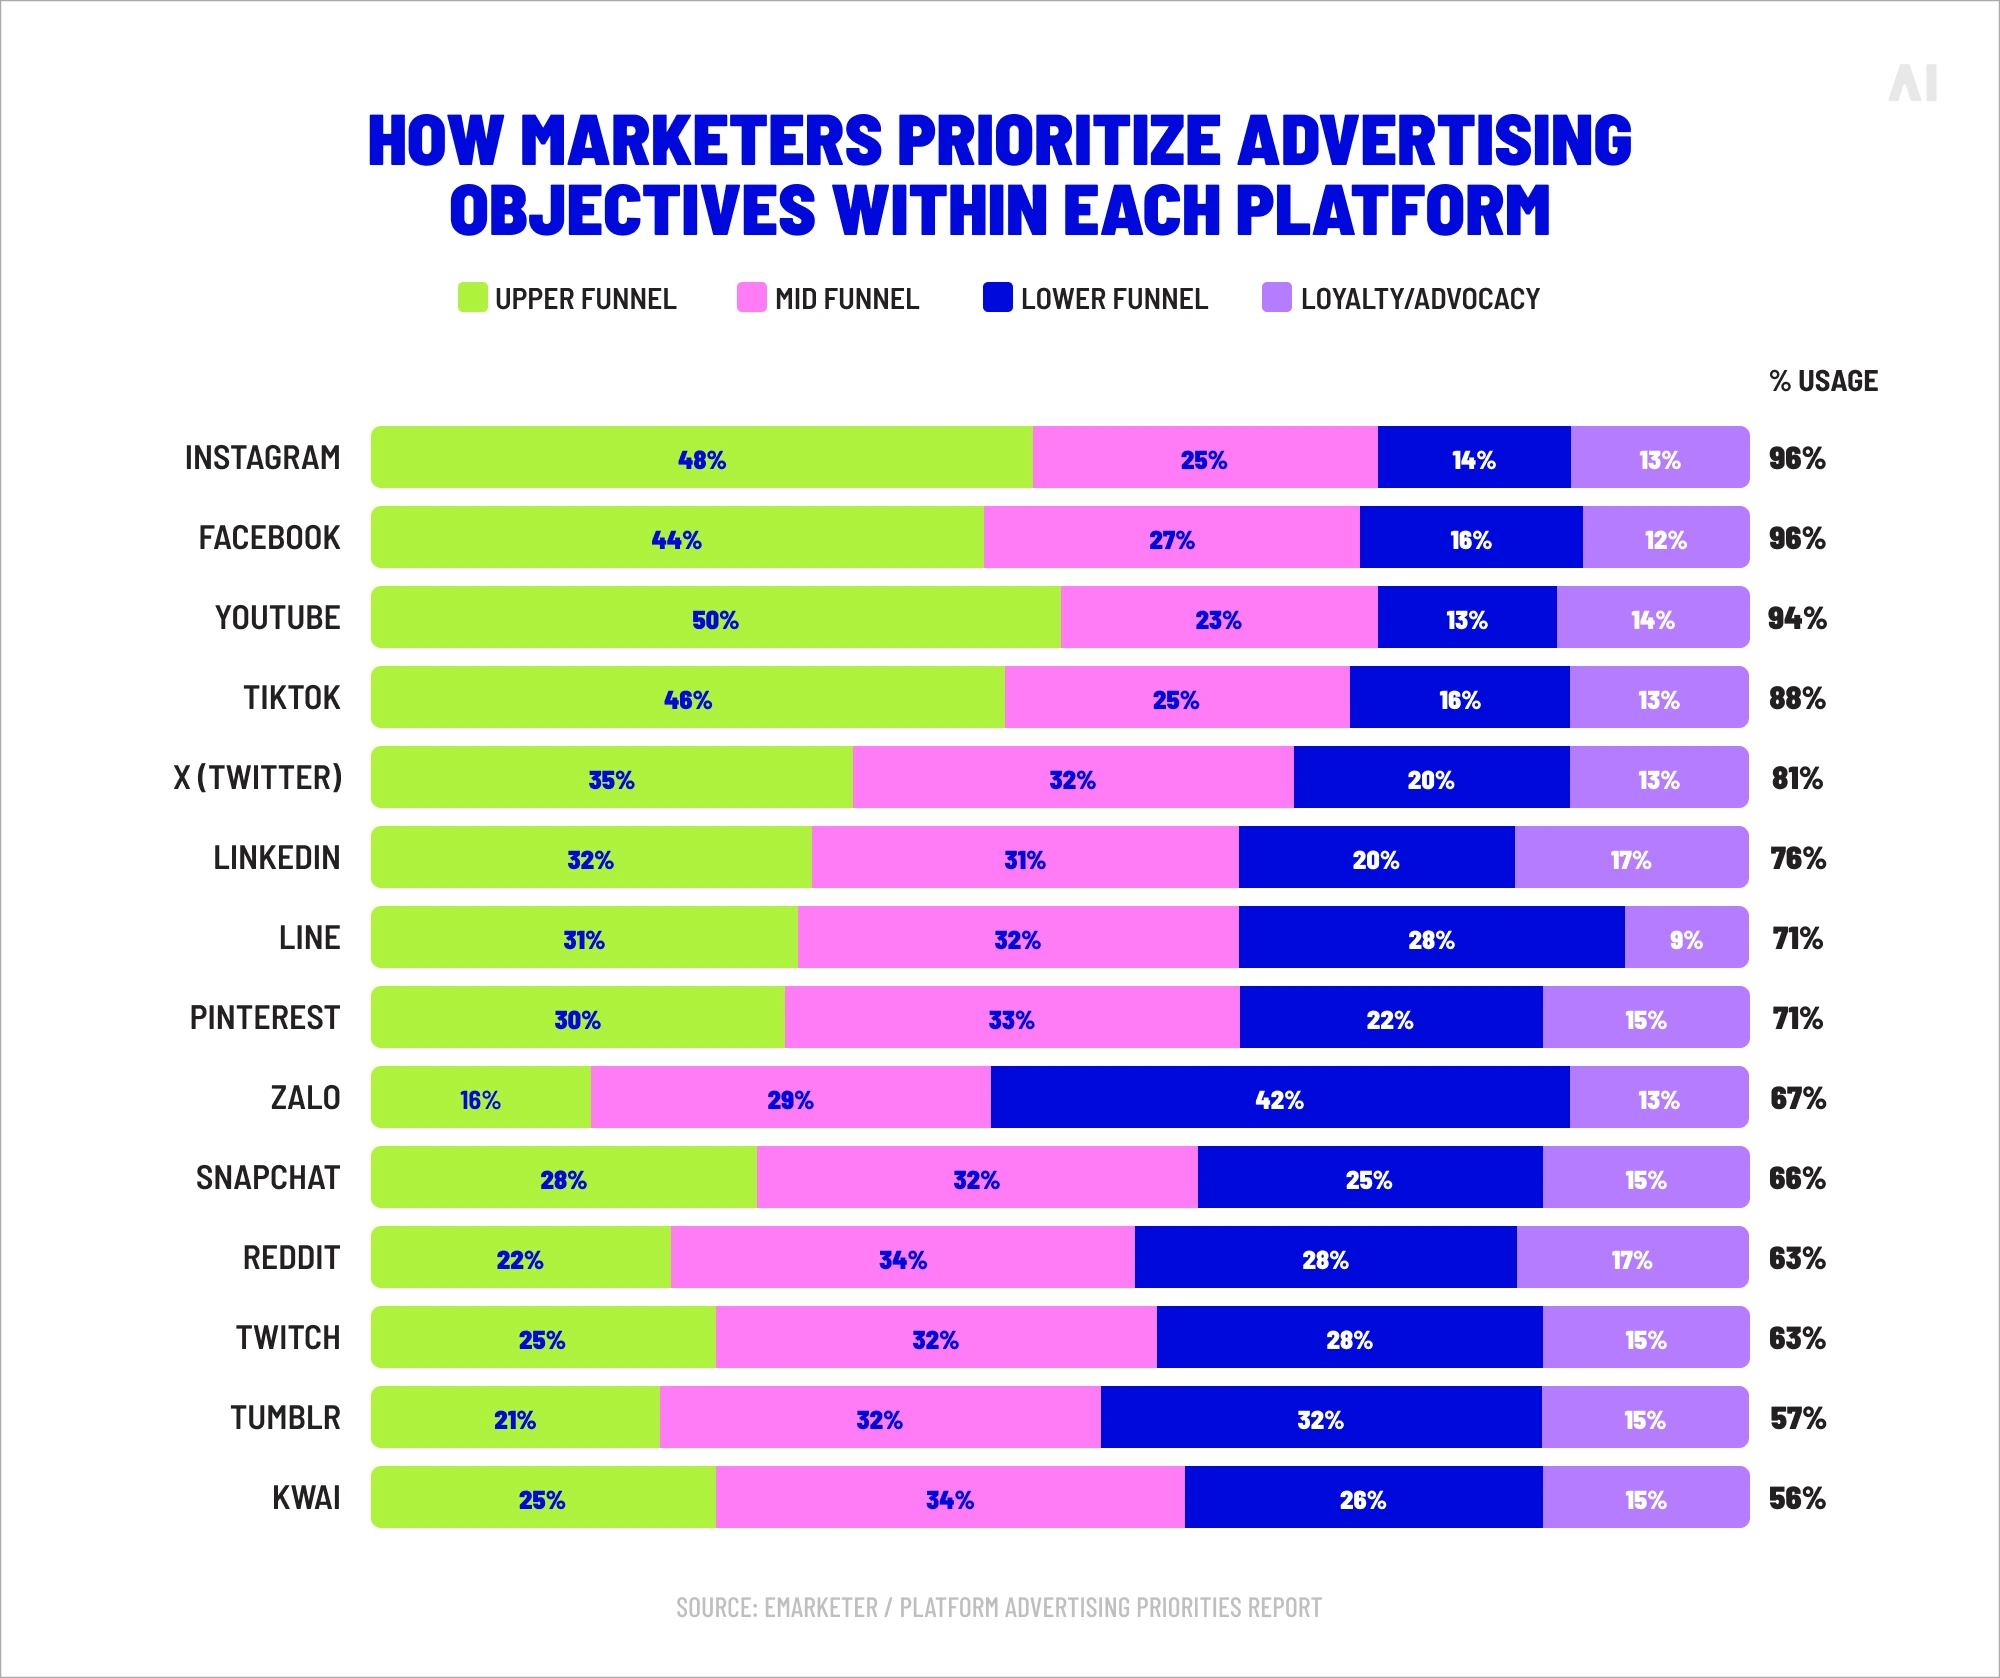
Platform fragmentation & marketers’ priorities within each platform (Source)
10 must-have display advertising KPIs in your report
These ten KPIs form the reporting baseline for any serious display ad monitoring setup. Track them consistently, compare them over time, and treat them as the lens through which optimization, budget, and creative decisions are made. Individually, each tells a partial story; together, they give leadership a defensible read on performance.
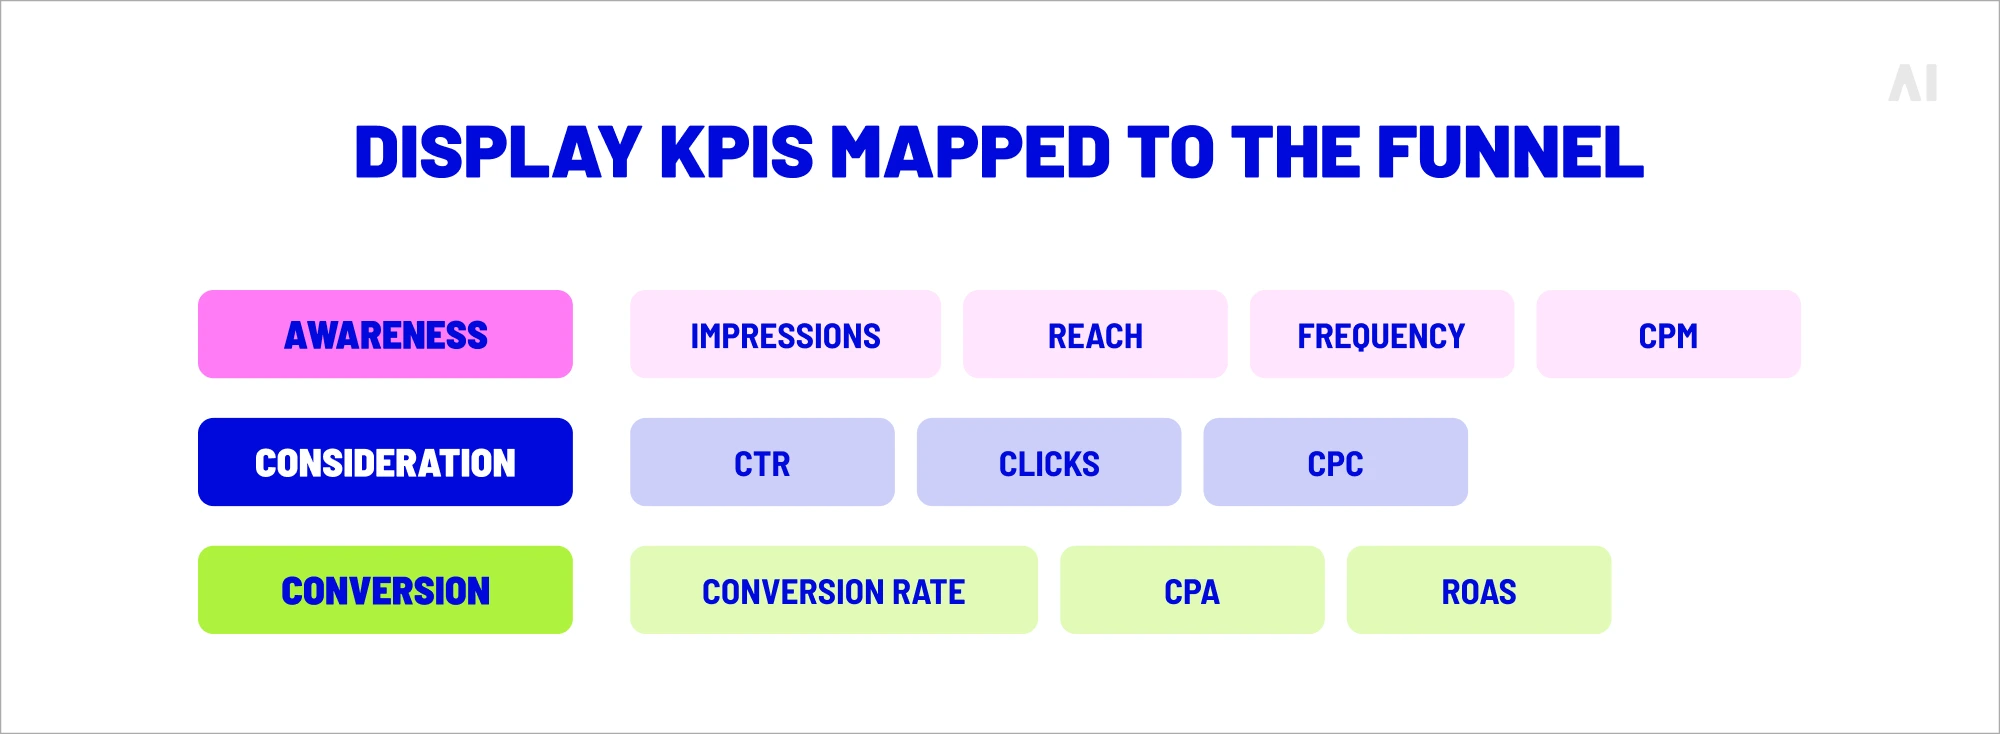
10 display KPIs mapped to the funnel
1. Impressions
Impressions count the total number of times an ad was delivered. They are the denominator for almost every other display metric and the foundational measure of campaign scale.
The caveat is that impressions count what was served, not what was seen, noticed, or remembered—which is why modern reporting separates "served" impressions from "viewable" impressions and why delivery volume alone is a poor proxy for performance.
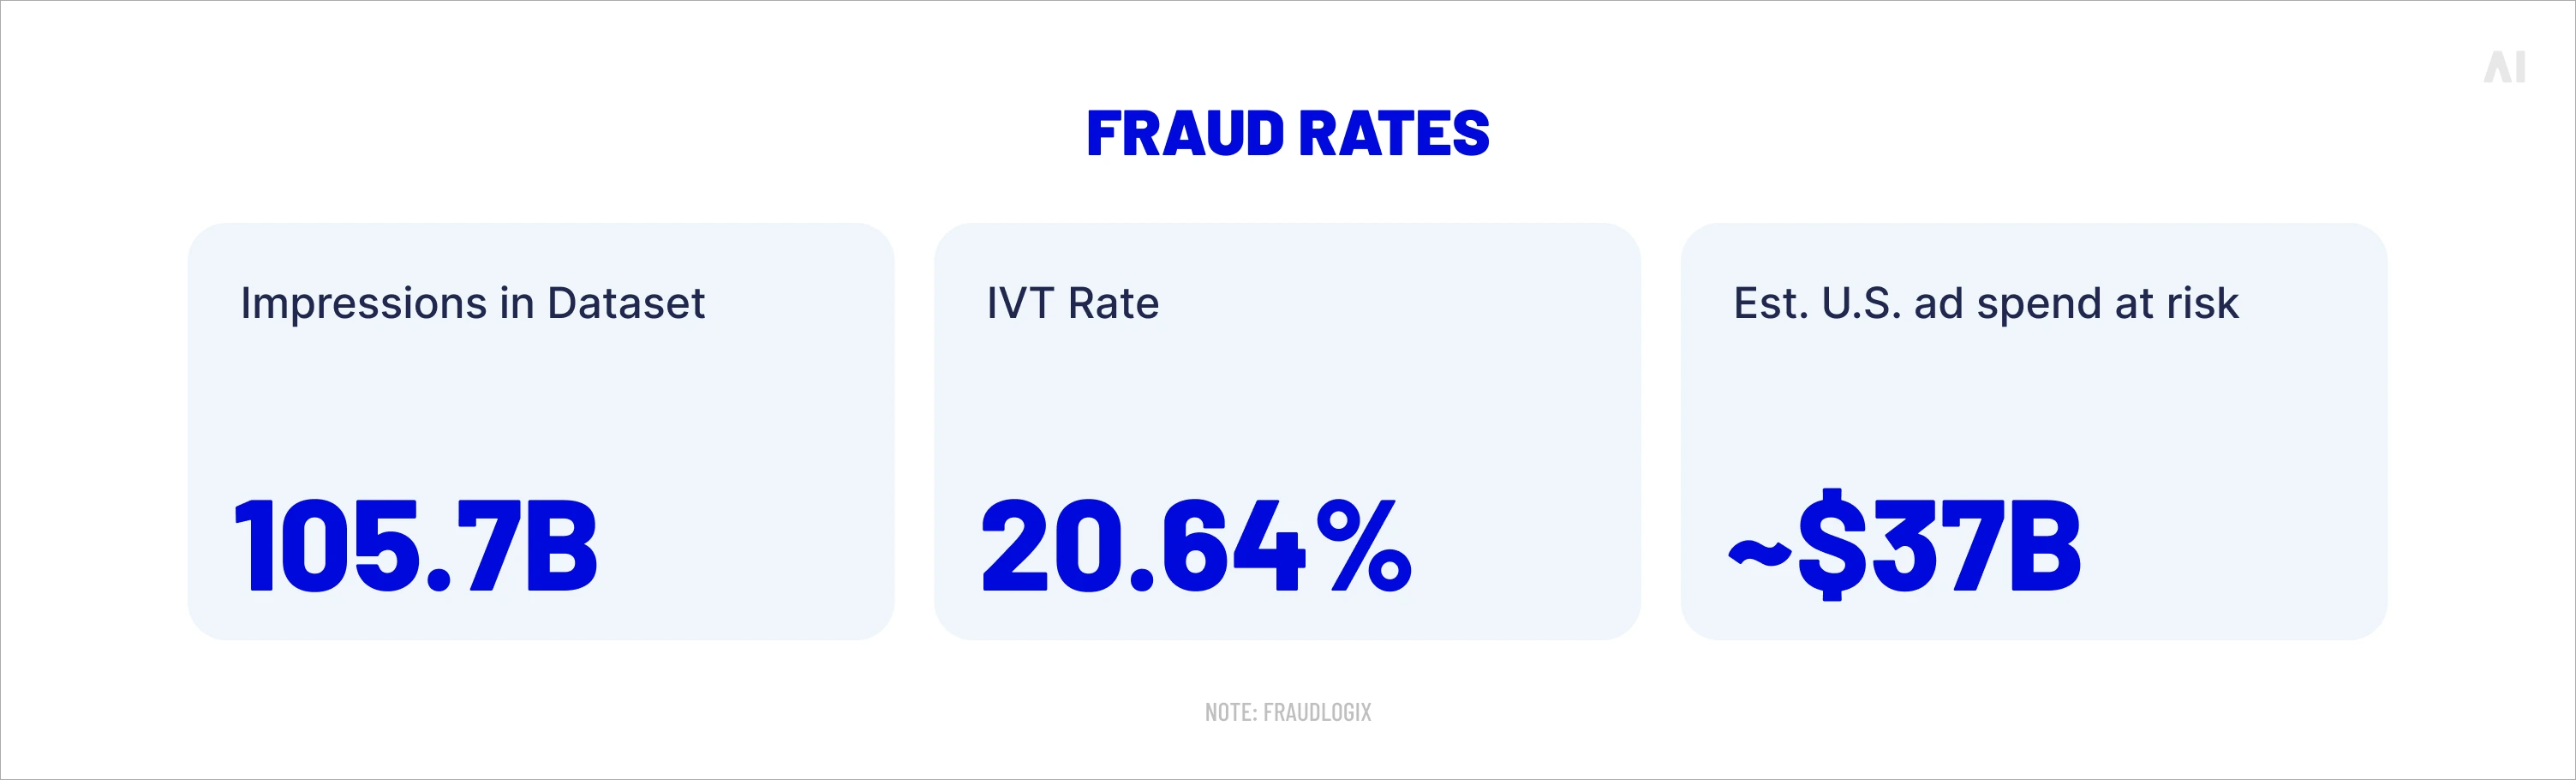
Fraudlogix analyzed 105.7 billion impressions across 2025, underlining just how large the pool of served inventory has become and how much of it needs further scrutiny before it counts as meaningful delivery.
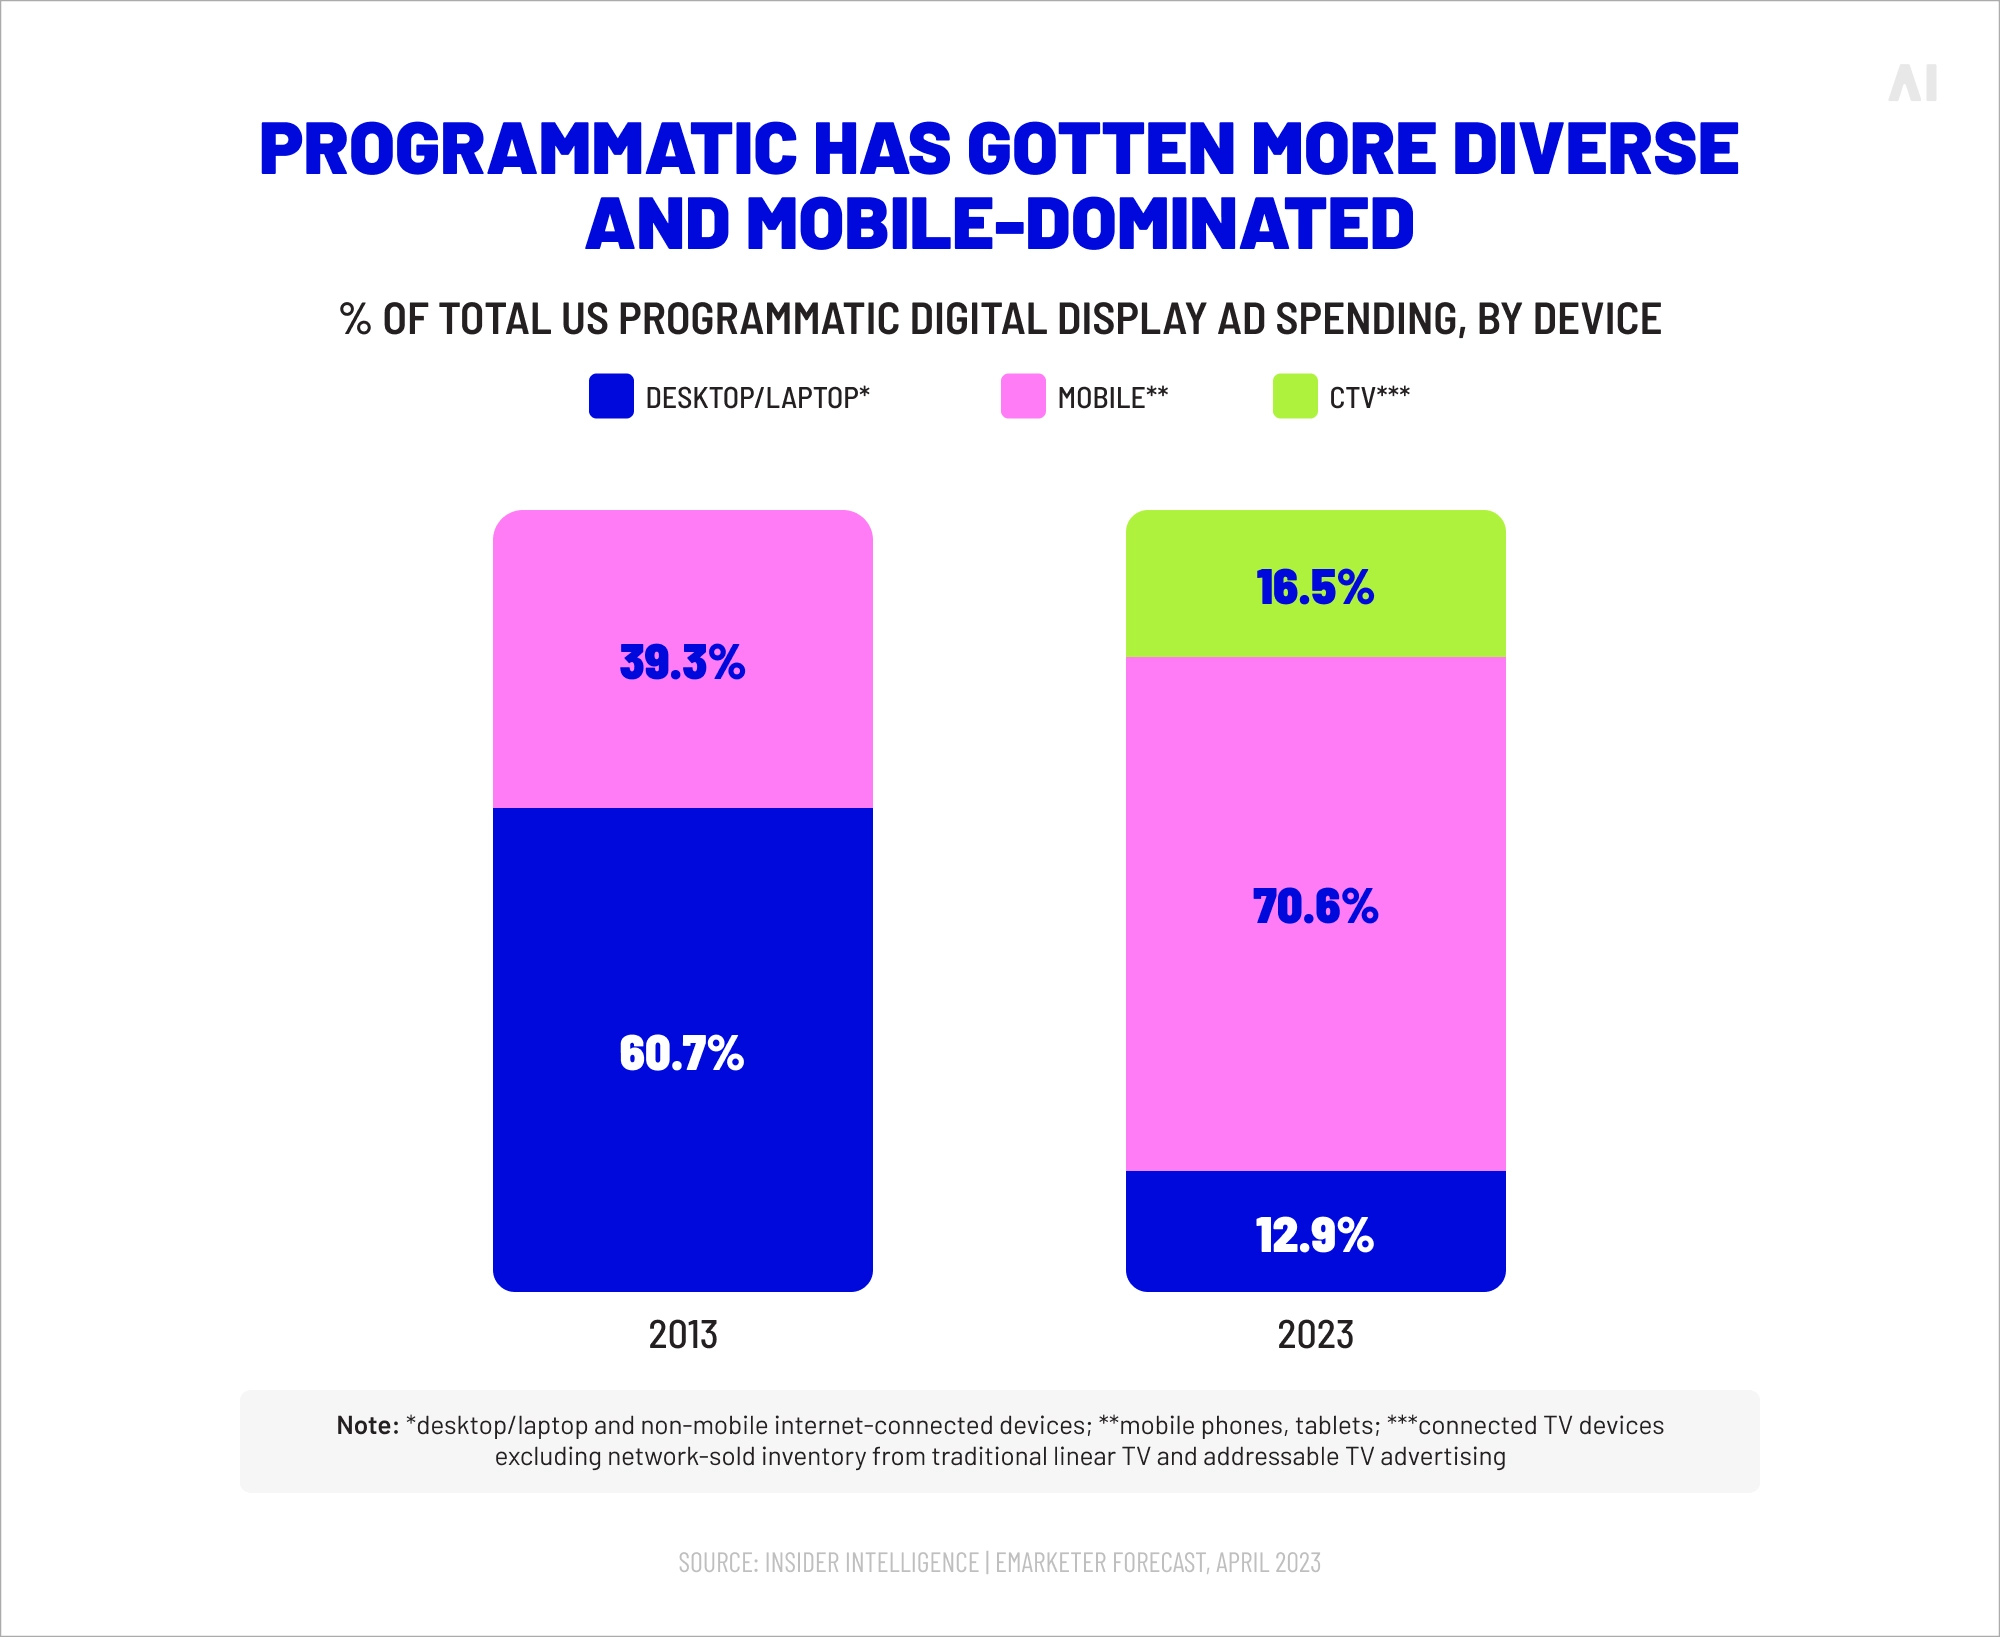
Reach measures the number of unique users exposed to a campaign, rather than the total number of exposures. Where impressions answer "how many ads were served," reach answers "how many different people saw them." For awareness-driven display buys, reach is the cleaner measure because it prevents over-credit to a small audience seeing the same ad repeatedly.
Mobile now accounts for roughly 70% of programmatic impressions globally, meaning reach planning has to be mobile-led by default—desktop-first planning leaves most of the audience uncounted.
% of total US programmatic digital display ad spending, by device (Source)
3. Frequency
Frequency is the average number of times each unique user was exposed to an ad. It's the KPI that detects saturation before it becomes fatigue. Too low, and the message doesn't stick; too high, and you're paying to annoy people who've already heard you.
Research shows higher display ad frequency is often associated with lower CTR, especially when impressions are tightly clustered, so frequency caps should be tested rather than set to a universal rule.
4. Click-through Rate (CTR)
CTR measures how effectively an ad generates engagement—clicks divided by impressions. It's one of the oldest display KPIs and remains a fast signal for creative-audience fit.
Display CTR benchmarks vary sharply by platform and industry. In Google Ads display benchmarks updated in 2025, WordStream reports an overall display CTR of 0.46%, with Real Estate at 1.08% and Technology at 0.39%. In a separate 2025 cross-campaign benchmark, Marketing LTB reports Retail & eCommerce at 0.43%, Finance & Insurance at 0.26%, Technology & SaaS at 0.34%, Healthcare at 0.31%, Travel & Hospitality at 0.52%, B2B Services at 0.22%, and Real Estate at 0.47%.
Whichever way you cut it, the conclusion is the same. A click-through rate that signals success in one vertical may signal nothing of the sort in another.
💡 For a deeper look at what drives CTR performance, see our piece on CTR for display ads.
5. Clicks
Clicks are the absolute volume of traffic a campaign generates. Where CTR tells you the rate of engagement per impression, total clicks tell you the scale of the audience the campaign is pulling into site or app experiences.
Clicks are useful for capacity planning—landing page infrastructure, retargeting pool size, attribution model inputs—but they're a weak standalone KPI because they say nothing about whether the traffic converted.
6. Cost per mille (CPM)
CPM measures the cost of buying 1,000 impressions, so it remains a core reach-efficiency metric.
One accessible 2025 benchmark compilation put average U.S. programmatic display CPM at about $3.50, while DataBeat reported display CPMs rising 6% quarter on quarter in Q3 2025 as year-end spending began to build.
Format matters: CTV typically commands a clear premium over standard display, with accessible benchmarks ranging from roughly the mid-teens or low 20s on some buys to $35–$65 for higher-premium inventory.
Video also tends to cost materially more than standard static display, while native usually sits above display but varies widely by publisher context and deal type.
In practice, CPM is most useful when read alongside viewability, attention, and other quality signals, because a cheap impression is not necessarily an effective one.
CPC measures the cost required to generate a click, so it remains a useful metric for managing traffic costs.
Reliable benchmarks vary widely by platform and format: the above-mentioned WordStream’s updated Google Ads benchmarks put average Google Display Network CPC at $0.63, while lower mobile-display ranges such as $0.05–$0.60tend to come from secondary estimate-based compilations rather than primary benchmark studies.
For CTV, CPM and view-based metrics are usually more standard than CPC, so broad ‘average CTV CPC’ claims should be treated cautiously.
In practice, CPC is most meaningful when paired with conversion rate or CPA, because a cheap click that does not convert can still be an expensive outcome.
Conversion rate measures the percentage of users who complete a desired action after clicking—such as a purchase, signup, or download.
Display conversion rates are usually well below search and vary sharply by industry: WordStream’s Google Display Network benchmark puts the overall average at 0.77%, with sector results ranging from roughly 0.4% to nearly 1.9%. That spread is driven by industry, funnel position, audience intent, and offer strength.
Conversion rate is also where a media report starts to connect more directly to business value, because it shows whether traffic turned into an outcome rather than just an interaction.
9. Cost per acquisition (CPA)
CPA is the cost required to generate a single conversion or customer and sits at the centre of any performance-focused display KPI set. Triple Whale's 2025 analysis of over 18,000 brands put median Meta CPA at $38.17, which is a useful directional benchmark for the paid social baseline; display CPAs vary more widely because display typically operates earlier in the funnel than paid social.
The critical thing to understand about CPA is that it means nothing on its own. It only matters in relation to what the customer is actually worth. A $50 acquisition cost is a bargain if the lifetime value is $600. It is alarming if the gross margin is $30.
10. Return on Ad Spend (ROAS)
Advanced display advertising metrics for insights
The ten baseline KPIs answer "what happened." The advanced layer answers a harder question: "did the ad actually land, and what role did it play in the broader buyer journey?" Teams operating at this layer are the ones whose reports hold up under CFO scrutiny.
Viewability and attention
Viewability measures whether an ad had the opportunity to be seen. The MRC standard remains50% of pixels visible for one continuous second for display, and two continuous seconds for video. Benchmarks often land in the mid-60s to low-70s, though they vary sharply by format, device, and environment. Video typically benchmarks higher: IAS reported global desktop video viewability at 83.9%, while U.S. mobile web video reached 79.4%. As a rule, 70% is better treated as a quality threshold or planning target than as a universal benchmark across all display inventory.
Viewability is necessary but no longer sufficient. InNovember 2025, the IAB and MRC released finalized Attention Measurement Guidelines, developed with input from more than 200 experts across brands, agencies, publishers, and measurement companies—the industry's first standardized framework for evaluating attention across vendors. The guidelines codify what leading measurement firms have been arguing for years: an ad that's technically visible isn't necessarily an ad that's seen.
Lumen Research found that only 30% of viewable digital ads are actually looked at, meaning roughly 70% of ad spend goes to impressions that render but capture no real attention.
The practical implication is that viewability should now be treated as a quality gate. Attention metrics—time-in-view, eye-tracked dwell, attention-adjusted CPM—are the performance layer.
DoubleVerify holds the only MRC-accredited attention methodology as of late 2025, with Integral Ad Science's audit in progress.
Post-view impact
Display advertising often influences conversions in ways click data alone cannot capture. View-through conversions track users who saw an ad, did not click, and later completed a conversion, while Google Ads attribution reports also distinguish between last-click conversions and assisted conversions across the path to purchase.
ROAS measures the revenue generated for every dollar of ad spend and is a core profitability metric in performance advertising. In Triple Whale’s 2025 Google Ads benchmark cited above, median Google Ads ROAS was3.68. A separate 2025 benchmark from Focus Digital puts Search campaign median ROAS at 5.17:1. Because those figures come from different datasets and scopes, they should be treated as directional benchmarks rather than a single market average.
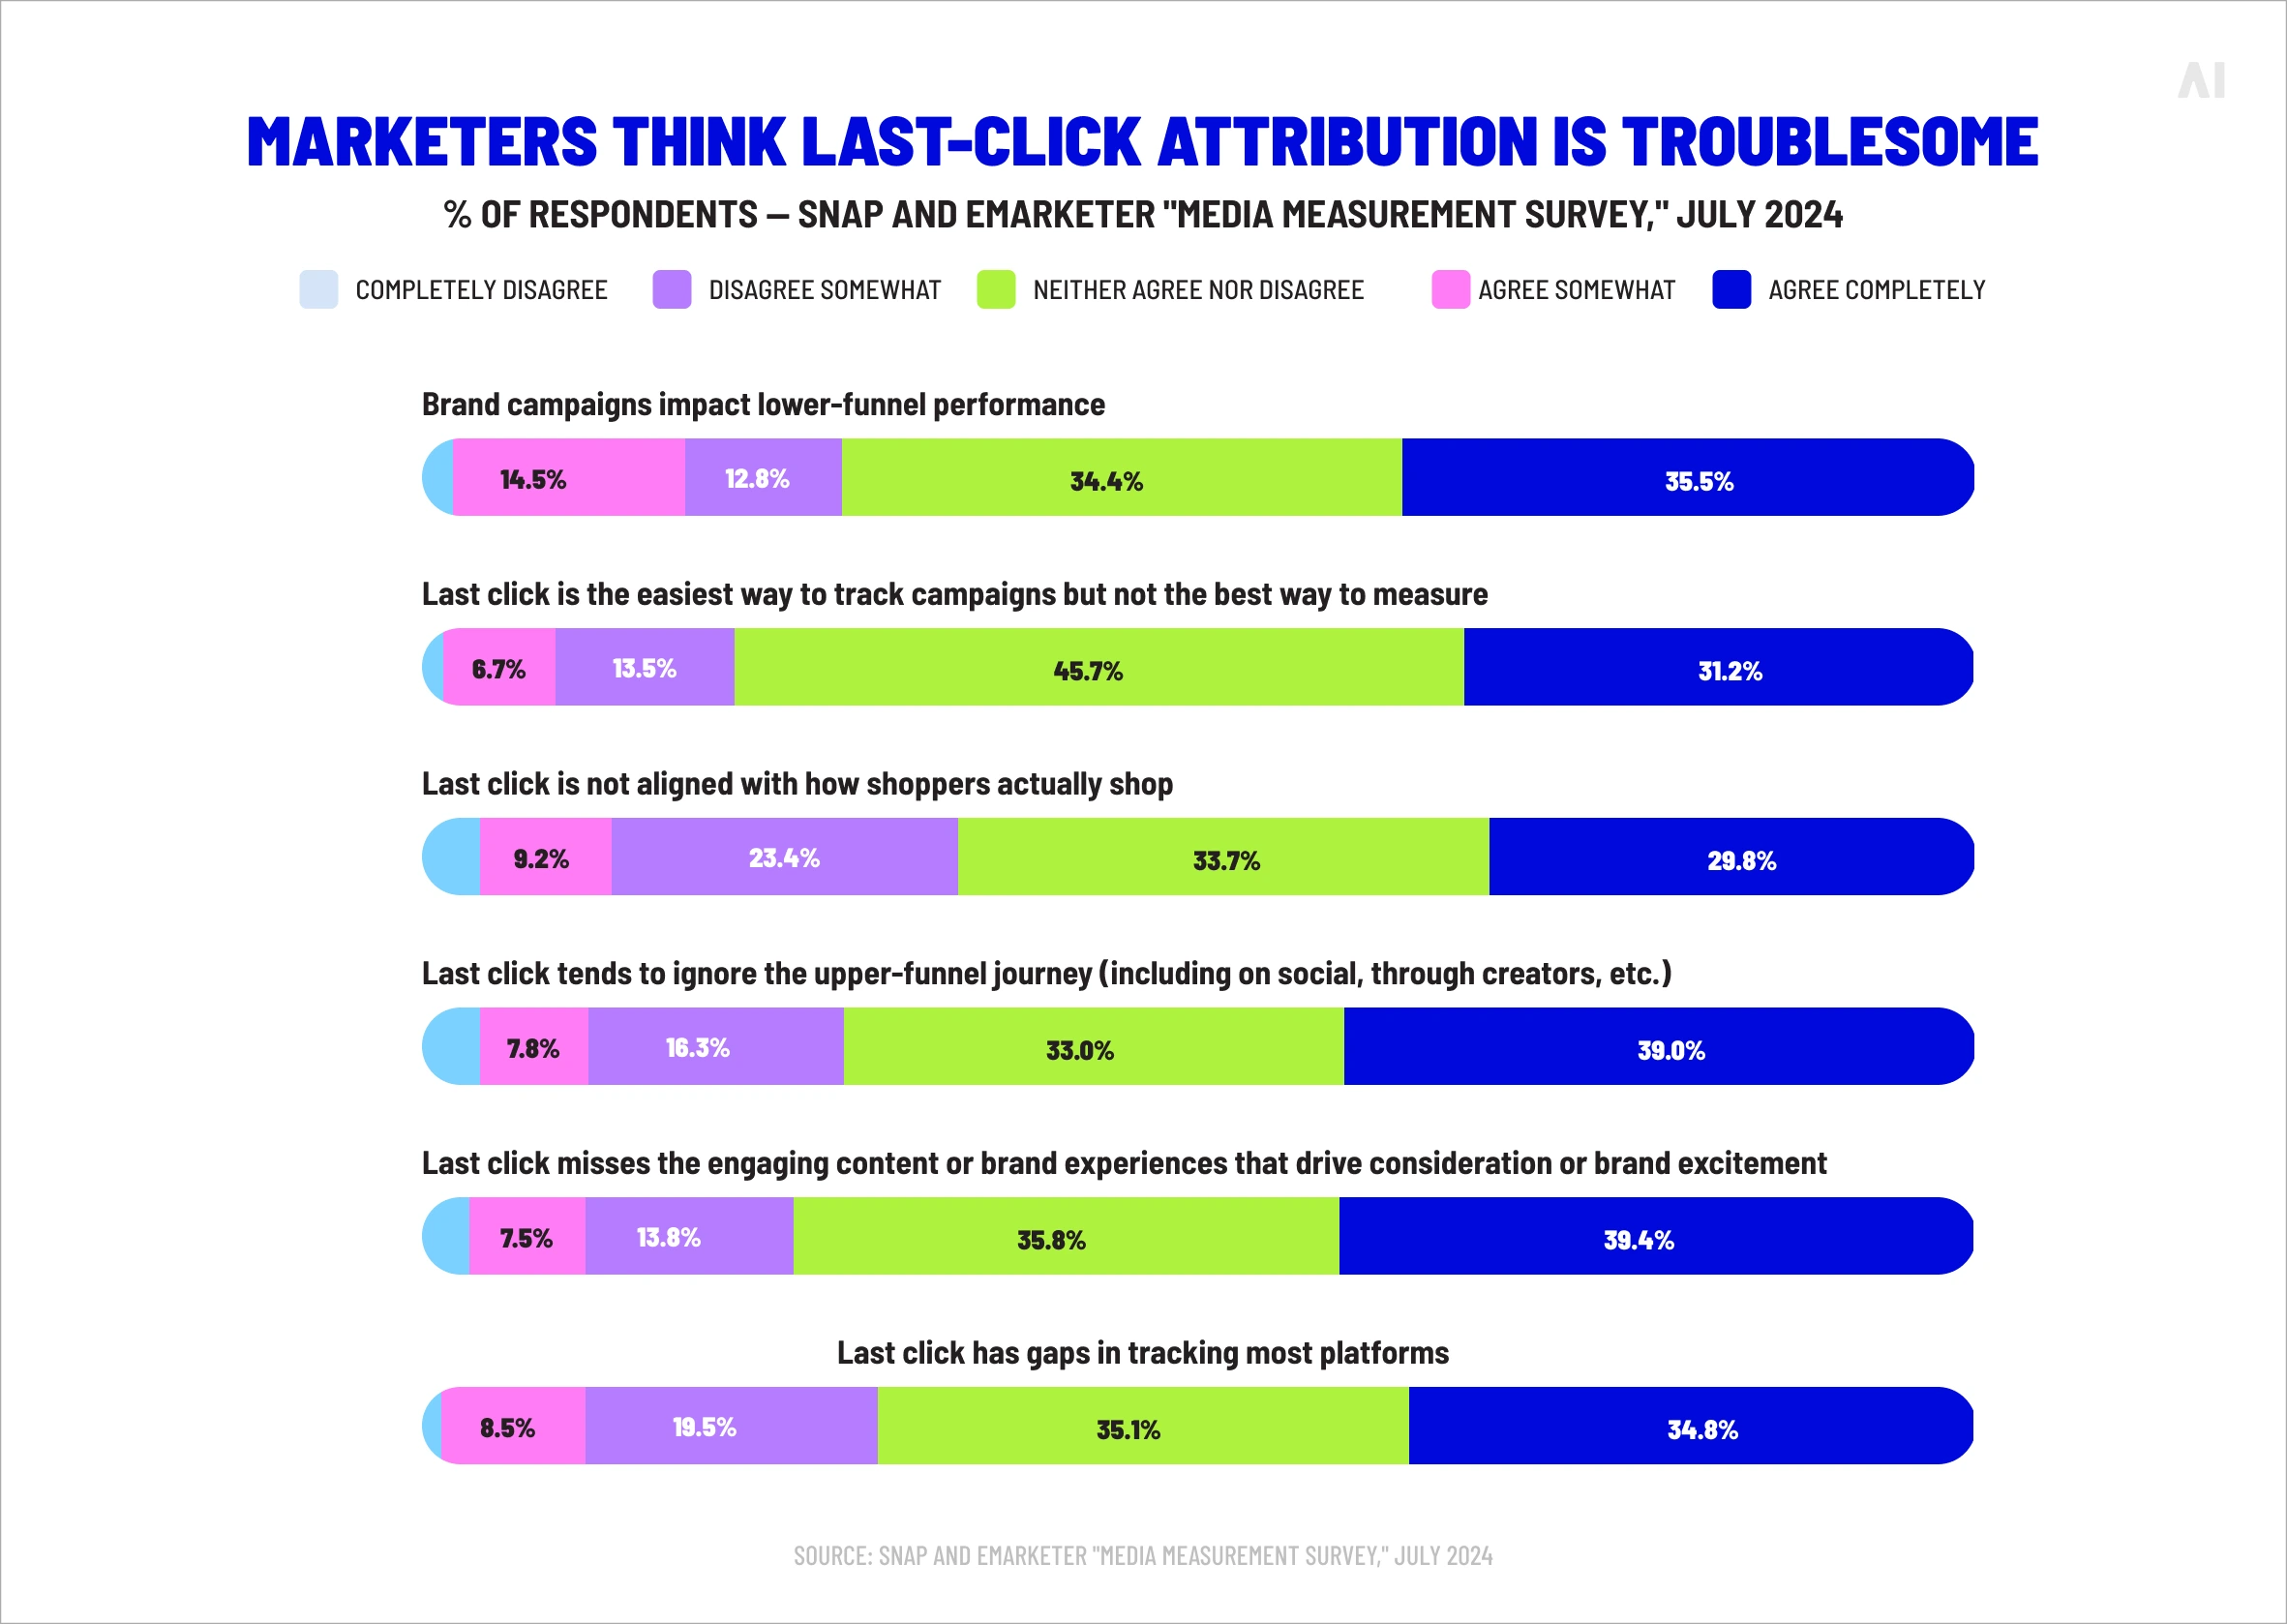
That matters because last-click reporting tends to miss upper-funnel influence: in Snap and EMARKETER’s media measurement survey, 72.0% of marketers said last-click ignores the upper-funnel journey, and 69.9% said brand campaigns affect lower-funnel performance in ways last-click does not represent well.
Used carefully, post-view and assist data do not just help defend display spend—they give a more accurate picture of how channels work together and reduce the risk of shifting budget too heavily toward whichever touchpoint happened to close the sale.
Creative and audience performance
Breaking results down by creative variant and audience segment is where display KPIs turn into real optimization decisions.
The broader evidence supports that personalized creative and stronger audience data can materially improve performance: Bannerflow’s platform analysis found feed-based display ads outperform non-feed ads, with the financial-services gap reaching 117.5%, while first-party data can also strengthen targeting by poweringlookalike audiences and more relevant creative activation.
That does not mean one universal lift applies everywhere. It means campaign averages hide meaningful differences, so creative and audience performance should be reviewed separately rather than rolled into a single top-line CTR.
How to turn display advertising KPIs into decisions
Numbers that don't change behaviour aren't really KPIs—they're trivia. Three habits separate teams that act on their display ad metrics from teams that just report them.
1. Combine ad metrics
Single metrics lie; metric pairs tell the truth:
CTR on its own tells you people clicked—pair it with conversion rate and you'll see whether the landing page is holding up its end of the deal.
CPM on its own tells you what you paid for reach—pair it with viewability and attention and you'll see whether the reach was real.
ROAS on its own tells you the revenue ratio—pair it with CPA and order value and you'll see whether the pattern scales.
The habit is simple: never make an optimization decision from a single number when a second number is one query away.
The biggest gains in display advertising often come from cutting waste rather than adding spend.
Vendor datasets differ, but they point in the same direction. Lunio’s 2026 Global Invalid Traffic Report, based on 2.7 billion clicks across six ad platforms, eight industries, and ten countries, estimated that $63 billion in ad spend was lost to invalid traffic in 2025.
Fraudlogix, analyzing 105.7 billion ad impressions collected through 2025, reported a 20.64% global invalid-traffic rate and estimated that roughly $37 billion in annual U.S. programmatic ad spend was associated with invalid traffic.
On the MFA side, the cleanest Pixalate benchmark is different from the one above: its Q2 2025 report says10% of global open-programmatic web ad spend—about $716 million—went to websites it classified as made for advertising.
The precise totals vary by methodology, but the strategic point is consistent: reducing invalid traffic and low-value inventory can improve working media efficiency before spend increases at all.
KPIs catch these inefficiencies when you know what to look for: unusually high CTR with collapsing conversion rate, viewability anomalies, frequency distributions skewed by bot activity, sudden CPM drops that look like bargains and turn out to be MFA inventory. Reports that only track top-line numbers never surface these patterns.
3. Prioritize optimization actions
Once inefficiencies are identified, KPI analysis helps show where to act first. A common example is the trade-off between private marketplace and open-exchange inventory.
PMPs usually carry a higher CPM because they offer more controlled access to premium inventory, better brand safety, greater transparency, and often stronger audience quality than the open market.
That means a report focused only on CPM may flag PMP inventory as expensive, while a report that also includes viewability, attention, fraud risk, and conversion performance may show it delivering better overall efficiency.
In other words, the optimization priority can change once media cost is evaluated alongside media quality.
A dashboard is only useful if it changes what someone does on Monday morning. Three principles separate working dashboards from wallpaper.
Structure KPIs for clarity and action
Separate decision-making KPIs from diagnostic ones, and group them by funnel stage. The headline view should fit on one screen and sit at 5–7 core metrics—enough to cover scale, efficiency, and outcome, not enough to drown the reader. Everything else belongs in drill-downs, not on the landing page. If every KPI is a headline, nothing is.
Focus on trends, not snapshots
Single-day numbers mean almost nothing in display. What matters is direction—are CPMs trending up, is viewability holding steady, is conversion rate widening or narrowing against benchmark? The case for trend-based reporting has only strengthened as the measurement environment has become more volatile.
Google reversed course on third-party cookie deprecation in April 2025, opting to leave cookies enabled by default in Chrome rather than forcing a deprecation prompt. Then in October 2025, Google retired a large set of Privacy Sandbox APIs, ending the push for a single Chrome-led replacement. The net effect is that measurement and targeting now span legacy cookies, modelled signals, and fragmented server-side solutions—a picture where any given day's number is shaped as much by measurement methodology shifts as by actual performance. Direction over time is the only honest read.
Reinforcing the shift,71% of publishers recognized first-party data as a key source of positive advertising results in Q1 2025, with 85% expecting its monetization role to grow further in 2026—meaning the data inputs behind dashboards are themselves in motion.
Connect data across campaigns and inventory
Siloed reporting breaks the whole exercise. If each DSP, SSP, and publisher sits in its own tab, patterns don't surface and cross-campaign insights get lost. Unified reporting is where AI Digital's Elevate platform fits.
Elevate's Standard and Advanced Reporting modules bring core KPIs together with custom breakdowns by publisher, geo, and audience, delivering 98% less time to build reports and 100% tool cost reduction compared with multi-vendor reporting stacks.
The Marketing Mix Modeling module delivers a statistically sound view of cross-channel impact, with measured uplift of +5–20% in client retention for teams using it.
Path to Conversion maps the full customer journey beyond last-click, with 3× better conversion-rate optimization.
On the inventory side, Smart Supply gives dashboards what they need at the source: direct relationships with 9+ top-tier SSPs ensuring 99.9% premium inventory coverage, AI-powered filtering that removes low-quality and non-brand-safe traffic before it reaches campaigns, and full transparency into placement, pricing, and performance. A dashboard is only as reliable as the inventory data feeding it—Smart Supply removes the noise at the layer where it originates.
⚡ A dashboard should make the next decision obvious. If it doesn't, it's a report.
Most of what goes wrong in display reporting comes down to five recurring patterns.
The first is optimizing for CTR instead of revenue.Triple Whale's analysis found CTR improved across all 14 tracked industries in 2025—yet ROAS declined across 13 of the 14. Rising CTR with falling ROAS is a textbook signal of misaligned optimization, not improving creative. When teams chase clicks without checking downstream conversion and revenue, they scale the wrong thing.
The second is ignoring post-view impact. Last-click models credit the final touchpoint and erase everything that preceded it, systematically undervaluing display's role and misdirecting budget toward bottom-funnel channels that are, in reality, closing demand the upper funnel generated.
The third is tracking too many metrics. More KPIs don't produce more clarity—they produce noise.IAB data showed47% of US buy-side decision-makers expected their organizations to focus more on attention metrics in 2025, which is the right direction, but only if attention replaces lower-value metrics rather than stacking on top of them. Dashboards that accumulate KPIs without retiring them end up obscuring the signals that matter.
The fourth is inconsistent attribution. Applying different attribution models across campaigns, channels, or reporting periods produces numbers that can't be compared to one another. Cross-campaign learnings evaporate, and optimization decisions rest on unreliable foundations.
The fifth is treating all campaigns uniformly. Brand campaigns, retargeting, and lower-funnel performance buys require different KPI weightings. Holding an awareness campaign to a direct-response ROAS benchmark is as misguided as holding a performance campaign to a reach target. Segmenting the KPI framework by campaign intent is one of the highest-leverage fixes most reporting setups can make.
{{26-Display-Advertising-KPIs-1="/tables"}}
💡 For a deeper look at attribution modelling specifically, see our piece on multi-touch attribution.
Conclusion: Focus on kpis that drive business outcomes
There is a reliable dividing line between the teams that do well at this and the teams that do not. On one side are those who treat display KPIs as a strategic lever—a tool for making better decisions in something close to real time. On the other are those who treat the dashboard as a compliance exercise, something to be glanced at, screenshot, and forwarded. The first group, consistently, outperforms the second.
The core principles are straightforward:
Prioritize revenue-focused KPIs like ROAS and CPA over vanity metrics like CTR
Align KPIs with business goals and funnel stages to ensure relevance
Keep reporting focused on a small, actionable set of metrics
Account for post-view and cross-channel impact to capture true performance
Use KPI insights to continuously optimize targeting, creative, and budget allocation
Getting from principle to practice takes the right framework, the right technology, and the right inventory foundation. AI Digital brings all three: the Open Garden framework for cross-platform visibility, Elevate for unified intelligence and reporting, and Smart Supply for premium, transparent inventory curation. If your display reports are telling you what happened without telling you what to do next, we'd welcome the conversation. Get in touch.
Blind spot
Key issues
Business impact
AI Digital solution
Lack of transparency in AI models
• Platforms own AI models and train on proprietary data • Brands have little visibility into decision-making • "Walled gardens" restrict data access
• Inefficient ad spend • Limited strategic control • Eroded consumer trust • Potential budget mismanagement
Open Garden framework providing: • Complete transparency • DSP-agnostic execution • Cross-platform data & insights
Optimizing ads vs. optimizing impact
• AI excels at short-term metrics but may struggle with brand building • Consumers can detect AI-generated content • Efficiency might come at cost of authenticity
• Short-term gains at expense of brand health • Potential loss of authentic connection • Reduced effectiveness in storytelling
Smart Supply offering: • Human oversight of AI recommendations • Custom KPI alignment beyond clicks • Brand-safe inventory verification
The illusion of personalization
• Segment optimization rebranded as personalization • First-party data infrastructure challenges • Personalization vs. surveillance concerns
• Potential mismatch between promise and reality • Privacy concerns affecting consumer trust • Cost barriers for smaller businesses
Elevate platform features: • Real-time AI + human intelligence • First-party data activation • Ethical personalization strategies
AI-Driven efficiency vs. decision-making
• AI shifting from tool to decision-maker • Black box optimization like Google Performance Max • Human oversight limitations
• Strategic control loss • Difficulty questioning AI outputs • Inability to measure granular impact • Potential brand damage from mistakes
Managed Service with: • Human strategists overseeing AI • Custom KPI optimization • Complete campaign transparency
Fig. 1. Summary of AI blind spots in advertising
Dimension
Walled garden advantage
Walled garden limitation
Strategic impact
Audience access
Massive, engaged user bases
Limited visibility beyond platform
Reach without understanding
Data control
Sophisticated targeting tools
Data remains siloed within platform
Fragmented customer view
Measurement
Detailed in-platform metrics
Inconsistent cross-platform standards
Difficult performance comparison
Intelligence
Platform-specific insights
Limited data portability
Restricted strategic learning
Optimization
Powerful automated tools
Black-box algorithms
Reduced marketer control
Fig. 2. Strategic trade-offs in walled garden advertising.
Core issue
Platform priority
Walled garden limitation
Real-world example
Attribution opacity
Claiming maximum credit for conversions
Limited visibility into true conversion paths
Meta and TikTok's conflicting attribution models after iOS privacy updates
Data restrictions
Maintaining proprietary data control
Inability to combine platform data with other sources
Amazon DSP's limitations on detailed performance data exports
Cross-channel blindspots
Keeping advertisers within ecosystem
Fragmented view of customer journey
YouTube/DV360 campaigns lacking integration with non-Google platforms
Black box algorithms
Optimizing for platform revenue
Reduced control over campaign execution
Self-serve platforms using opaque ML models with little advertiser input
Performance reporting
Presenting platform in best light
Discrepancies between platform-reported and independently measured results
Consistently higher performance metrics in platform reports vs. third-party measurement
Fig. 1. The Walled garden misalignment: Platform interests vs. advertiser needs.
Key dimension
Challenge
Strategic imperative
ROAS volatility
Softer returns across digital channels
Shift from soft KPIs to measurable revenue impact
Media planning
Static plans no longer effective
Develop agile, modular approaches adaptable to changing conditions
Brand/performance
Traditional division dissolving
Create full-funnel strategies balancing long-term equity with short-term conversion
Capability
Key features
Benefits
Performance data
Elevate forecasting tool
• Vertical-specific insights • Historical data from past economic turbulence • "Cascade planning" functionality • Real-time adaptation
• Provides agility to adjust campaign strategy based on performance • Shows which media channels work best to drive efficient and effective performance • Confident budget reallocation • Reduces reaction time to market shifts
• Dataset from 10,000+ campaigns • Cuts response time from weeks to minutes
• Reaches people most likely to buy • Avoids wasted impressions and budgets on poor-performing placements • Context-aligned messaging
• 25+ billion bid requests analyzed daily • 18% improvement in working media efficiency • 26% increase in engagement during recessions
Full-funnel accountability
• Links awareness campaigns to lower funnel outcomes • Tests if ads actually drive new business • Measures brand perception changes • "Ask Elevate" AI Chat Assistant
• Upper-funnel to outcome connection • Sentiment shift tracking • Personalized messaging • Helps balance immediate sales vs. long-term brand building
• Natural language data queries • True business impact measurement
Open Garden approach
• Cross-platform and channel planning • Not locked into specific platforms • Unified cross-platform reach • Shows exactly where money is spent
• Reduces complexity across channels • Performance-based ad placement • Rapid budget reallocation • Eliminates platform-specific commitments and provides platform-based optimization and agility
• Coverage across all inventory sources • Provides full visibility into spending • Avoids the inability to pivot across platform as you’re not in a singular platform
Fig. 1. How AI Digital helps during economic uncertainty.
Trend
What it means for marketers
Supply & demand lines are blurring
Platforms from Google (P-Max) to Microsoft are merging optimization and inventory in one opaque box. Expect more bundled “best available” media where the algorithm, not the trader, decides channel and publisher mix.
Walled gardens get taller
Microsoft’s O&O set now spans Bing, Xbox, Outlook, Edge and LinkedIn, which just launched revenue-sharing video programs to lure creators and ad dollars. (Business Insider)
Retail & commerce media shape strategy
Microsoft’s Curate lets retailers and data owners package first-party segments, an echo of Amazon’s and Walmart’s approaches. Agencies must master seller-defined audiences as well as buyer-side tactics.
AI oversight becomes critical
Closed AI bidding means fewer levers for traders. Independent verification, incrementality testing and commercial guardrails rise in importance.
Fig. 1. Platform trends and their implications.
Metric
Connected TV (CTV)
Linear TV
Video Completion Rate
94.5%
70%
Purchase Rate After Ad
23%
12%
Ad Attention Rate
57% (prefer CTV ads)
54.5%
Viewer Reach (U.S.)
85% of households
228 million viewers
Retail Media Trends 2025
Access Complete consumer behaviour analyses and competitor benchmarks.
Identify and categorize audience groups based on behaviors, preferences, and characteristics
Michaels Stores: Implemented a genAI platform that increased email personalization from 20% to 95%, leading to a 41% boost in SMS click through rates and a 25% increase in engagement.
Estée Lauder: Partnered with Google Cloud to leverage genAI technologies for real-time consumer feedback monitoring and analyzing consumer sentiment across various channels.
High
Medium
Automated ad campaigns
Automate ad creation, placement, and optimization across various platforms
Showmax: Partnered with AI firms toautomate ad creation and testing, reducing production time by 70% while streamlining their quality assurance process.
Headway: Employed AI tools for ad creation and optimization, boosting performance by 40% and reaching 3.3 billion impressions while incorporating AI-generated content in 20% of their paid campaigns.
High
High
Brand sentiment tracking
Monitor and analyze public opinion about a brand across multiple channels in real time
L’Oréal: Analyzed millions of online comments, images, and videos to identify potential product innovation opportunities, effectively tracking brand sentiment and consumer trends.
Kellogg Company: Used AI to scan trending recipes featuring cereal, leveraging this data to launch targeted social campaigns that capitalize on positive brand sentiment and culinary trends.
High
Low
Campaign strategy optimization
Analyze data to predict optimal campaign approaches, channels, and timing
DoorDash: Leveraged Google’s AI-powered Demand Gen tool, which boosted its conversion rate by 15 times and improved cost per action efficiency by 50% compared with previous campaigns.
Kitsch: Employed Meta’s Advantage+ shopping campaigns with AI-powered tools to optimize campaigns, identifying and delivering top-performing ads to high-value consumers.
High
High
Content strategy
Generate content ideas, predict performance, and optimize distribution strategies
JPMorgan Chase: Collaborated with Persado to develop LLMs for marketing copy, achieving up to 450% higher clickthrough rates compared with human-written ads in pilot tests.
Hotel Chocolat: Employed genAI for concept development and production of its Velvetiser TV ad, which earned the highest-ever System1 score for adomestic appliance commercial.
High
High
Personalization strategy development
Create tailored messaging and experiences for consumers at scale
Stitch Fix: Uses genAI to help stylists interpret customer feedback and provide product recommendations, effectively personalizing shopping experiences.
Instacart: Uses genAI to offer customers personalized recipes, mealplanning ideas, and shopping lists based on individual preferences and habits.
Medium
Medium
Share article
Url copied to clipboard
No items found.
Subscribe to our Newsletter
THANK YOU FOR YOUR SUBSCRIPTION
Oops! Something went wrong while submitting the form.
Questions? We have answers
Which display advertising KPIs should I include in my reports?
The ten baseline KPIs covered earlier—impressions, reach, frequency, CTR, clicks, CPM, CPC, conversion rate, CPA, and ROAS—form the minimum viable reporting set. Supplement with two or three advanced metrics (viewability, attention, and post-view contribution) weighted to your funnel position. Anything beyond that belongs in diagnostic drill-downs rather than the headline view.
What is the difference between display ad metrics and KPIs?
Metrics measure activity; KPIs measure progress against business goals. Every KPI is a metric, but not every metric rises to the level of a KPI. Impressions are a metric. Impressions measured against a reach target tied to a revenue objective become a KPI. The distinction matters because metrics describe the campaign, while KPIs describe whether the campaign is working.
How do I choose the right display ad metrics for my business goals?
Use the three-part framework: align the metric to the business goal, map it to the correct funnel stage, and balance leading indicators (CTR, viewability) with lagging ones (CPA, ROAS). Resist the gravitational pull of whichever metric your platform surfaces most prominently—platform defaults reflect platform priorities, not yours.
Which display advertising metrics matter most for ROI?
ROAS is the primary ROI measure, supported by CPA and conversion rate. Viewability and attention act as quality gates—an ad that isn't seen can't contribute to ROI regardless of what the platform reports. For upper-funnel campaigns, brand lift and attention-adjusted cost metrics carry more ROI weight than direct-response ratios.
How do I measure the effectiveness of display advertising campaigns?
Effectiveness is measured across three layers: media metrics (delivery, efficiency, cost), quality metrics (viewability, attention, fraud filtration), and outcome metrics (conversion, revenue, cross-channel contribution). Campaigns that look strong on one layer and weak on another usually have a diagnosable issue—and finding it is where performance improvement actually lives.
What are the most important display ad metrics for each funnel stage?
For awareness, prioritize reach, frequency, viewability, and attention. For consideration, focus on CTR, engagement depth, and view-through assists. For conversion, centre on conversion rate, CPA, and ROAS. Applying a single KPI set across all three stages is one of the most common and costly reporting mistakes.
How can I track post-view conversions in display advertising?
View-through tags capture the mechanical signal, but the real measurement work happens in your attribution framework. Multi-touch attribution models assign partial credit to view-through events; Marketing Mix Modeling estimates the aggregate contribution of display to overall revenue without depending on user-level tracking. A mature setup runs both in parallel, with MMM providing strategic direction and MTA feeding tactical optimization.
Have other questions?
If you have more questions, contact us so we can help.
.webp)
.svg)
.svg)