CTV Measurement: The Key Metrics That Will Define Successful Campaigns
Mary Gabrielyan
January 15, 2026
12
minutes read
CTV measurement sits at the center of modern streaming buys, because it’s the difference between a campaign that simply delivers impressions and one that proves real business impact. In this article, we’ll break down how CTV measurement works, why it gets messy in the real world, and which metrics and frameworks help you measure outcomes with confidence.
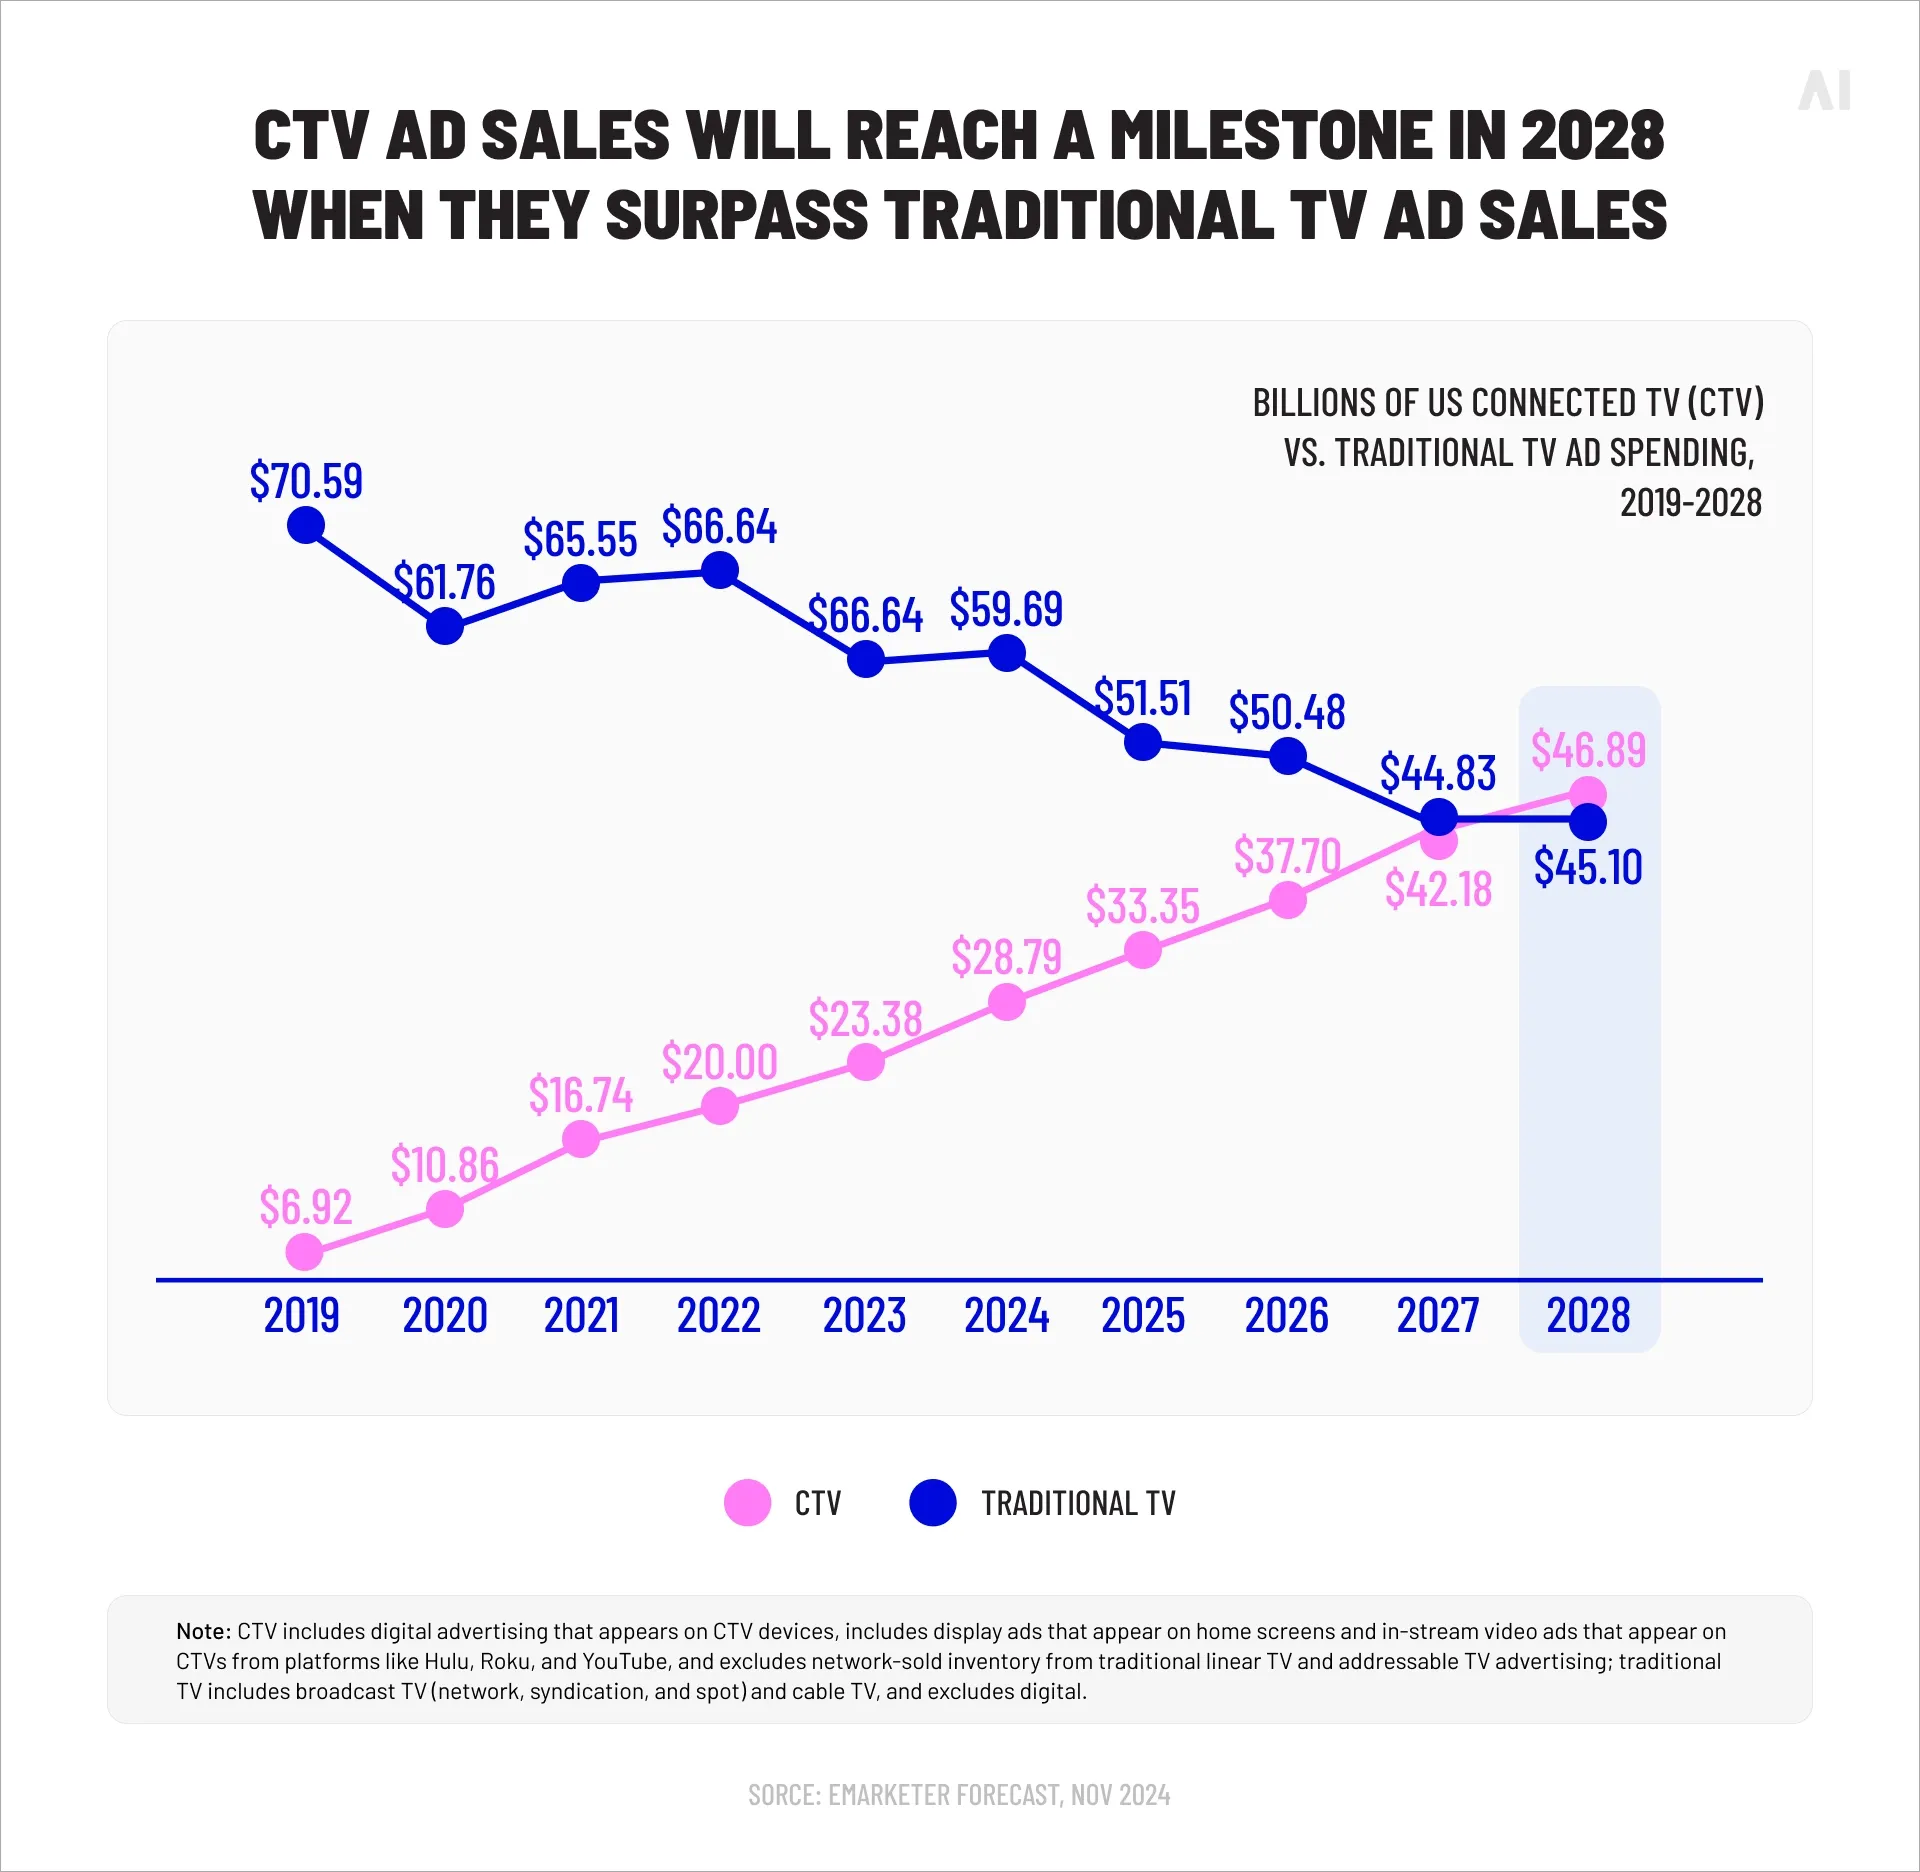
CTV advertising budgets have grown fast, and measurement has been forced to grow up with them. EMARKETER forecasts U.S. CTV ad spending will reach $33.35 billion in 2025 and rise to $37.70 billion in 2026 (about 13% year over year).
That growth is great news—until you try to answer basic questions like:
How many unique households did we reach across all streaming publishers?
Did frequency spike on one app while another under-delivered?
Were impressions actually measurable and viewable?
Did the campaign cause incremental outcomes, or did we just “find” people who were already going to convert?
Those questions are exactly why modern CTV measurement is no longer “nice to have.” It’s the operating system for performance, optimization, and budget confidence.
CTV measurement is the set of methods used to quantify delivery, quality, audience exposure, and outcomes for ads served on internet-connected TV environments (smart TVs, streaming devices, gaming consoles, and CTV apps).
A useful way to define it is by what it must cover:
Delivery: What happened in ad serving terms (impressions, completion events, quartiles, errors).
Quality: Whether impressions were measurable, viewable, fraud-free, and brand-safe.
Audience: Who was exposed (reach, unique households, deduplicated reach across publishers).
Outcomes: What changed after exposure (site visits, conversions, store traffic, sales, incrementality lift).
What CTV measurement isn’t:
A single metric like ROAS or view-through conversions.
A universal standard that every publisher reports the same way.
“Set it and forget it” reporting. Most meaningful CTV insights require alignment on definitions before launch.
The walled garden reality: Many publishers can measure their own ecosystem cleanly, but cross-publisher comparability and transparency are still uneven.
How CTV measurement works
At a high level, CTV measurement connects ad exposure signals to audience and outcome signals. In practice, that requires multiple systems cooperating, and they don’t always cooperate nicely.
A simple mental model looks like this:
Ad request → Ad decision → Ad delivery → Event tracking → Verification → Identity resolution → Attribution/incrementality
Below is what that means in real operations.
Data collection and identity signals
Most CTV delivery tracking depends on ad serving standards that define how video ads are described and how tracking events fire. The IAB Tech Lab’s VAST standard is the core template used to pass video ad metadata and enable tracking across video players.
CTV adds extra complexity because players and environments vary widely, which is why the Tech Lab has continued issuing CTV-focused addenda and guidance to support consistent functionality across TV environments.
What gets collected (in the best-case scenario):
Impression events (served and, where supported, viewable/measurable events)
Industry guidance for measurement in OTT/CTV environments (including server-side ad insertion) is covered in MRC documentation, which is frequently referenced in accreditation and standards discussions.
One of the most practical realities here: CTV “viewability” is not always the same as desktop/mobile viewability, and vendors may apply different definitions (for example, requirements like full-screen playback with sound on). You can’t assume comparability unless you confirm the definition and methodology in writing. The ANA’s Programmatic Transparency Benchmark explicitly notes that methodology differences and varying definitions influence reported CTV viewability and how it compares to “traditional” viewability metrics.
Outcome measurement and attribution
CTV outcomes are harder than “click → conversion” channels for one obvious reason: people usually don’t click a TV ad.
So outcome measurement often relies on combinations of:
View-through attribution (conversion happens later on another device)
Household-level matching (CTV exposure linked to household activity)
Modeled attribution (probabilistic matching plus model-based crediting)
Lift tests / incrementality (control vs exposed comparisons)
A growing theme in 2024–2025 is closing the “outcome gap” by using server-to-server event sharing instead of relying on cookies or fragile client-side signals. IAB’s 2025 guide on Conversion APIs (CAPI) frames this as a path to more standardized, privacy-forward outcome measurement in CTV.
{{26-CTV-Measurement-SEO-1="/tables"}}
⚡ Attribution tells you a story. Incrementality tests whether the story is true.
Why CTV measurement is harder than it looks
CTV feels digital, but measurement behaves like a hybrid of digital and traditional TV. The hard parts usually show up after launch, when definitions collide and data stops lining up.
Here are the core friction points.
Fragmentation and duplication
CTV runs across:
Device manufacturers
Operating systems
Streaming apps
Content distributors
Different ad serving methods (client-side vs server-side insertion)
Each layer can affect what you can measure and how consistent the logs are.
A practical consequence is reach/frequency distortion. Innovid’s 2025 CTV Advertising Insights Report highlights this clearly: in 2024, the average CTV household reach was 19.64% with an average frequency of 7.09 across campaigns measured through its platform.That’s a classic “high frequency on a limited slice of households” pattern, and it’s exactly what fragmentation and duplication tend to create.
Even when you buy programmatically, you may not receive:
Complete app identifiers
Consistent content signals
Full log-level data
Comparable measurement methods across publishers
IAB’s CAPI guide points to this transparency gap directly: only 21% of surveyed sellers said they always provide advertisers access to logs or dashboards, which limits trust and adoption.
If you’re trying to do cross-publisher reach/frequency, this becomes a real constraint. It’s also why cross-media measurement providers emphasize deduplication and comparability.
Nielsen’s explanation of cross-media measurement is blunt and useful: cross-media measurement makes it possible to deduplicate audiences across publishers and calculate reach and frequency. That is exactly the capability CTV marketers want, and exactly what walled gardens often restrict.
Retargeting and frequency controls (less deterministic control)
IAB’s State of Data 2024 report reflects how widespread this pressure is: 95% of respondents expect data/identity disruption to continue, driven by regulation and signal loss.
In CTV, “served” does not always mean “seen,” and “seen” does not always mean “paid attention.”
Two practical wrinkles:
Measurability isn’t guaranteed. The ANA benchmark notes that CTV remains fragmented, though measurability has improved, with a median measurability of 64.1% in its Q1 2025 benchmark.
IVT risk is real. The same benchmark reports IVT ranges up to 26.1% for some marketers, with a median of 3.5% in CTV—seven times higher than non-CTV inventory’s median in that dataset.
None of this means CTV is “worse.” It means CTV measurement needs explicit guardrails: agreed definitions, verification, and a framework that prioritizes decision-making over vanity reporting.
{{26-CTV-Measurement-SEO-2="/tables"}}
The key CTV metrics that will define successful CTV campaigns
This is the section teams use to decide what goes on the dashboard. The mistake is treating every metric as equally meaningful. Instead, you want a small set of metrics that connect together logically:
Impressions in CTV typically represent an ad served (and often started). But the more useful concept is eligible impressions: impressions that meet your minimum standard for:
measurable delivery
fraud filtering thresholds
agreed completion rules (or at least “started” rules)
app transparency requirements (so you can optimize supply)
How to use it well:
Report total impressions, but optimize to eligible impressions so buyers don’t “win” cheap inventory that can’t be measured.
Confirm whether “impression” means served, started, or viewable in each report.
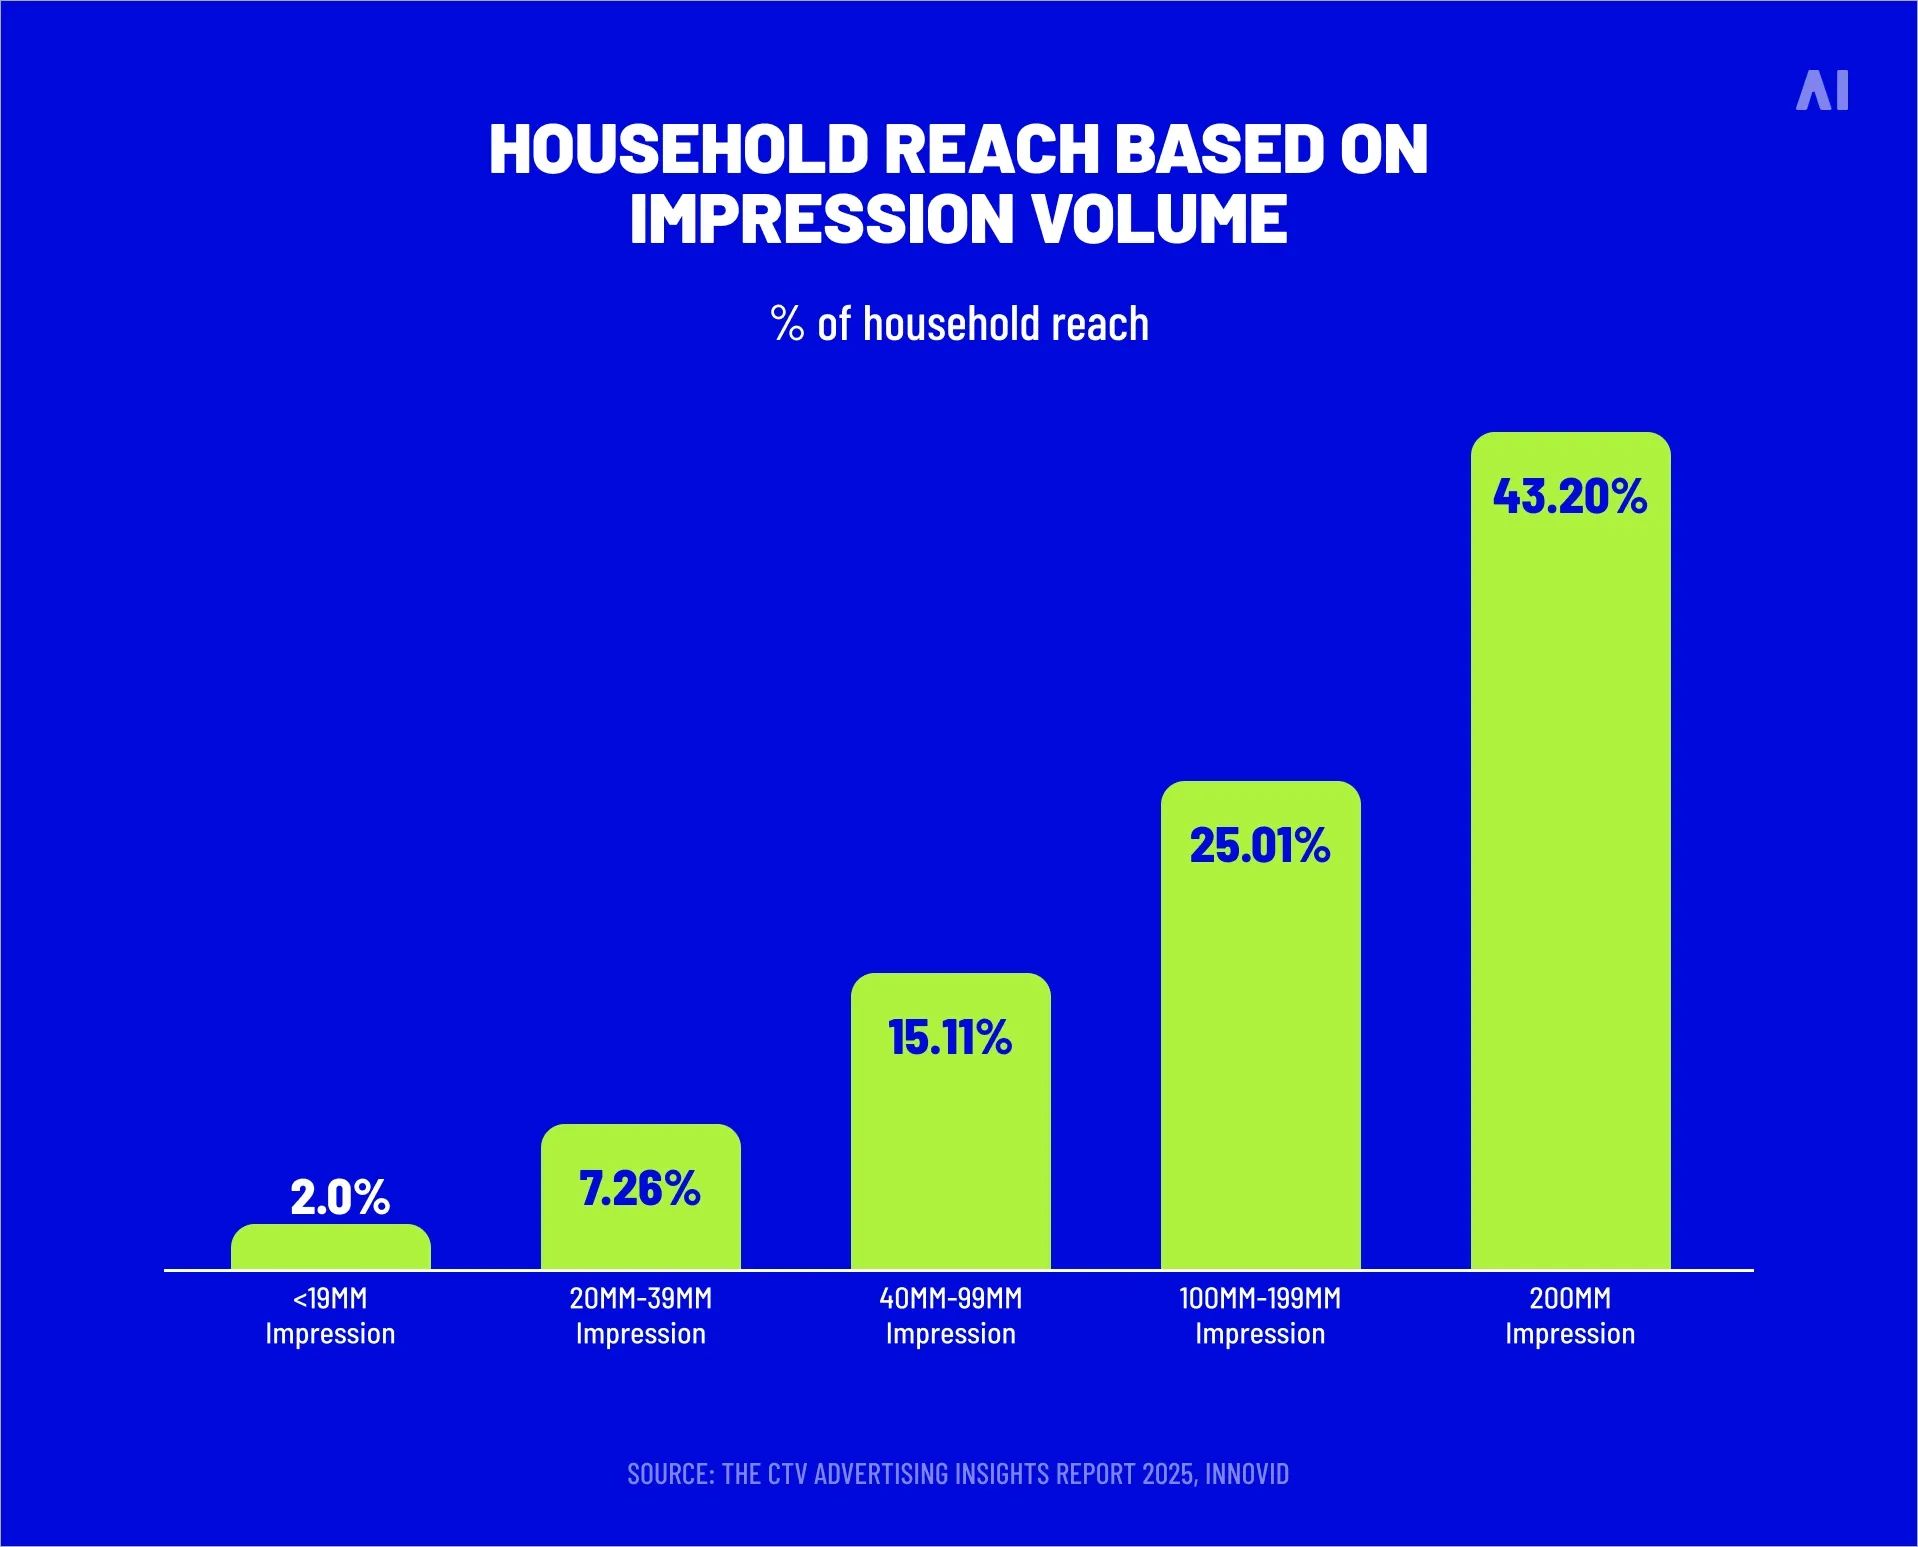
Household reach based on impression volume (Source)
Unique households and reach
CTV reach is commonly reported as unique households (HH reach). It’s powerful, but it’s easy to misuse.
Key nuance: HH reach can be:
within one publisher/app
deduplicated across multiple publishers (harder, but far more decision-useful)
Innovid’s finding (average HH reach 19.64%) is a reminder that campaigns can look large in impression volume while still reaching a relatively small share of households.
How to use it well:
Always pair HH reach with frequency (reach without frequency hides overexposure).
For multi-publisher buys, push for deduplicated reach wherever possible (this is where cross-media measurement matters).
Frequency and frequency management
Frequency answers: how often did the average household see the ad?
In CTV, frequency is not just a planning metric. It’s a quality control mechanism:
Too low: you won’t build recall or drive outcomes.
Too high: you burn budget, irritate viewers, and distort attribution.
Innovid’s reported average campaign frequency of 7.09 is a good illustration of how frequency can climb quickly when reach is constrained.
How to use it well:
Monitor frequency distribution, not just the average (the average can hide a long tail of households seeing 20+ exposures).
Use frequency caps, but validate they work across publishers—many caps are siloed.
{{26-CTV-Measurement-SEO-4="/tables"}}
Viewability
Viewability in CTV is improving, but it is also one of the most definition-sensitive metrics in the channel.
The ANA benchmark reports a median viewability of 21.4% in its Q1 2025 dataset, while also warning that vendor methodology and definitions can vary (including requirements like full-screen with sound on).
How to use it well
Treat viewability as a vendor-defined measurement, not a universal truth.
Compare like with like: the same vendor, same definition, same supply subset.
Completion rate and CPCV
Completion rate is the percentage of video starts that reach 100% completion.
On CTV, completion rates tend to be relatively strong because many ads are not skippable, but you still need to confirm:
what counts as a “start”
whether a completion requires audio on
how buffering or player errors are treated
CPCV (cost per completed view) is often more meaningful than CPM when:
Attention metrics are still evolving, and they vary by methodology (eyes-on-screen panels, ACR-based approaches, modeled attention), but the practical use is already clear:
Attention helps explain why two placements with the same completion rate can perform differently.
It can guide creative and placement decisions beyond “cheap CPM.”
match rate (how many exposed households can be linked to outcome signals)
false positives risk (how often you might link the wrong household/device)
Accuracy improves when you have stronger first-party data and privacy-safe collaboration.
IAB’s State of Data 2024 report shows how common privacy-safe infrastructure has become: 66% of respondents are investing in or planning to invest in data clean rooms.That matters because clean rooms can improve governance and consistency in matching, even when cookies and mobile IDs are less available.
AI can meaningfully improve CTV measurement, but only when it’s applied to concrete problems: identity resolution, anomaly detection, and predictive decisioning. It’s not a substitute for bad definitions or missing logs.
predict household connections when signals are incomplete
reduce duplication across devices
estimate deduplicated reach when deterministic IDs are unavailable
But the key discipline is to label outputs correctly: modeled reach is modeled, not observed.
IAB’s State of Data 2024 report notes that 32% of respondents are using AI/ML to enhance first-party profiles. That’s a strong hint of where the industry is focusing: making first-party identity assets more useful for measurement.
AI for anomaly detection and fraud prevention
CTV fraud evolves fast because supply chains are complex and spoofing can be profitable. AI-based anomaly detection can identify:
impossible device patterns
suspicious traffic spikes
abnormal completion behavior
app-level inconsistencies
This matters even more in CTV because invalid traffic can distort both delivery and outcome metrics.
AI for predictive measurement and optimization
The most practical “AI win” in CTV measurement is using outcome signals to improve decisions:
predicting which supply paths drive incremental outcomes
guiding bid strategies when click signals are absent
forecasting frequency saturation risk
IAB’s CAPI guide includes a useful indicator of how outcome signals feed optimization: 61% report using CAPI to power bidding optimization, and 50% apply it to segmentation.
That’s where measurement stops being a report and becomes a control system.
How to build CTV measurement framework
This section is designed to be operational. A good framework is less about tooling and more about aligning definitions, partners, and decision rules.
Step 1: Start with the business question, not the dashboard
Before you pick metrics, write the decision you want to make:
“Which publishers should get more budget next flight?”
“Is CTV incremental vs paid social for new-to-brand customers?”
“Do we need broader reach or tighter frequency control?”
This keeps reporting from becoming a weekly ritual with no consequence.
Step 2: Lock metric definitions before launch
Write definitions for:
impression (served vs started vs viewable)
completion (100% vs “audible and visible”)
viewability definition and vendor
attribution window (and what counts as a conversion)
deduplication scope (publisher-only vs cross-publisher)
This sounds basic. It’s also the fastest way to prevent post-campaign confusion.
Step 3: Choose your measurement stack deliberately
Most advertisers need a combination of:
platform reporting (directional, fast)
verification (quality controls)
cross-media measurement (dedup reach/frequency where possible)
incrementality testing (causal validation)
MMM (long-term planning, budget allocation)
Pick the minimum set that answers your business question. More tools do not automatically produce more truth.
Step 4: Build an outcome pipeline that can survive signal loss
If you want performance measurement, you need outcome signals that can be shared in privacy-safe ways.
IAB’s CAPI guide is worth reading here because it outlines how Conversion APIs can support outcome measurement where clicks and cookies are weak, and it documents barriers that commonly slow adoption (for example, technical complexity and compliance concerns).
Step 5: Design incrementality into the plan (not as a postscript)
align which outcomes count (sales, leads, store visits)
decide how you’ll interpret null results
A lift test that wasn’t designed into the buy often becomes a compromised analysis later.
Step 6: Create optimization rules tied to measurement
Your framework should produce actions, not just insights.
Examples:
If frequency exceeds X with flat reach growth, shift budget to reach expansion tactics.
If IVT exceeds threshold, block the supply path and reallocate.
If attention is consistently low on a set of apps, revisit creative fit or placement type.
If view-through conversions rise but lift is flat, tighten windows and re-evaluate attribution.
Common mistakes advertisers make
Most CTV measurement problems are predictable. Here are the ones that show up most often—and what to do instead.
Treating platform reporting as cross-platform truth: Use platform data, but validate with independent measurement where possible.
Optimizing to cheap CPM without an “eligible impression” standard: Cheap impressions are not cheap if they can’t be measured or are IVT-heavy.
Looking at average frequency only: Always check distribution. Averages hide saturation.
Assuming viewability means the same thing everywhere: Confirm the definition and vendor methodology up front.
Using view-through conversions as “proof”: Treat VTC as directional and validate with incrementality.
Skipping deduplicated reach planning: Cross-media measurement exists for a reason: deduplicated reach and frequency are foundational for modern campaigns.
Adding AI before definitions are stable: AI can improve modeling, but it cannot rescue inconsistent inputs.
{{26-CTV-Measurement-SEO-5="/tables"}}
⚡ Bad measurement doesn’t just misreport performance — it trains your next campaign to repeat the wrong decisions.
Conclusion: What defines a successful CTV campaign today
CTV measurement is finally being treated like what it is: the foundation for budget confidence. The channel can deliver both reach and outcomes, but the measurement layer has to be designed with intent.
If you want a practical north star, use this sequence:
Make delivery measurable
Protect quality
Deduplicate reach and control frequency
Measure outcomes carefully
Validate with incrementality
Use AI to improve modeling and detection, not to paper over missing standards
And if you’re ever unsure whether a metric is telling you the truth, ask one question: “What decision would I make if this number were wrong?” That usually reveals where your framework needs to be tighter.
If you want CTV measurement you can actually trust, talk to AI Digital. We help you plan, buy, and measure across the Open Internet with DSP-agnostic managed service, Smart Supply (premium selection + SPO), and Elevate (AI-powered intelligence + optimization).
Blind spot
Key issues
Business impact
AI Digital solution
Lack of transparency in AI models
• Platforms own AI models and train on proprietary data • Brands have little visibility into decision-making • "Walled gardens" restrict data access
• Inefficient ad spend • Limited strategic control • Eroded consumer trust • Potential budget mismanagement
Open Garden framework providing: • Complete transparency • DSP-agnostic execution • Cross-platform data & insights
Optimizing ads vs. optimizing impact
• AI excels at short-term metrics but may struggle with brand building • Consumers can detect AI-generated content • Efficiency might come at cost of authenticity
• Short-term gains at expense of brand health • Potential loss of authentic connection • Reduced effectiveness in storytelling
Smart Supply offering: • Human oversight of AI recommendations • Custom KPI alignment beyond clicks • Brand-safe inventory verification
The illusion of personalization
• Segment optimization rebranded as personalization • First-party data infrastructure challenges • Personalization vs. surveillance concerns
• Potential mismatch between promise and reality • Privacy concerns affecting consumer trust • Cost barriers for smaller businesses
Elevate platform features: • Real-time AI + human intelligence • First-party data activation • Ethical personalization strategies
AI-Driven efficiency vs. decision-making
• AI shifting from tool to decision-maker • Black box optimization like Google Performance Max • Human oversight limitations
• Strategic control loss • Difficulty questioning AI outputs • Inability to measure granular impact • Potential brand damage from mistakes
Managed Service with: • Human strategists overseeing AI • Custom KPI optimization • Complete campaign transparency
Fig. 1. Summary of AI blind spots in advertising
Dimension
Walled garden advantage
Walled garden limitation
Strategic impact
Audience access
Massive, engaged user bases
Limited visibility beyond platform
Reach without understanding
Data control
Sophisticated targeting tools
Data remains siloed within platform
Fragmented customer view
Measurement
Detailed in-platform metrics
Inconsistent cross-platform standards
Difficult performance comparison
Intelligence
Platform-specific insights
Limited data portability
Restricted strategic learning
Optimization
Powerful automated tools
Black-box algorithms
Reduced marketer control
Fig. 2. Strategic trade-offs in walled garden advertising.
Core issue
Platform priority
Walled garden limitation
Real-world example
Attribution opacity
Claiming maximum credit for conversions
Limited visibility into true conversion paths
Meta and TikTok's conflicting attribution models after iOS privacy updates
Data restrictions
Maintaining proprietary data control
Inability to combine platform data with other sources
Amazon DSP's limitations on detailed performance data exports
Cross-channel blindspots
Keeping advertisers within ecosystem
Fragmented view of customer journey
YouTube/DV360 campaigns lacking integration with non-Google platforms
Black box algorithms
Optimizing for platform revenue
Reduced control over campaign execution
Self-serve platforms using opaque ML models with little advertiser input
Performance reporting
Presenting platform in best light
Discrepancies between platform-reported and independently measured results
Consistently higher performance metrics in platform reports vs. third-party measurement
Fig. 1. The Walled garden misalignment: Platform interests vs. advertiser needs.
Key dimension
Challenge
Strategic imperative
ROAS volatility
Softer returns across digital channels
Shift from soft KPIs to measurable revenue impact
Media planning
Static plans no longer effective
Develop agile, modular approaches adaptable to changing conditions
Brand/performance
Traditional division dissolving
Create full-funnel strategies balancing long-term equity with short-term conversion
Capability
Key features
Benefits
Performance data
Elevate forecasting tool
• Vertical-specific insights • Historical data from past economic turbulence • "Cascade planning" functionality • Real-time adaptation
• Provides agility to adjust campaign strategy based on performance • Shows which media channels work best to drive efficient and effective performance • Confident budget reallocation • Reduces reaction time to market shifts
• Dataset from 10,000+ campaigns • Cuts response time from weeks to minutes
• Reaches people most likely to buy • Avoids wasted impressions and budgets on poor-performing placements • Context-aligned messaging
• 25+ billion bid requests analyzed daily • 18% improvement in working media efficiency • 26% increase in engagement during recessions
Full-funnel accountability
• Links awareness campaigns to lower funnel outcomes • Tests if ads actually drive new business • Measures brand perception changes • "Ask Elevate" AI Chat Assistant
• Upper-funnel to outcome connection • Sentiment shift tracking • Personalized messaging • Helps balance immediate sales vs. long-term brand building
• Natural language data queries • True business impact measurement
Open Garden approach
• Cross-platform and channel planning • Not locked into specific platforms • Unified cross-platform reach • Shows exactly where money is spent
• Reduces complexity across channels • Performance-based ad placement • Rapid budget reallocation • Eliminates platform-specific commitments and provides platform-based optimization and agility
• Coverage across all inventory sources • Provides full visibility into spending • Avoids the inability to pivot across platform as you’re not in a singular platform
Fig. 1. How AI Digital helps during economic uncertainty.
Trend
What it means for marketers
Supply & demand lines are blurring
Platforms from Google (P-Max) to Microsoft are merging optimization and inventory in one opaque box. Expect more bundled “best available” media where the algorithm, not the trader, decides channel and publisher mix.
Walled gardens get taller
Microsoft’s O&O set now spans Bing, Xbox, Outlook, Edge and LinkedIn, which just launched revenue-sharing video programs to lure creators and ad dollars. (Business Insider)
Retail & commerce media shape strategy
Microsoft’s Curate lets retailers and data owners package first-party segments, an echo of Amazon’s and Walmart’s approaches. Agencies must master seller-defined audiences as well as buyer-side tactics.
AI oversight becomes critical
Closed AI bidding means fewer levers for traders. Independent verification, incrementality testing and commercial guardrails rise in importance.
Fig. 1. Platform trends and their implications.
Metric
Connected TV (CTV)
Linear TV
Video Completion Rate
94.5%
70%
Purchase Rate After Ad
23%
12%
Ad Attention Rate
57% (prefer CTV ads)
54.5%
Viewer Reach (U.S.)
85% of households
228 million viewers
Retail Media Trends 2025
Access Complete consumer behaviour analyses and competitor benchmarks.
Identify and categorize audience groups based on behaviors, preferences, and characteristics
Michaels Stores: Implemented a genAI platform that increased email personalization from 20% to 95%, leading to a 41% boost in SMS click through rates and a 25% increase in engagement.
Estée Lauder: Partnered with Google Cloud to leverage genAI technologies for real-time consumer feedback monitoring and analyzing consumer sentiment across various channels.
High
Medium
Automated ad campaigns
Automate ad creation, placement, and optimization across various platforms
Showmax: Partnered with AI firms toautomate ad creation and testing, reducing production time by 70% while streamlining their quality assurance process.
Headway: Employed AI tools for ad creation and optimization, boosting performance by 40% and reaching 3.3 billion impressions while incorporating AI-generated content in 20% of their paid campaigns.
High
High
Brand sentiment tracking
Monitor and analyze public opinion about a brand across multiple channels in real time
L’Oréal: Analyzed millions of online comments, images, and videos to identify potential product innovation opportunities, effectively tracking brand sentiment and consumer trends.
Kellogg Company: Used AI to scan trending recipes featuring cereal, leveraging this data to launch targeted social campaigns that capitalize on positive brand sentiment and culinary trends.
High
Low
Campaign strategy optimization
Analyze data to predict optimal campaign approaches, channels, and timing
DoorDash: Leveraged Google’s AI-powered Demand Gen tool, which boosted its conversion rate by 15 times and improved cost per action efficiency by 50% compared with previous campaigns.
Kitsch: Employed Meta’s Advantage+ shopping campaigns with AI-powered tools to optimize campaigns, identifying and delivering top-performing ads to high-value consumers.
High
High
Content strategy
Generate content ideas, predict performance, and optimize distribution strategies
JPMorgan Chase: Collaborated with Persado to develop LLMs for marketing copy, achieving up to 450% higher clickthrough rates compared with human-written ads in pilot tests.
Hotel Chocolat: Employed genAI for concept development and production of its Velvetiser TV ad, which earned the highest-ever System1 score for adomestic appliance commercial.
High
High
Personalization strategy development
Create tailored messaging and experiences for consumers at scale
Stitch Fix: Uses genAI to help stylists interpret customer feedback and provide product recommendations, effectively personalizing shopping experiences.
Instacart: Uses genAI to offer customers personalized recipes, mealplanning ideas, and shopping lists based on individual preferences and habits.
Medium
Medium
Share article
Url copied to clipboard
No items found.
Subscribe to our Newsletter
THANK YOU FOR YOUR SUBSCRIPTION
Oops! Something went wrong while submitting the form.
Questions? We have answers
What makes CTV measurement different from linear TV?
CTV measurement is impression-based and event-driven, so you can track delivery, completion, and outcomes at the household or device level, often close to real time. Linear TV measurement is typically panel-based and modeled, which is useful for broad reach but less precise for deduplication, frequency control, and linking exposure to actions across devices.
What are the most important CTV metrics?
The essentials are impressions you can actually trust (measurable and quality-filtered), deduplicated reach or unique households, frequency, completion rate, and cost efficiency (CPM or CPCV/CPA). For outcome-focused campaigns, you also need ROAS or CPA tied to a clearly defined attribution method, plus incrementality lift to validate what’s truly causal.
How accurate is CTV attribution?
It depends on the identity signals available and the methodology used. Deterministic signals like logins or hashed emails tend to be more reliable, while probabilistic household matching and modeled approaches introduce more uncertainty, especially across devices. The safest approach is to treat attribution as directional unless it’s validated with lift testing.
Can CTV drive lower-funnel results?
Yes, especially when it’s paired with strong audience targeting, clear creative-to-action paths, and measurement that captures view-through behavior. CTV can influence site visits, lead starts, and purchases, but proving lower-funnel impact requires clean outcome tracking and a plan for isolating incremental results rather than relying on last-touch logic.
Does AI improve CTV measurement?
AI can help when it’s used to solve specific problems like deduplicating audiences, detecting invalid traffic patterns, predicting saturation risk, and improving optimization decisions based on outcome signals. It doesn’t fix inconsistent definitions or missing transparency, so it works best as a layer on top of solid measurement design.
How does incrementality testing work on CTV?
Incrementality testing compares outcomes between an exposed group and a similar control group that did not see the CTV ads, using audience holdouts, geo splits, or other experimental designs. The difference between the two groups is the incremental lift, which helps you understand what CTV caused beyond what would have happened anyway.
Which CTV KPIs matter most for CTV performance?
The right CTV KPIs depend on your goal, but strong CTV advertising measurement usually combines reach and frequency to confirm real audience delivery, quality signals like completion or attention to judge exposure, and outcome metrics like CPA/ROAS validated with incrementality so you can separate true impact from attribution noise.
Have other questions?
If you have more questions, contact us so we can help.


.svg)
.svg)