What Is CPCV (Cost Per Completed View) — and Why It Matters for Video Advertising
Tatev Malkhasyan
February 23, 2026
14
minutes read
Video performance is easy to overstate when “view” can mean anything from a two-second glance to a full watch. Cost per completed view (CPCV) fixes that by tying spend to finished ads, giving you a clearer read on whether your message actually landed across CTV, programmatic video, social, and DOOH.
CPCV has become more important for one big reason: video delivery has fragmented, while measurement expectations have not. Marketers still need to prove message delivery, manage waste, and compare performance across placements that behave very differently.
In the U.S., streaming has been taking a larger share of total TV time, and ad-supported streaming remains a major part of the experience. At the same time, the streaming universe keeps expanding in household reach and total hours, which widens the opportunity—and the room for inconsistency.
That’s why CPCV sits comfortably inside a broader KPI toolkit.
💡 If you want a refresher on how it fits alongside CPM, CPV, CPA, and reach/frequency metrics, AI Digital’s digital marketing KPI guide is a useful reference point.
⚡ CPCV is less about “cheap video” and more about paid attention you can audit.
What is CPCV?
CPCV (Cost per completed view) is the amount you pay, on average, for a video ad that reaches whatever your platform defines as a completed view.
At its simplest:
Completed view = a view that hits the completion threshold (often 100% of the video, but not always)
CPCV = the cost you paid to generate those completions
Why it’s valuable: CPCV focuses on message delivery, not just delivery of an impression or a partial view. That matters when you’re running awareness and consideration creative where the ending carries the brand, offer, or call-to-action.
Two practical notes before you use it in anger:
“Completed” is not universally standard. Some platforms define completion as 100% watched; others use thresholds (e.g., “viewed for X seconds” or “to the end, whichever comes first”).
Your reporting must always state the completion definition (and the platform/source of truth), or CPCV comparisons become misleading.
💡 If you’re planning to use CPCV in streaming-heavy plans, it helps to align it with your broader CTV measurement approach. AI Digital’s overview of CTV measurement is a helpful companion.
💡 For open-web and auction-based execution, AI Digital’s programmatic video advertising explainer gives relevant context.
How CPCV works across video channels
CPCV behaves differently depending on where the video runs, because completion is shaped by format rules, user behavior, and measurement visibility. One more factor is growing in importance: as identity and user-level tracking become harder, teams lean more on signals that indicate real exposure and real attention.
{{26-What-Is-CPCV-Cost Per Completed View-SEO-1="/tables"}}
Below is how CPCV typically “means” something slightly different in each major video channel.
CPCV in CTV & OTT
On CTV/OTT, many ad formats are closer to traditional TV: full-screen, sound-on by default (often), and frequently non-skippable. That environment can make completion a strong proxy for “the message had a fair chance to land.”
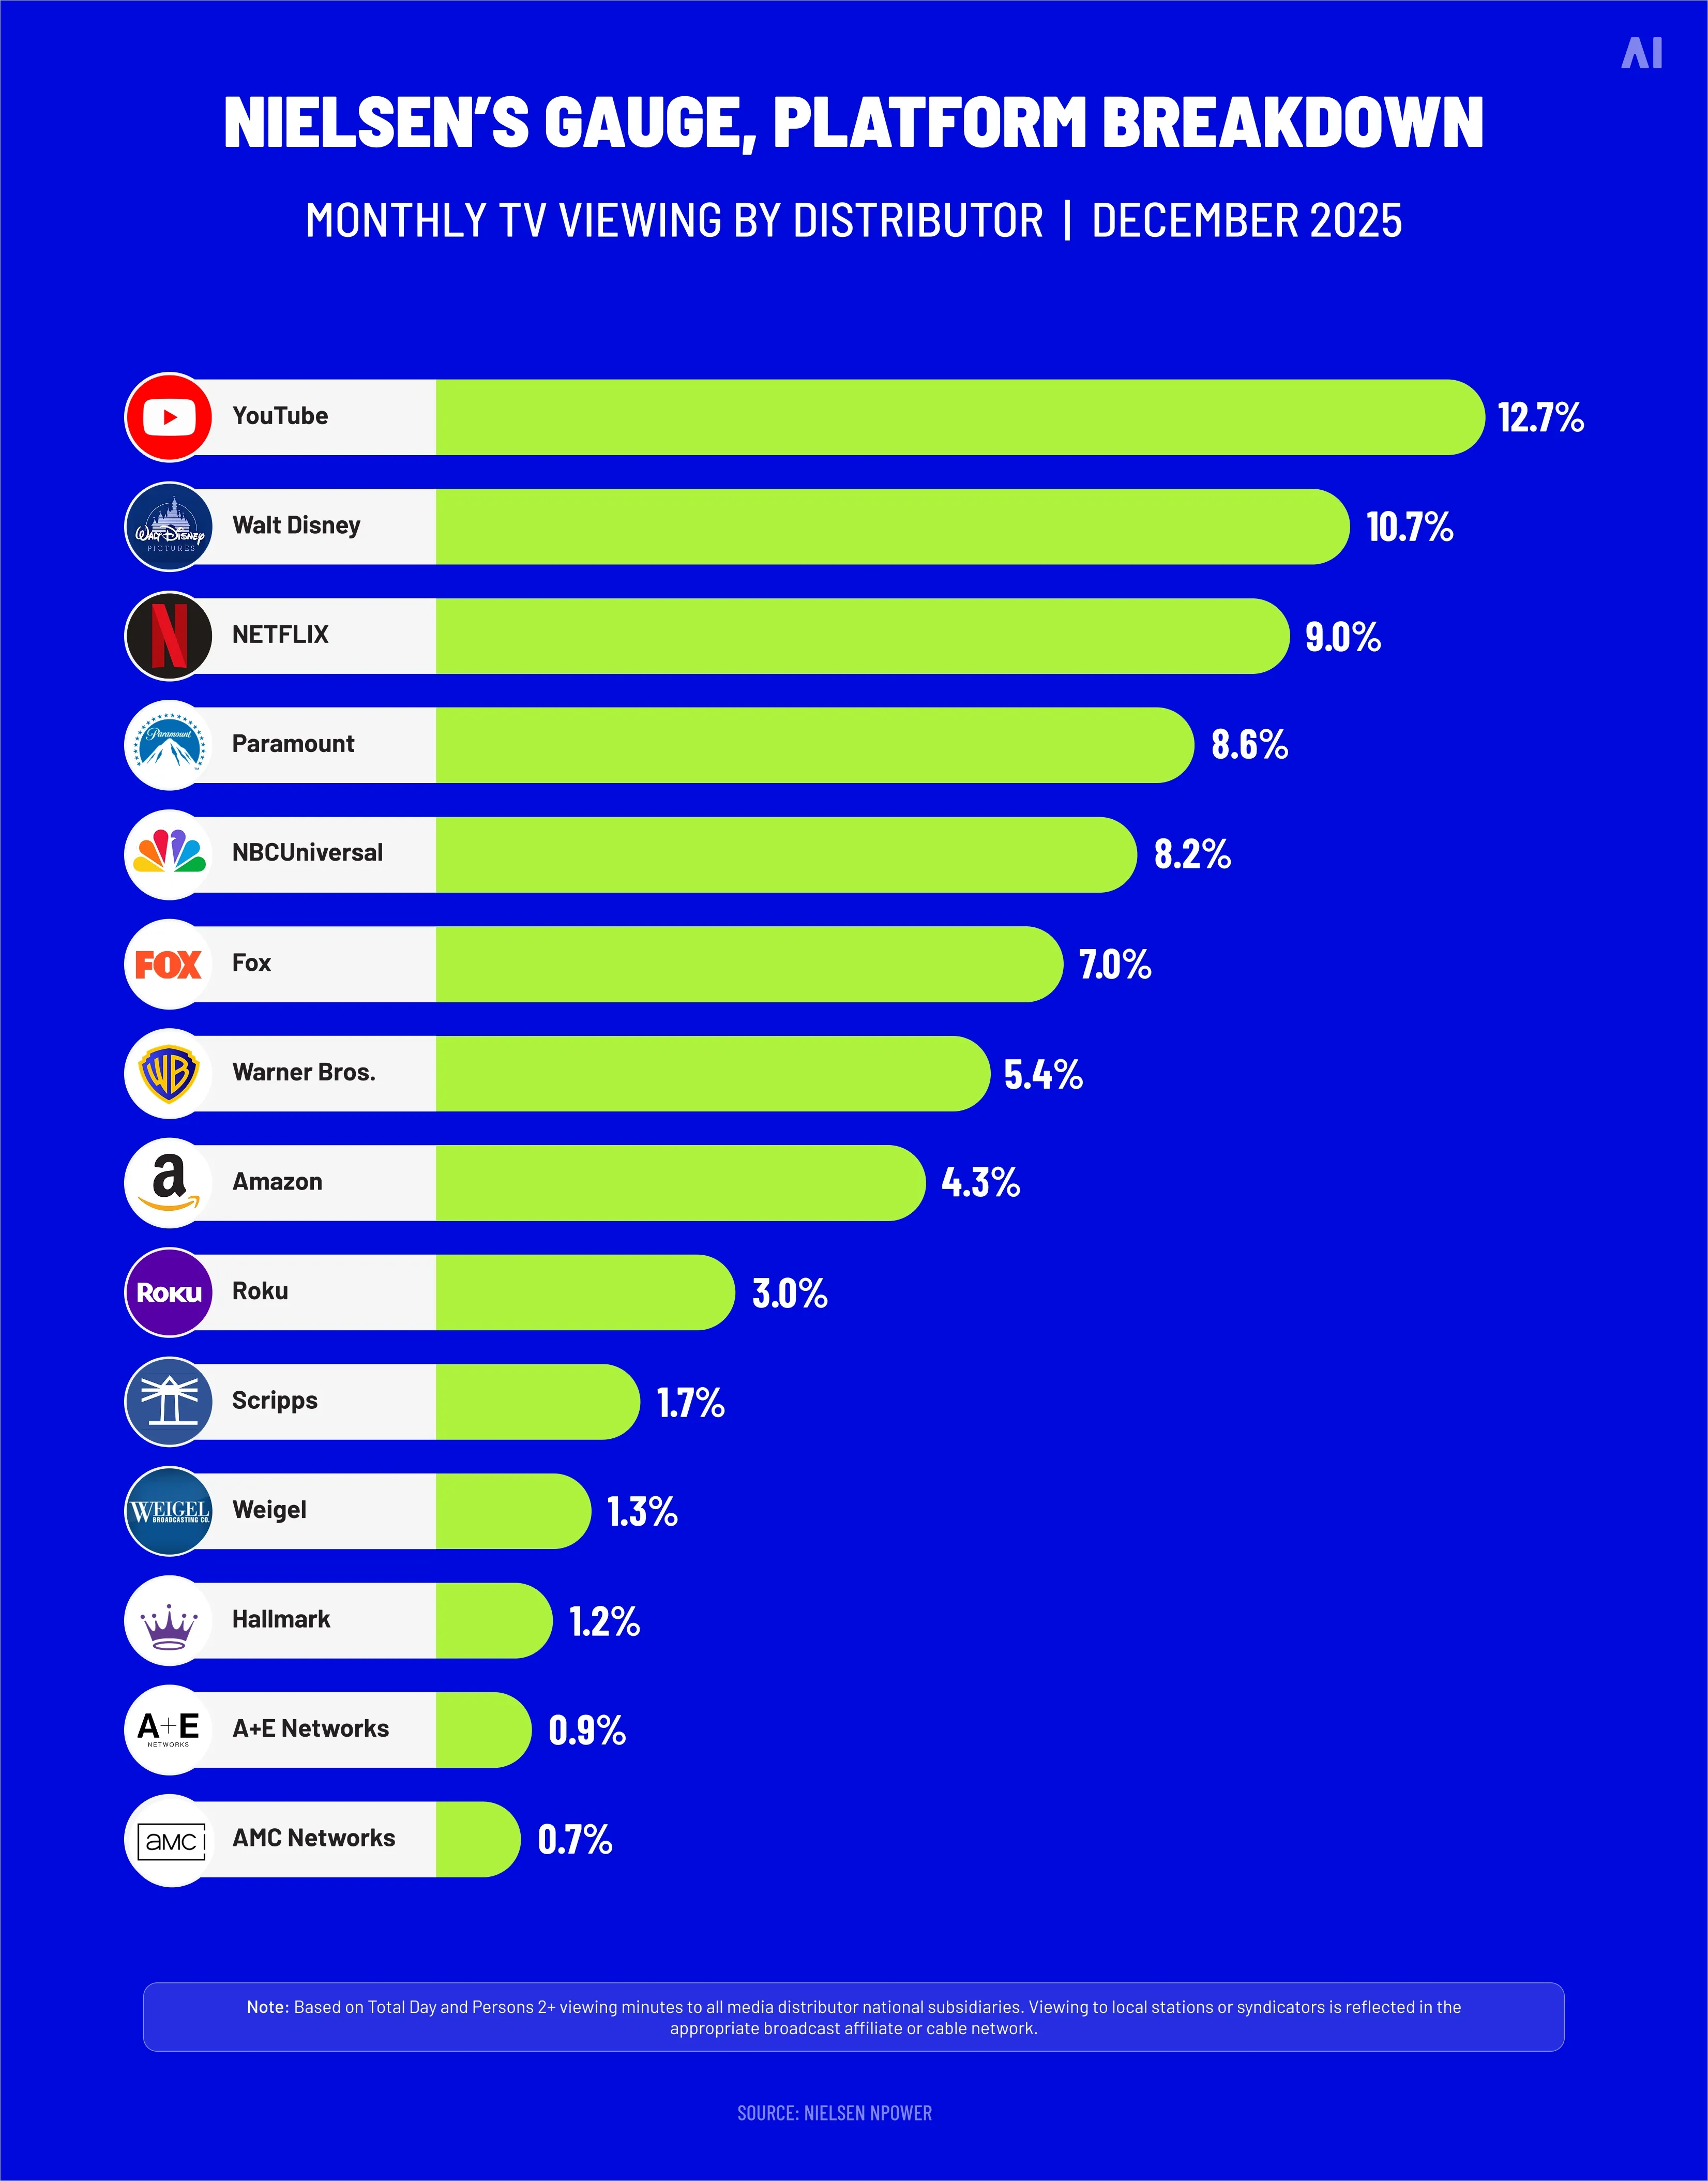
But the catch is measurement quality and transparency. DoubleVerify’s 2025 streaming insights highlight issues that directly affect how trustworthy a “completed view” is, including partial app transparency and waste scenarios like ads continuing after a TV is turned off (“TV Off”). Those aren’t abstract problems—DV also points to bot-driven fraud and large-scale invalid traffic risks in CTV.
Nielsen’s Gauge, streaming breakdown by platform (Source)
CPCV in programmatic video
In open-web programmatic video, completion is heavily influenced by player behavior and placement quality:
autoplay vs click-to-play,
in-article vs in-banner vs outstream,
viewability (was the video actually on screen?),
and supply quality (was it a real human opportunity?).
This is where CPCV can become a “false friend” if you chase cheap completions in low-quality environments.
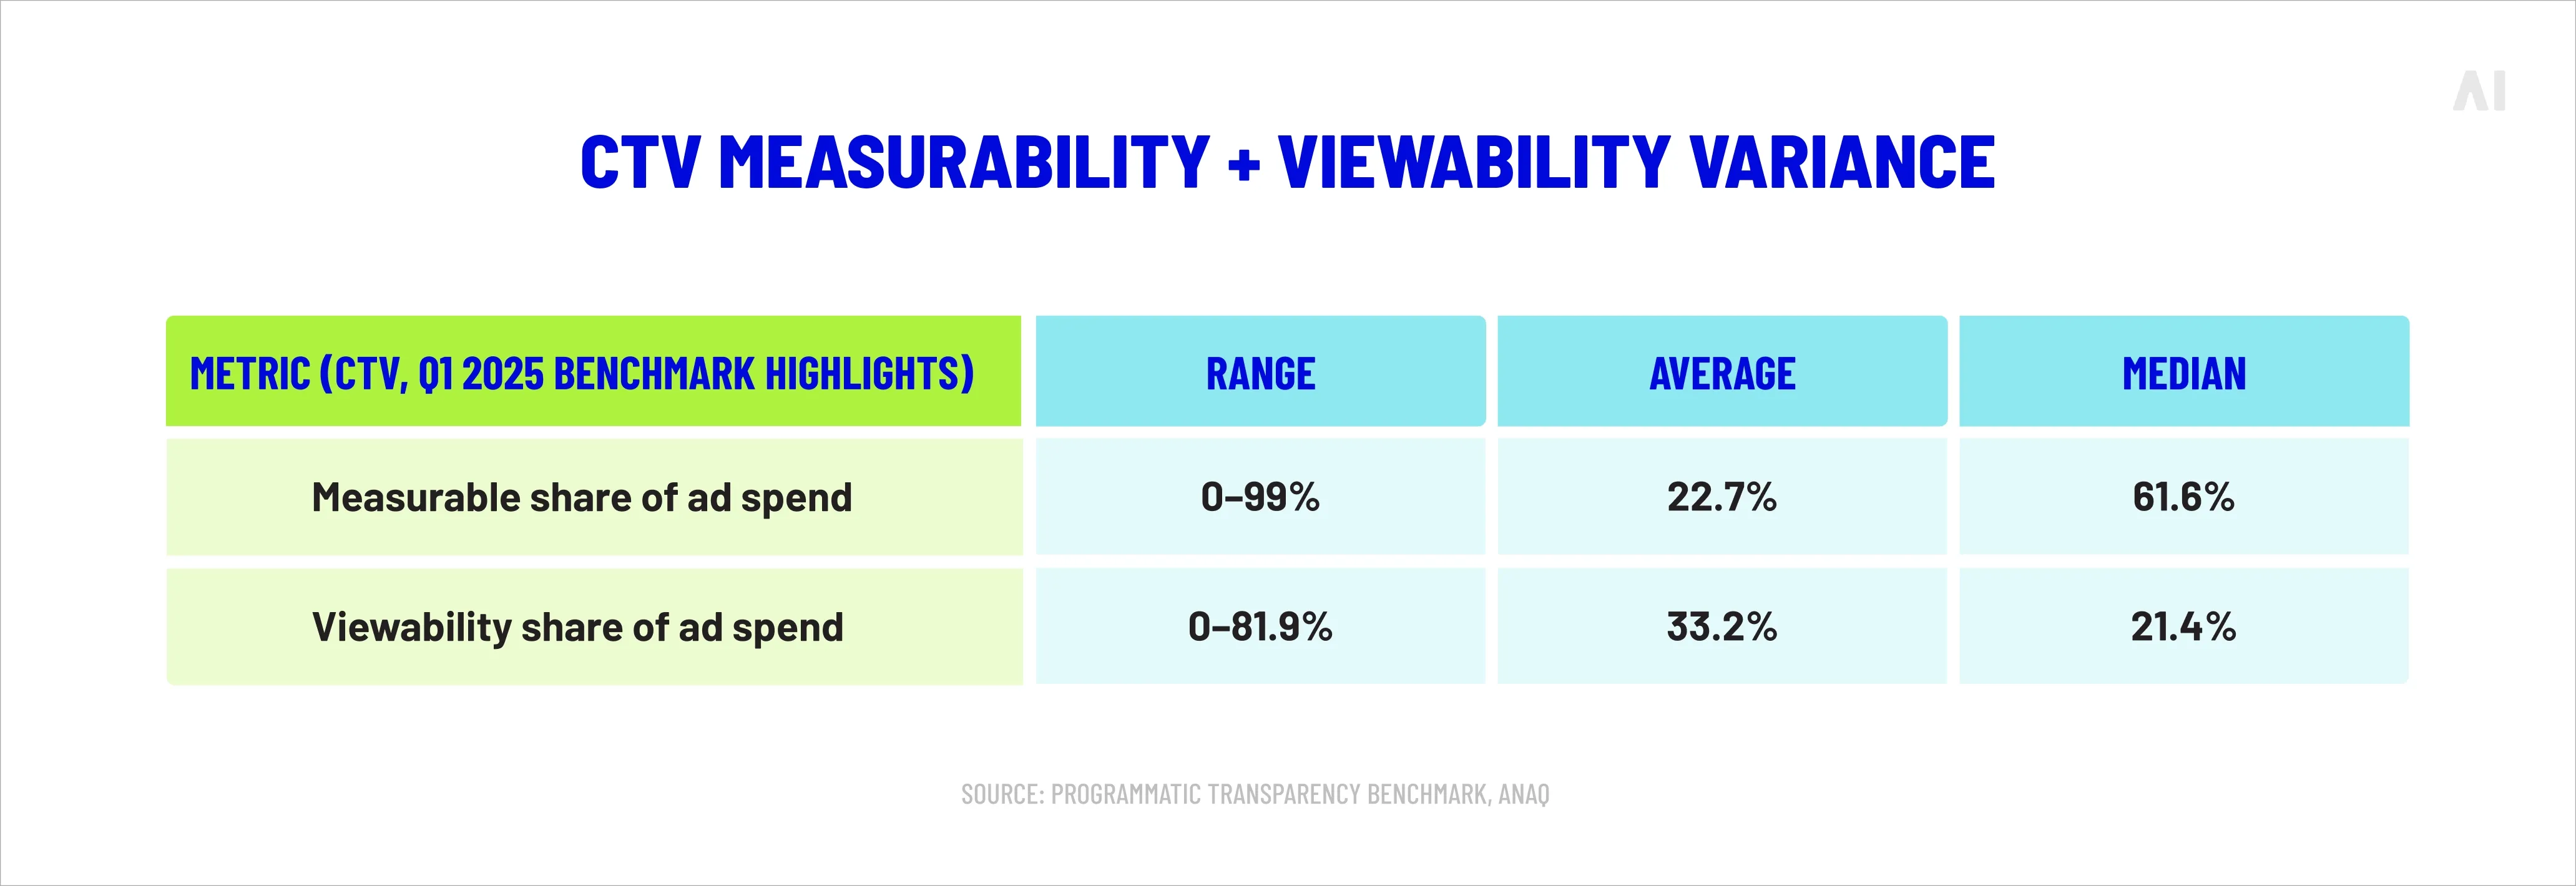
The ANA’s Q1 2025 Programmatic Transparency Benchmark is a strong reminder of how much waste still exists in open-web buying. It reports that benchmark participants directed 41% of programmatic budgets to “effective” impressions meeting core quality requirements, while also estimating a sizeable optimization opportunity remains. In other words: a lot of spend can still land on impressions that don’t meet basic measurability/viewability expectations, which will drag down your true completed-view efficiency.
In this channel, CPCV improves when you improve:
supply path and publisher selection (avoid long-tail junk),
viewability and measurement rates,
contextual alignment (the video is actually welcome there),
and creative fit for the placement (shorter isn’t always better, but mismatched length is expensive).
⚡ In programatic video, CPCV is often a quality metric in disguise.
CPCV in social video platforms
On social platforms, CPCV is shaped by feed behavior:
fast scrolling,
sound-off viewing,
heavy competition for attention,
and short-form formats that reward immediate clarity.
Also, social platforms may optimize toward proprietary events that behave like “completion,” but aren’t always 100% watched. That’s not bad—it just means your reporting must define the event precisely.
A practical way to think about CPCV in social:
It’s as much a creative diagnostic as a buying KPI.
If completion improves after a creative change, you likely made the opening seconds clearer, the pacing tighter, or the message more relevant.
For YouTube-style environments, Pixability’s 2026 benchmarks outline how completion rates can vary significantly by format (for example, skippable vs non-skippable), which is exactly why CPCV should be interpreted alongside format selection.
💡 If your plan includes YouTube on TV screens and living-room viewing behavior, AI Digital’s YouTube TV ads piece is a useful internal reference.
CPCV in DOOH
DOOH is the hardest place to treat CPCV literally, because the environment is physical:
people move,
screens compete with the real world,
and “viewed to completion” is rarely measured in a one-to-one way the way it is online.
That doesn’t mean CPCV is useless in DOOH. It means you typically interpret it through proxies, such as:
confirmed play-out (the creative ran for its full duration),
impression models based on location/time/traffic,
and (where available) attention or verification layers.
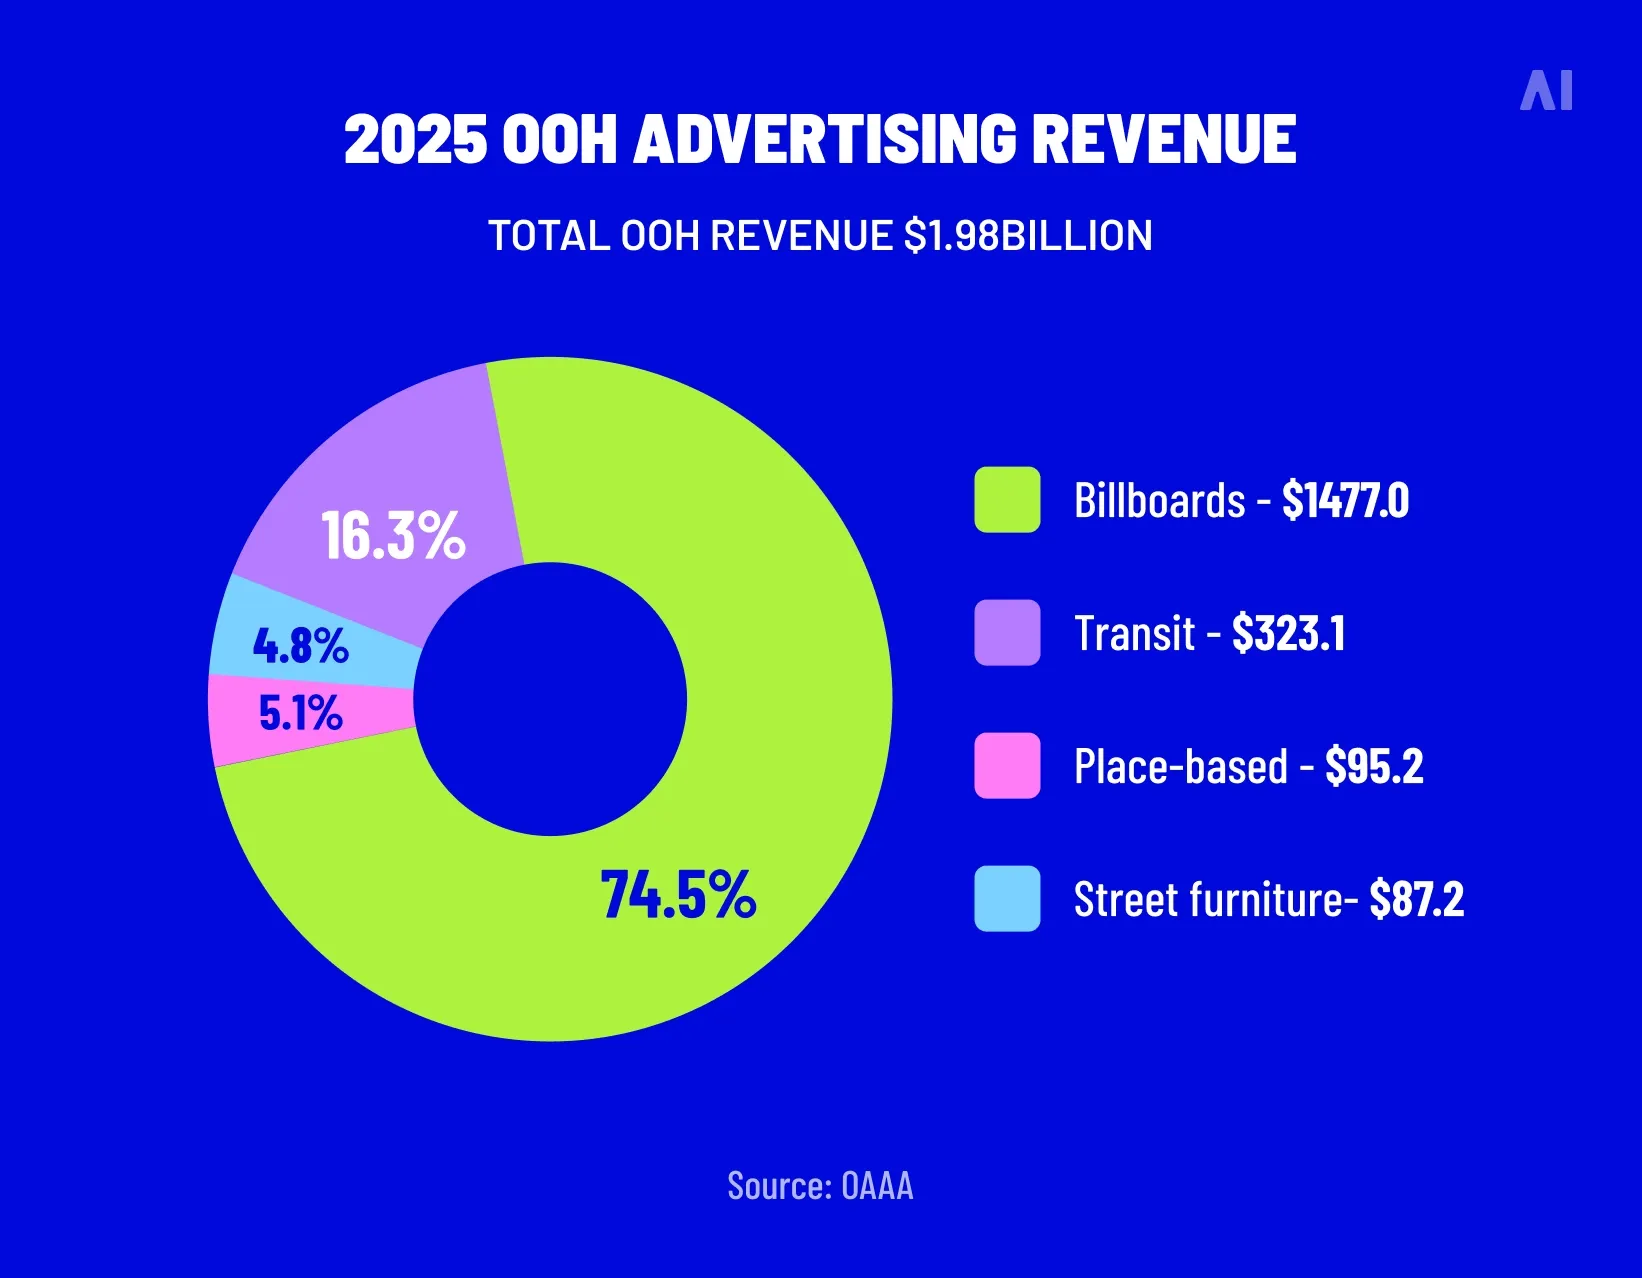
From a market standpoint, IAB projected U.S. DOOH ad revenue to reach $3B in 2025, which underlines why more teams are trying to standardize performance expectations in the channel.
CPCV: $12,000 ÷ 300,000 = $0.04 per completed view
There’s also a helpful way to connect CPCV to CPM and completion rate:
CPCV ≈ (CPM ÷ 1000) ÷ Completion rate
So if your CPM is $20 and your completion rate is 50% (0.5), then:
CPCV ≈ (20/1000) / 0.5 = 0.02 / 0.5 = $0.04
This is useful for planning because it shows why CPCV is not just a “creative metric.” It’s also a pricing-and-quality metric.
The ANA benchmark includes CPM breakdowns across buying types (open market vs PMPs, etc.), which can help you build realistic planning scenarios before you ever launch.
⚡ If you know CPM and completion rate, you can usually predict CPCV before you spend the first dollar.
{{26-What-Is-CPCV-Cost Per Completed View-SEO-2="/tables"}}
CPCV is most useful when you treat it as a message-delivery efficiency metric. It tells you what you paid to get viewers to the end of the ad. That’s valuable, but it doesn’t tell you everything.
A practical way to use CPCV is as a “second lens” next to the KPI you’re already optimizing toward (reach, views, conversions). It helps you answer: are we paying for real consumption, or just delivery?
{{26-What-Is-CPCV-Cost Per Completed View-SEO-3="/tables"}}
Below is how CPCV relates to the metrics it’s most often confused with, plus how to use each without tripping over definitions.
CPV usually charges when someone meets a minimum viewing threshold. That threshold varies by platform, but it’s typically seconds watched or a short view event, not necessarily the full ad. CPV is designed for scale. It’s a good way to buy lots of “initial attention” efficiently.
CPCV is stricter. It optimizes for the viewer finishing the message, which makes it better when the ending matters.
So when CPCV is “too high,” it’s usually one of two problems:
CPV is expensive (you’re paying a lot for starts), or
completion rate is weak (the ad or placement loses people before the end).
Use CPV when:
You want efficient top-of-funnel reach with light exposure.
The creative is long and you’re comfortable paying for partial attention.
The platform’s “view” threshold is a meaningful engagement signal for your goal (for example, you care about initial message pickup, not full story completion).
Use CPCV when:
The end of the ad matters (brand reveal, offer, CTA, story payoff).
You’re running sequential messaging and need completion as a gating signal (“only show ad #2 to people who finished ad #1”).
You’re comparing placements where view thresholds vary and you want a more consistent definition of “delivered message.”
A good guardrail approach: optimize to CPV for scale, but monitor CPCV to ensure you’re not buying cheap “views” that never reach the point of the ad.
{{26-What-Is-CPCV-Cost Per Completed View-SEO-4="/tables"}}
CPCV vs CPM
CPM tells you what it costs to deliver 1,000 impressions, regardless of whether the video was watched or finished. It’s a delivery metric.
CPCV answers a different question: what did it cost to get the full message consumed?
They connect through completion rate:
CPCV ≈ (CPM ÷ 1000) ÷ completion rate
Example:
CPM = $20
completion rate = 50% (0.50)
CPCV ≈ ($20 ÷ 1000) ÷ 0.50 = $0.02 ÷ 0.50 = $0.04
This is why CPCV is such a useful “truth test” for CPM. You can have a decent CPM and still end up with an ugly CPCV if completion is weak.
CPM is still essential for:
Reach and frequency planning.
Cross-channel media mix modeling.
Forecasting and budget allocation.
CPCV helps you sanity-check whether CPM is buying:
Actual message delivery (high completion, stable CPCV), or
Theoretical opportunity (impressions that don’t translate into finishes).
CPA is lower-funnel. It measures what you paid for a desired action: purchase, signup, lead, install.
CPCV is upper/mid-funnel by nature, but it can still support performance goals when you use it correctly. Think of CPCV as a way to improve the inputs to performance, not as a replacement for performance itself.
CPCV can support CPA by:
Improving exposure quality before retargeting. If your retargeting pool is built from people who actually finished the ad, you often get a cleaner signal than “someone had an impression.”
Acting as a pre-qualification signal in sequential messaging. You can reserve deeper, more direct-response creative for people who demonstrated attention.
Identifying which creative versions actually land. If Creative A has a meaningfully better CPCV (and completion rate), it’s often the better candidate to scale into performance testing.
The common mistake: Treating CPCV as the goal when the business goal is acquisition.
CPCV tells you you paid for attention. It does not tell you that attention converted. The smart way to pair them is:
Use CPCV (and completion rate) to keep your video layer honest.
Use CPA/ROAS to confirm whether that attention translates into outcomes.
What is a good or bad CPCV?
A “good” CPCV is not a single universal number. It depends on:
what “completed” means in your platform,
your video length,
the format (skippable vs non-skippable),
the audience and targeting tightness,
and the inventory quality.
A practical benchmark method that works across brands:
Benchmark within channel first, then compare across channels only after normalizing definitions.
Segment CPCV by creative length (6s, 15s, 30s) and format.
Evaluate CPCV alongside waste indicators, not in isolation.
Why the “waste indicators” point matters: both the ANA programmatic benchmark and DV’s streaming research highlight how measurability gaps, transparency limitations, and invalid traffic can inflate the apparent efficiency of delivery metrics.
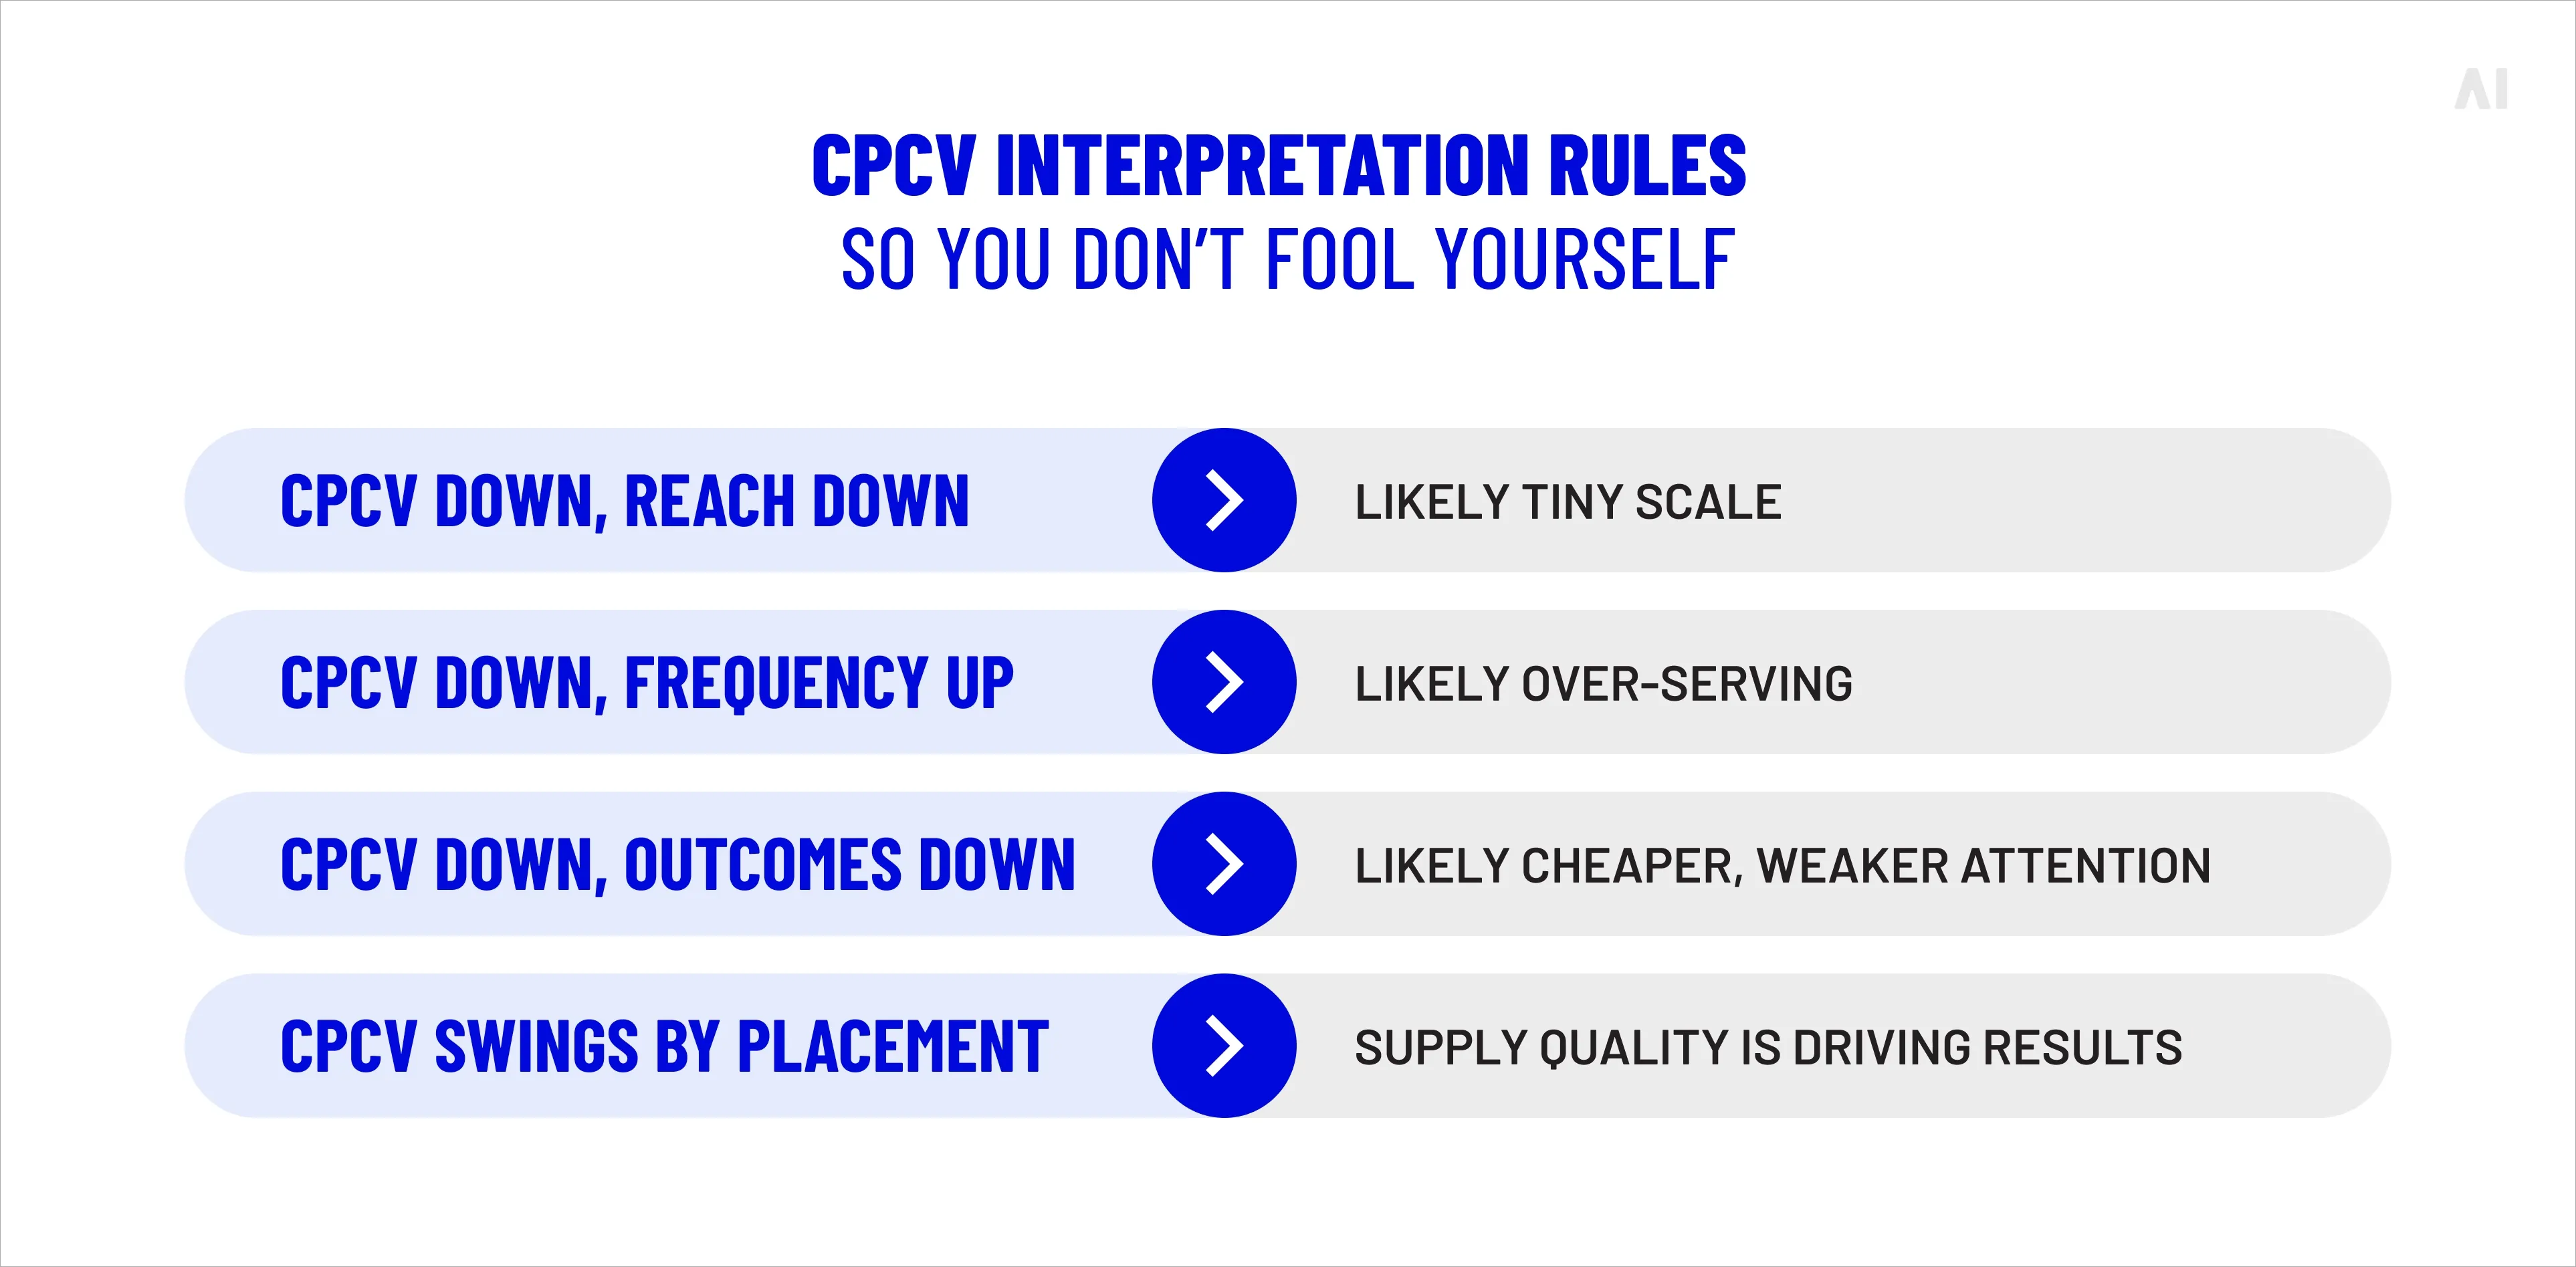
“Good” CPCV tends to look like this:
CPCV improves without a collapse in reach (you didn’t just buy tiny scale).
Completion improves and brand/site lift signals hold steady or rise.
The placements driving low CPCV also show acceptable transparency and quality.
“Bad” CPCV tends to look like this:
CPCV drops, but frequency spikes (you’re grinding the same audience).
CPCV drops, but downstream KPIs weaken (you bought cheap completion, not meaningful attention).
CPCV drops mainly due to questionable supply (poor transparency or low-quality inventory signals).
Who Benefits from CPCV — and Why
CPCV is one of the few video metrics that both brand and performance teams can use without talking past each other.
CPCV benefits for brands
For brand-led campaigns, CPCV helps you:
validate that storytelling creative is actually being consumed,
compare message delivery across premium CTV, social, and open-web video,
and diagnose when “reach” is being bought at the cost of real attention.
It’s also useful when you’re running multiple creatives and need a quick, comparable signal for which versions keep viewers watching.
CPCV benefits for agencies
For agencies and planners, CPCV helps you:
standardize reporting across fragmented video buys,
justify budget shifts with a metric clients immediately understand,
It also plays well in cross-channel planning workflows where you need a single metric that reflects delivery quality, not just delivery volume.
When should you optimize for CPCV?
Optimizing toward CPCV makes the most sense when your goal depends on viewers consuming a complete message, not just being exposed to it.
Common scenarios:
Product launches and brand storytelling: This is where the payoff is late in the creative (the reveal, the proof point, the offer). If your strongest moment is in the last third of the ad, CPCV protects you from paying for “almost watched.”
Consideration campaigns: If the message needs a full explanation (how it works, why it’s different, what to do next), completions matter more than raw impressions. CPCV helps you prioritize placements and audiences that actually stick with the story.
Sequential messaging: CPCV becomes especially practical when completion is a gating rule. YouTube’s video ad sequencing, for example, explicitly lets you move viewers through steps based on impressions, views, or skips, so “watched vs didn’t watch” can be used as a progression signal.
CTV video built to support performance: If you’re using CTV to feed retargeting pools or lift studies, CPCV is a clean way to pressure-test whether you’re buying real message delivery (not just “served” ads). It’s not a replacement for CPA, but it can improve the quality of the upstream exposure that performance work depends on.
Best practices to improve your CPCV
Before you start tweaking bids or swapping platforms, it’s worth remembering what CPCV really reflects: the cost of holding attention long enough to finish the ad. That means improvements usually come from the basics—how the creative is built, where it runs, who sees it, and how often they’re exposed. Start with the levers that change completion behavior, then use buying tactics to scale what’s already working.
{{26-What-Is-CPCV-Cost Per Completed View-SEO-5="/tables"}}
Creative optimization
Most CPCV gains come from creative fundamentals. In practice, CPCV gets better when completion rate improves for the same (or similar) media cost.
What reliably helps:
Put the premise in the first seconds (don’t “warm up” too long). A lot of the battle is simply keeping someone past the opening. In creator-style environments, WARC reported that only 14% of creator ads were watched past the first three seconds. That’s why the first beat matters so much.
Make the brand readable early, then reinforce later. WARC also noted that when creator ads include a brand in the first three seconds, it’s associated with a +16% impact on video view completion and 13% lower CPV. It’s a helpful reminder that “authentic” and “clear branding” don’t need to be opposites.
Design for sound-off where relevant (captions, clear supers). Don’t assume audio carries the message, especially in scrollable placements.
Cut versions by length and context. A 15s and a 30s are different products. They drop off differently, they pace differently, and they often win in different inventory.
Test openings more aggressively than endings. Openings drive completion. Endings polish the message for the people who already stayed.
Targeting and inventory quality
In many cases, CPCV improves because you stopped buying “completion” in places where people never had a real chance to watch, or where measurement is too weak to trust the metric.
Concrete steps:
Use allowlists for high-performing publishers/apps. This is the simplest way to reduce long-tail waste and stabilize completion rates.
Prefer PMPs or curated supply when it improves transparency and control. You’re not just buying media, you’re buying conditions: viewability, clean reporting, consistent playback, fewer surprises.
Audit long-tail placements regularly. The ANA’s Q1 2025 Programmatic Transparency Benchmark found that participants directed 41% of programmatic budgets to “effective ad impressions,” and the report’s TrueCPM Index indicated a 37.8% optimization gap tied to quality basics like non-IVT, measurability, and viewability. That’s exactly the kind of leakage that can distort CPCV if left unmanaged.
Treat measurability and viewability as prerequisites for “completed” meaning anything. If you can’t reliably measure viewability, a completion event is a weak signal. The IAB/MRC attention guidance is blunt here: attention-style metrics should meet minimum viewability standards, and anything reported before viewability should be flagged as diagnostic.
In CTV, apply safeguards for transparency and fraud. DV’s 2025 streaming research highlights that only 50% of CTV impressions offered full app transparency in 2024, and it calls out issues like “TV Off” waste and bot-driven fraud that can inflate delivery metrics if you don’t filter aggressively.
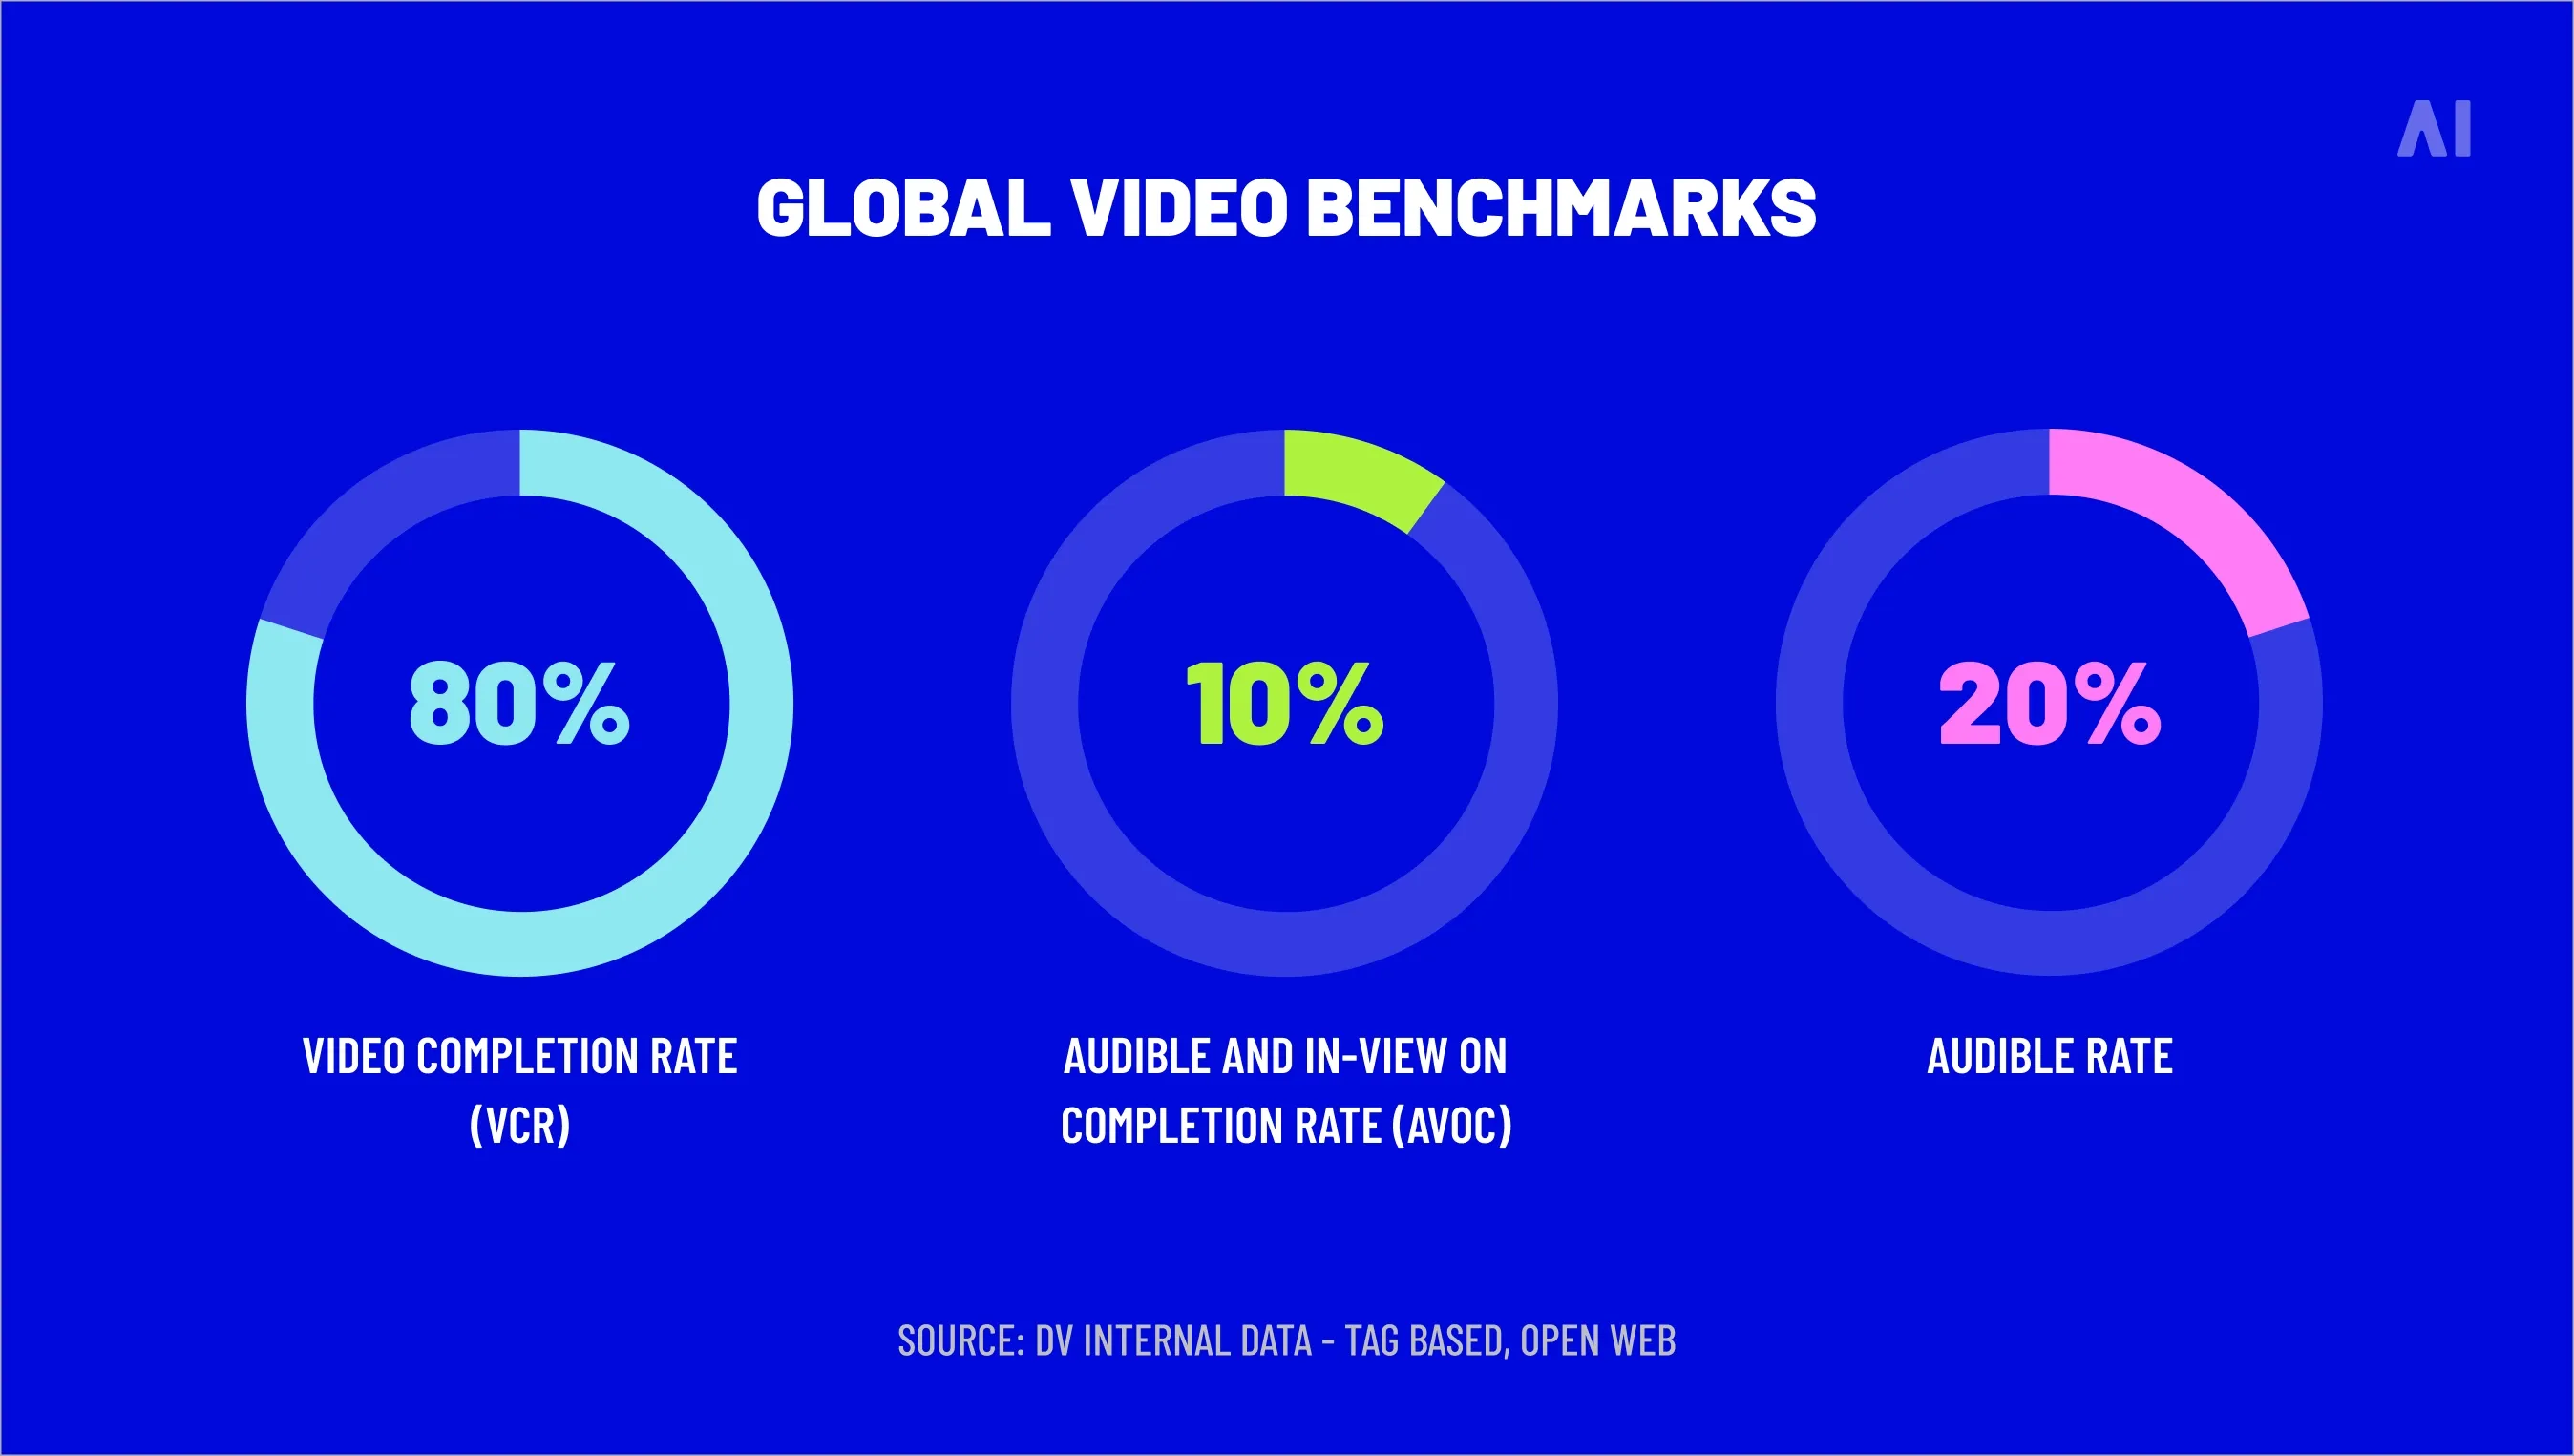
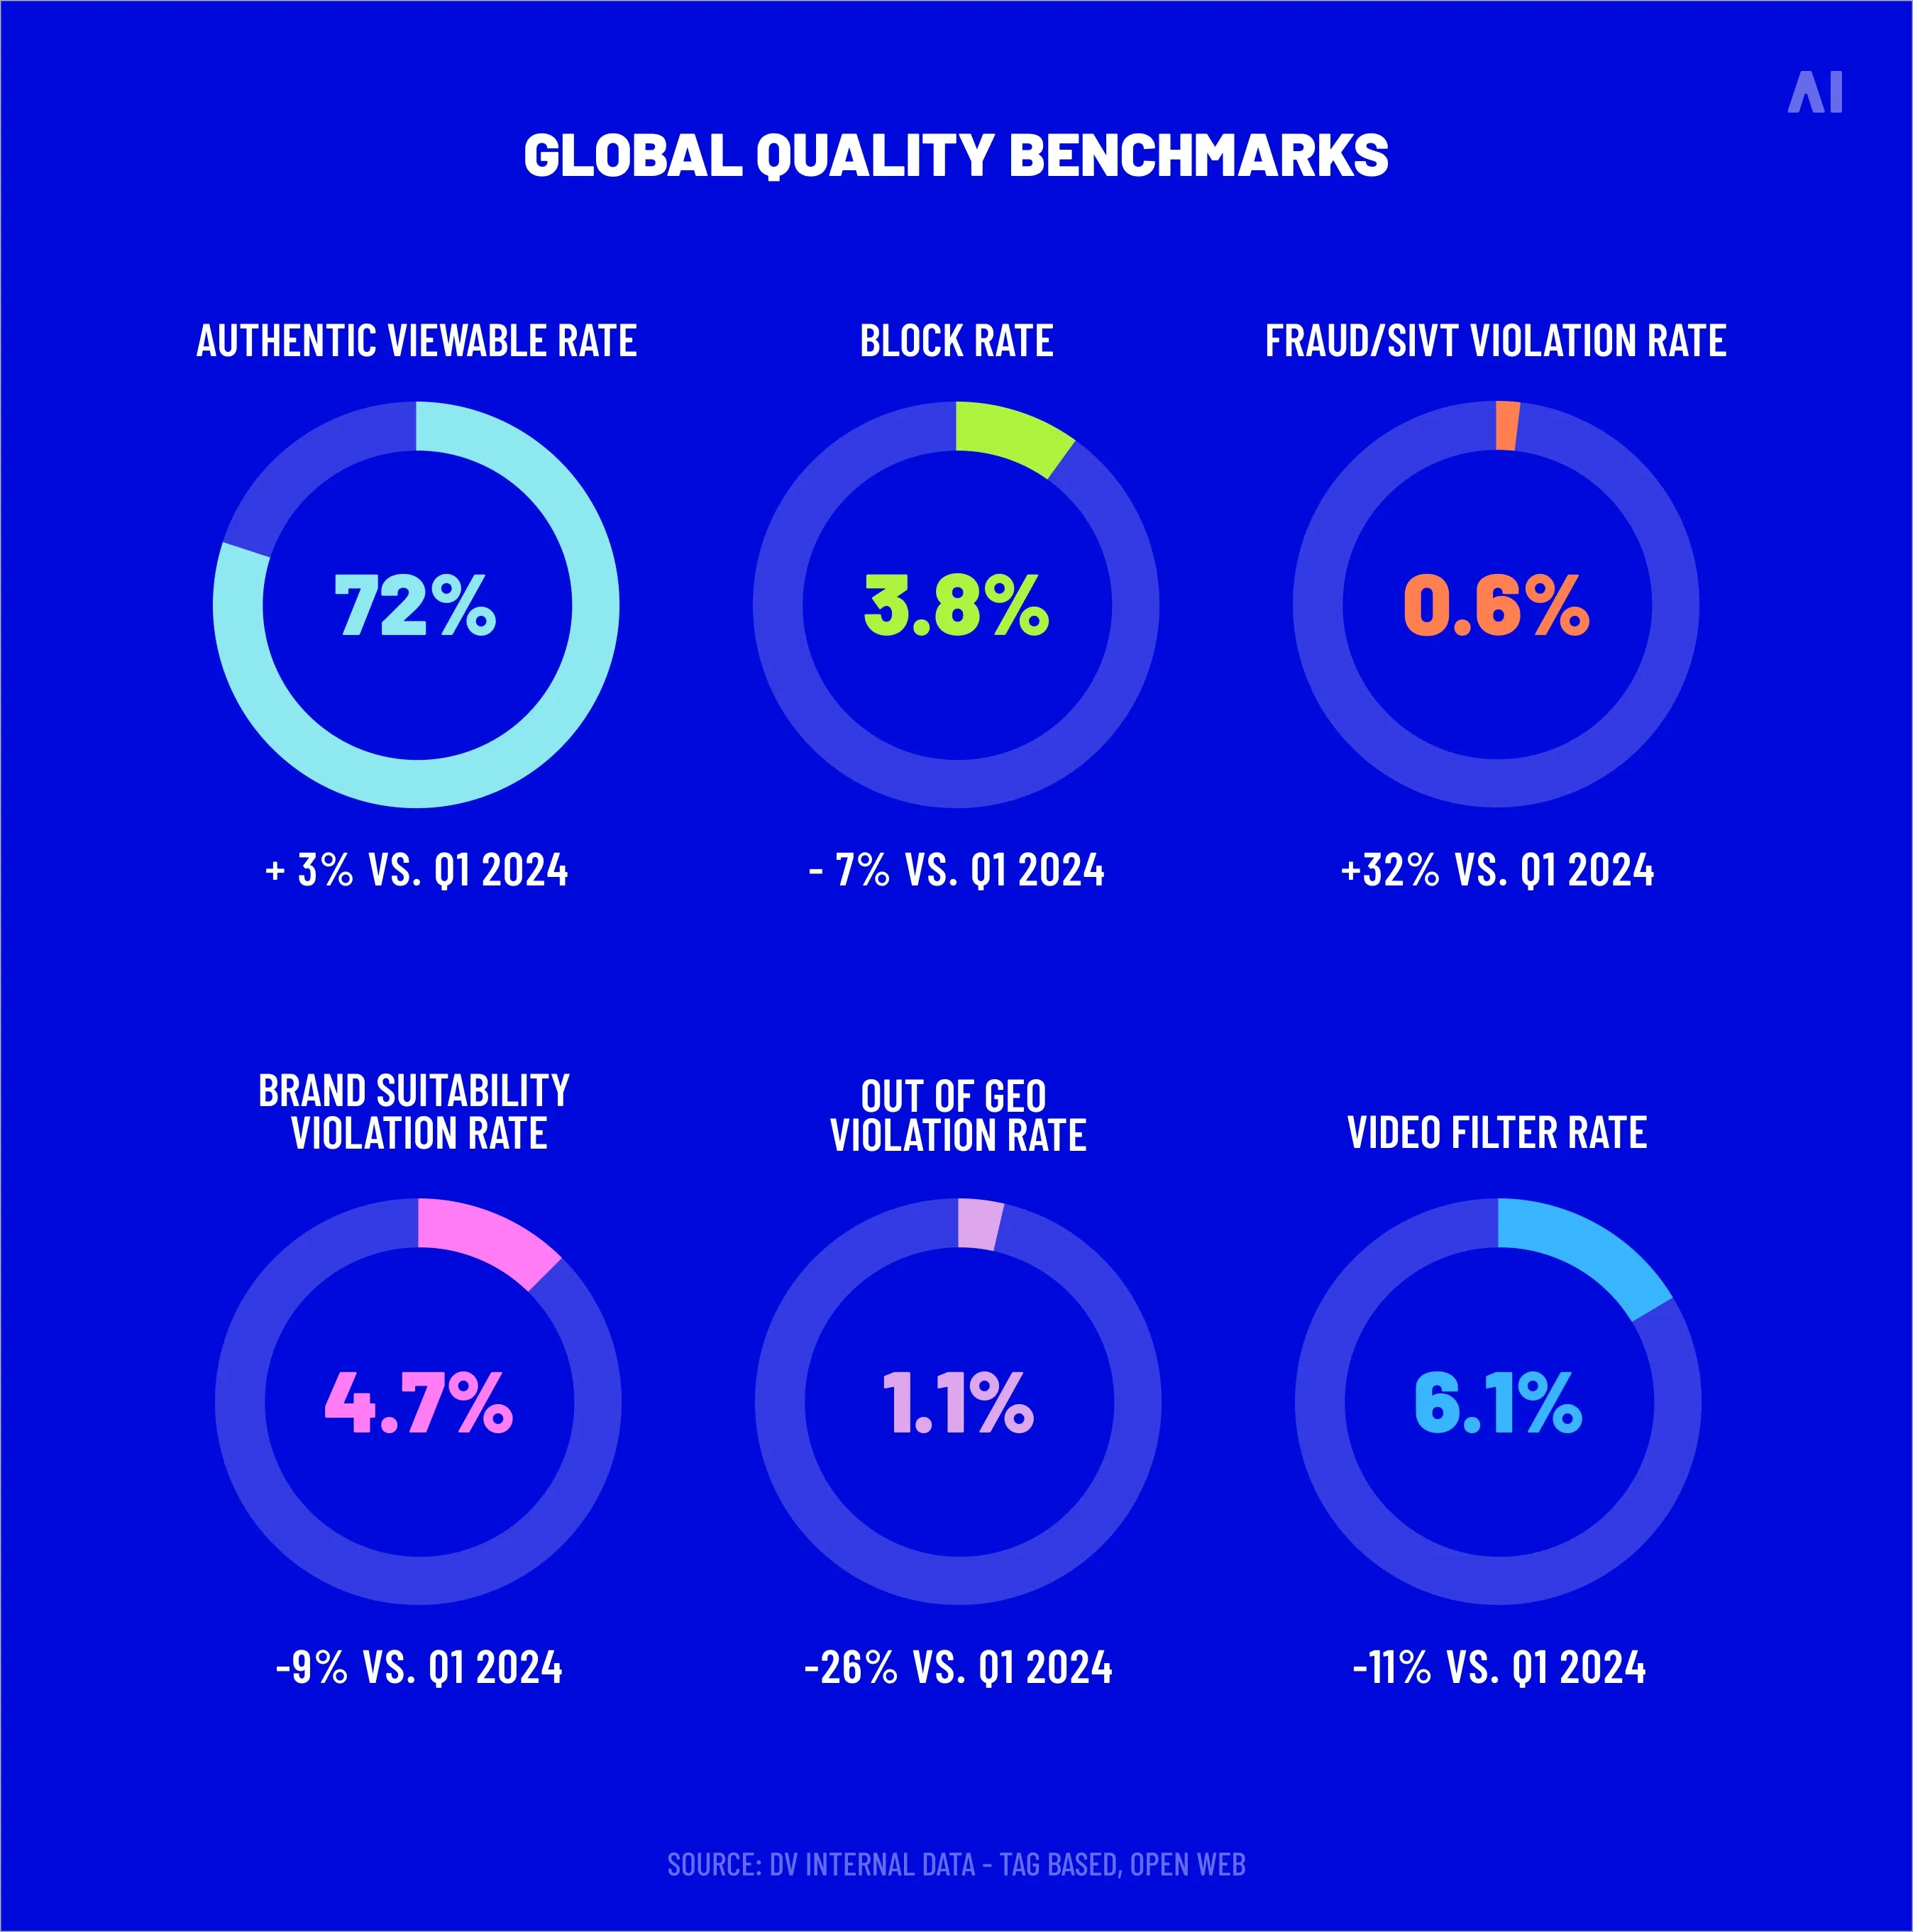
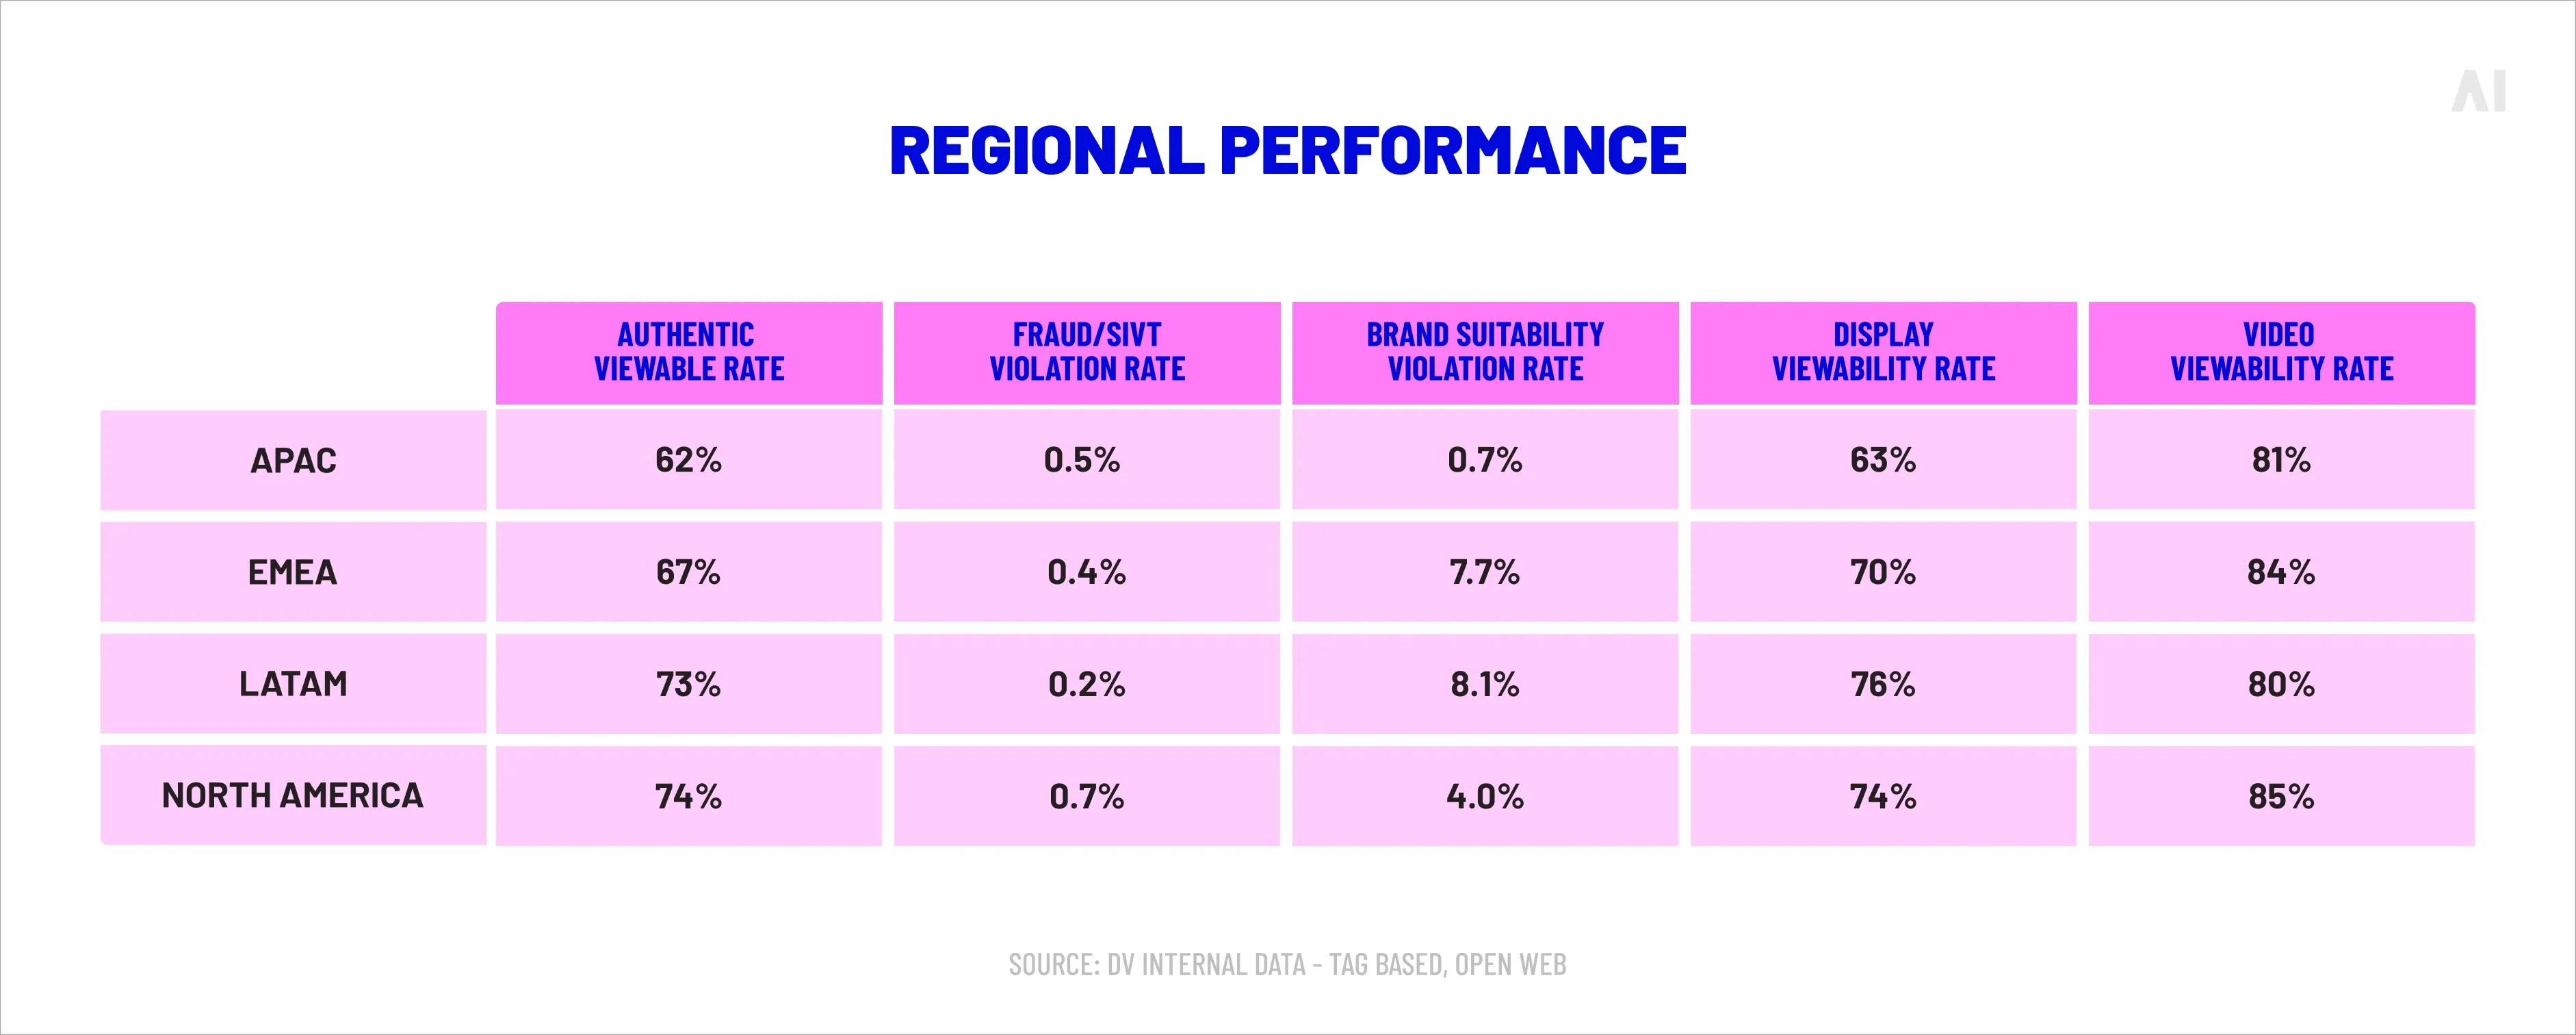
⚡ In DV’s Q1 2025 benchmarks for North America (open web, tag-based), the video viewable rate is 85% and the fraud/SIVT violation rate is 0.7%. Benchmarks like this give you a reality check for what “good” can look like—then your job is to avoid buying below it.
High completion can still be wasteful if it’s driven by repetition. CPCV can look “healthy” while the campaign is quietly overserving the same households.
To protect CPCV from frequency inflation:
Set frequency caps appropriate to the channel.Innovid’s 2025 CTV benchmarks are a good reality check: the average CTV campaign reached 19.64% of households with an average frequency of 7.09, and higher-investment campaigns pushed frequency into 10+. That’s where completion can remain high but efficiency can quietly degrade.
Rotate creatives before fatigue sets in. If completion starts to slip at higher frequencies, creative fatigue is often the culprit, not the bid.
Use sequencing to reward completion with the next message. This is where completion becomes functional. YouTube sequencing also has a built-in default cap (one sequence per person per 7 days), which is a decent starting point for “don’t spam the same storyline.”
Review CPCV by frequency bucket. 1–2 exposures vs 6–8 exposures usually tells the real story.
Platform and format selection
Some formats are structurally more completion-friendly than others. The trick is to choose formats where “completion” aligns with the real viewing experience (full-screen, intentional viewing, fewer accidental plays).
A practical way to frame this is: how easy is it for someone to leave mid-ad? That single question often predicts completion behavior.
For YouTube specifically, Pixability’s 2026 benchmarks illustrate how much completion varies by format: skippable in-stream typically lands at 60%+ VCR, while non-skippable in-stream is 90%+, and bumpers tend to be 90–95%+. That kind of spread is why CPCV comparisons across formats only make sense when you control for “what completion even looks like here.”
CPCV reporting gets much easier when you standardize the way you present it and pair it with the metrics that explain why CPCV moved.
A clean reporting structure:
Define the completion event clearly. “100% watched” sounds obvious, but confirm the platform’s event definition and whether it’s based on quartiles, player signals, or other criteria.
Completion rate / VCR. DV defines VCR as the percentage of video ads that play through their entire duration to completion.
Viewability and measurability. DV also restates the IAB/MRC viewability baseline (50% pixels in view for 2 seconds for video) which helps keep “completed view” grounded in viewable reality.
Audible/in-view context where available. DV’s glossary includes “audible rate” and “audible and in-view on completion” style metrics, which can be useful for explaining why completion is high (or suspiciously high).
Downstream KPIs: site visits, CPA, lift, etc., so CPCV doesn’t become the goal by accident.
Break down CPCV by:
Creative (and length)
Audience segment
Placement/app/site
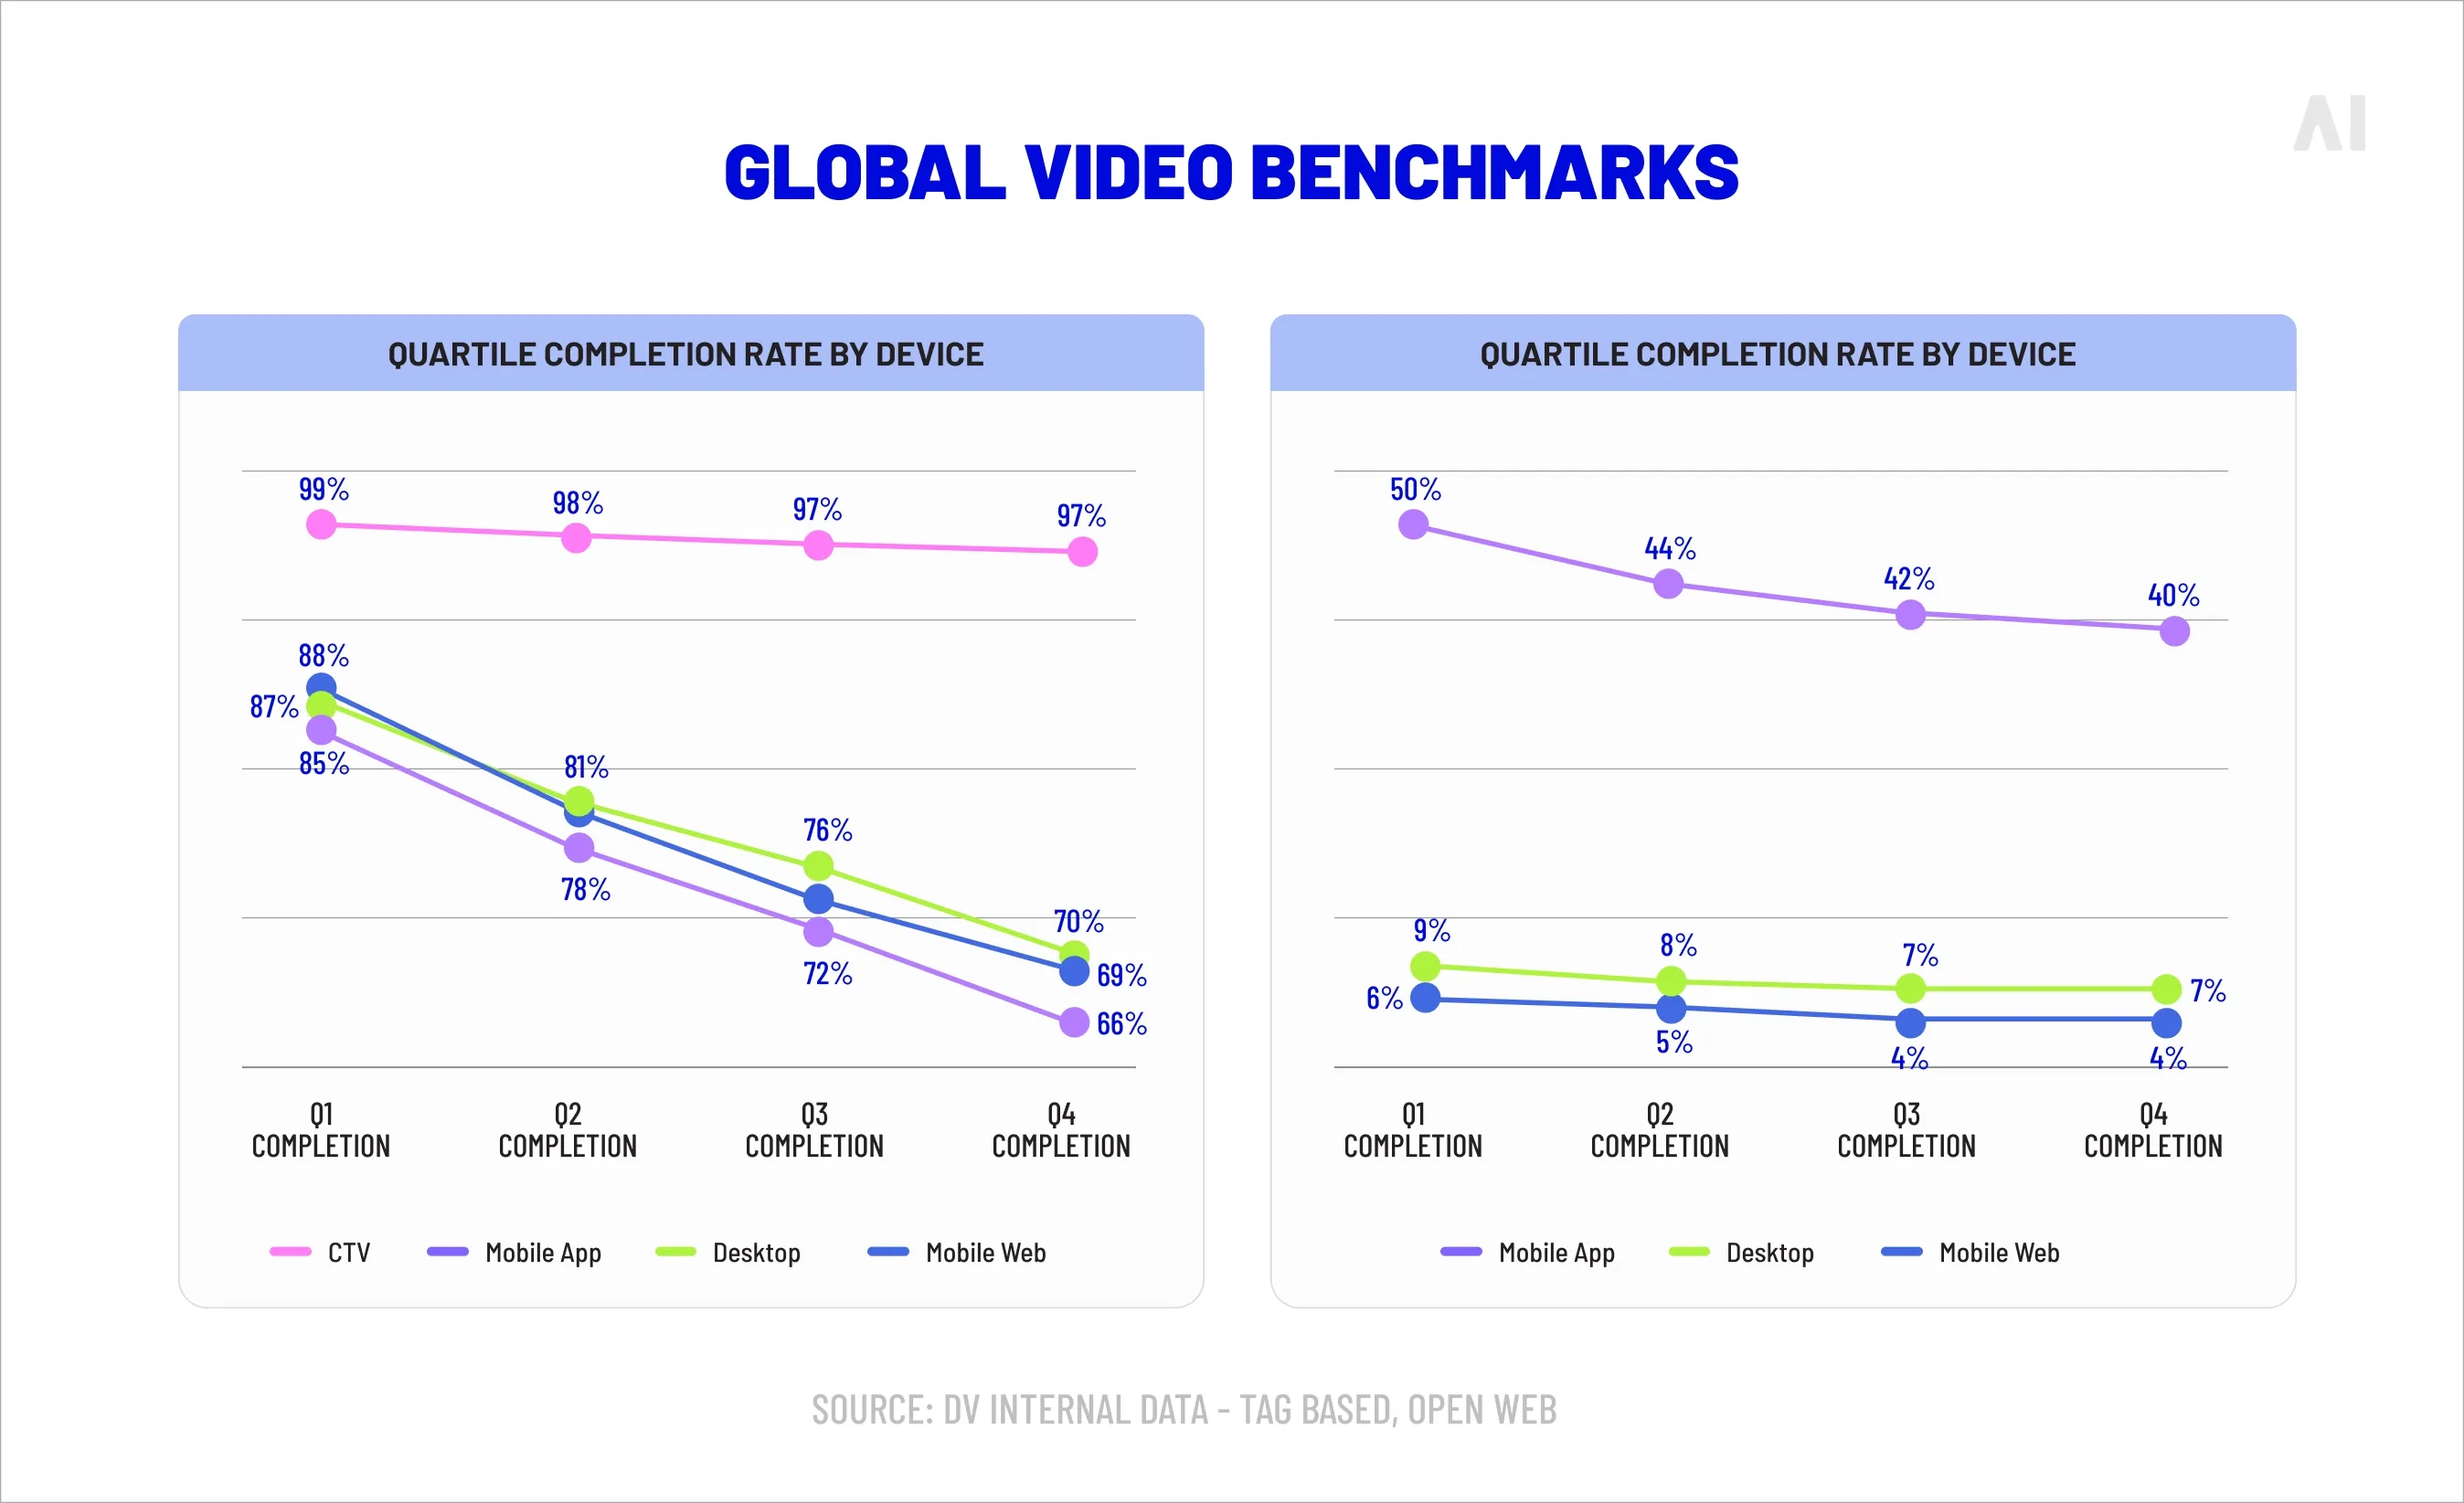
Device environment (CTV vs mobile vs desktop)
Call out quality risks explicitly. This is where you reference the same issues mentioned previously: long-tail waste, measurability gaps, and (in CTV) transparency and invalid traffic risks that can distort delivery metrics.
Translate CPCV into an outcome narrative. Aim for: “We reduced CPCV by increasing completion at the same reach,” not “we reduced CPCV by buying cheaper inventory.” The first implies better delivery. The second might just be lower-quality supply.
Conclusion: Driving better video performance with CPCV
CPCV works because it forces a more honest question than most video dashboards do: did people stay long enough to receive the full message? When you track (and optimize toward) completed views, you stop rewarding “almost watched” delivery and start rewarding placements, audiences, and creative that earn attention all the way through.
Used properly, CPCV also makes cross-channel video easier to manage. CTV and OTT may deliver strong completion by default, but you still need to validate quality and avoid waste. Programmatic video can swing from excellent to awful depending on supply and player context. Social can deliver huge volume, but completion depends heavily on the opening seconds and format fit. DOOH adds reach and presence, but “completion” must be defined carefully so you don’t compare apples to billboards.
AI-driven optimization is what ties this together. The practical role of AI here isn’t magic. It’s discipline at scale:
Finding the inventory and contexts where completion is real and repeatable (not accidental or low-quality).
Shifting spend toward creatives and segments that hold attention based on live performance signals.
Managing frequency and sequencing so high completion doesn’t turn into repetitive waste.
Making reporting cleaner by standardizing definitions and surfacing the drivers behind CPCV movement (creative, placement, audience, device).
If you want CPCV to translate into better media efficiency and ROI, treat it as a working system, not a single number. Define completion clearly, pair CPCV with completion rate and quality indicators, and use it to guide decisions that actually change outcomes: creative structure, supply selection, and exposure strategy.
To go deeper on how AI is changing optimization and measurement across channels, see AI in digital marketing
And for broader planning context, including how budgets and channels are evolving, the 2026 media trends report is a strong companion read
If you’d like help applying CPCV across CTV, programmatic video, social, and DOOH—setting benchmarks, cleaning up reporting, or building an optimization playbook—get in touch with AI Digital. We can pressure-test your measurement approach and help you turn completed views into more efficient video performance.
Blind spot
Key issues
Business impact
AI Digital solution
Lack of transparency in AI models
• Platforms own AI models and train on proprietary data • Brands have little visibility into decision-making • "Walled gardens" restrict data access
• Inefficient ad spend • Limited strategic control • Eroded consumer trust • Potential budget mismanagement
Open Garden framework providing: • Complete transparency • DSP-agnostic execution • Cross-platform data & insights
Optimizing ads vs. optimizing impact
• AI excels at short-term metrics but may struggle with brand building • Consumers can detect AI-generated content • Efficiency might come at cost of authenticity
• Short-term gains at expense of brand health • Potential loss of authentic connection • Reduced effectiveness in storytelling
Smart Supply offering: • Human oversight of AI recommendations • Custom KPI alignment beyond clicks • Brand-safe inventory verification
The illusion of personalization
• Segment optimization rebranded as personalization • First-party data infrastructure challenges • Personalization vs. surveillance concerns
• Potential mismatch between promise and reality • Privacy concerns affecting consumer trust • Cost barriers for smaller businesses
Elevate platform features: • Real-time AI + human intelligence • First-party data activation • Ethical personalization strategies
AI-Driven efficiency vs. decision-making
• AI shifting from tool to decision-maker • Black box optimization like Google Performance Max • Human oversight limitations
• Strategic control loss • Difficulty questioning AI outputs • Inability to measure granular impact • Potential brand damage from mistakes
Managed Service with: • Human strategists overseeing AI • Custom KPI optimization • Complete campaign transparency
Fig. 1. Summary of AI blind spots in advertising
Dimension
Walled garden advantage
Walled garden limitation
Strategic impact
Audience access
Massive, engaged user bases
Limited visibility beyond platform
Reach without understanding
Data control
Sophisticated targeting tools
Data remains siloed within platform
Fragmented customer view
Measurement
Detailed in-platform metrics
Inconsistent cross-platform standards
Difficult performance comparison
Intelligence
Platform-specific insights
Limited data portability
Restricted strategic learning
Optimization
Powerful automated tools
Black-box algorithms
Reduced marketer control
Fig. 2. Strategic trade-offs in walled garden advertising.
Core issue
Platform priority
Walled garden limitation
Real-world example
Attribution opacity
Claiming maximum credit for conversions
Limited visibility into true conversion paths
Meta and TikTok's conflicting attribution models after iOS privacy updates
Data restrictions
Maintaining proprietary data control
Inability to combine platform data with other sources
Amazon DSP's limitations on detailed performance data exports
Cross-channel blindspots
Keeping advertisers within ecosystem
Fragmented view of customer journey
YouTube/DV360 campaigns lacking integration with non-Google platforms
Black box algorithms
Optimizing for platform revenue
Reduced control over campaign execution
Self-serve platforms using opaque ML models with little advertiser input
Performance reporting
Presenting platform in best light
Discrepancies between platform-reported and independently measured results
Consistently higher performance metrics in platform reports vs. third-party measurement
Fig. 1. The Walled garden misalignment: Platform interests vs. advertiser needs.
Key dimension
Challenge
Strategic imperative
ROAS volatility
Softer returns across digital channels
Shift from soft KPIs to measurable revenue impact
Media planning
Static plans no longer effective
Develop agile, modular approaches adaptable to changing conditions
Brand/performance
Traditional division dissolving
Create full-funnel strategies balancing long-term equity with short-term conversion
Capability
Key features
Benefits
Performance data
Elevate forecasting tool
• Vertical-specific insights • Historical data from past economic turbulence • "Cascade planning" functionality • Real-time adaptation
• Provides agility to adjust campaign strategy based on performance • Shows which media channels work best to drive efficient and effective performance • Confident budget reallocation • Reduces reaction time to market shifts
• Dataset from 10,000+ campaigns • Cuts response time from weeks to minutes
• Reaches people most likely to buy • Avoids wasted impressions and budgets on poor-performing placements • Context-aligned messaging
• 25+ billion bid requests analyzed daily • 18% improvement in working media efficiency • 26% increase in engagement during recessions
Full-funnel accountability
• Links awareness campaigns to lower funnel outcomes • Tests if ads actually drive new business • Measures brand perception changes • "Ask Elevate" AI Chat Assistant
• Upper-funnel to outcome connection • Sentiment shift tracking • Personalized messaging • Helps balance immediate sales vs. long-term brand building
• Natural language data queries • True business impact measurement
Open Garden approach
• Cross-platform and channel planning • Not locked into specific platforms • Unified cross-platform reach • Shows exactly where money is spent
• Reduces complexity across channels • Performance-based ad placement • Rapid budget reallocation • Eliminates platform-specific commitments and provides platform-based optimization and agility
• Coverage across all inventory sources • Provides full visibility into spending • Avoids the inability to pivot across platform as you’re not in a singular platform
Fig. 1. How AI Digital helps during economic uncertainty.
Trend
What it means for marketers
Supply & demand lines are blurring
Platforms from Google (P-Max) to Microsoft are merging optimization and inventory in one opaque box. Expect more bundled “best available” media where the algorithm, not the trader, decides channel and publisher mix.
Walled gardens get taller
Microsoft’s O&O set now spans Bing, Xbox, Outlook, Edge and LinkedIn, which just launched revenue-sharing video programs to lure creators and ad dollars. (Business Insider)
Retail & commerce media shape strategy
Microsoft’s Curate lets retailers and data owners package first-party segments, an echo of Amazon’s and Walmart’s approaches. Agencies must master seller-defined audiences as well as buyer-side tactics.
AI oversight becomes critical
Closed AI bidding means fewer levers for traders. Independent verification, incrementality testing and commercial guardrails rise in importance.
Fig. 1. Platform trends and their implications.
Metric
Connected TV (CTV)
Linear TV
Video Completion Rate
94.5%
70%
Purchase Rate After Ad
23%
12%
Ad Attention Rate
57% (prefer CTV ads)
54.5%
Viewer Reach (U.S.)
85% of households
228 million viewers
Retail Media Trends 2025
Access Complete consumer behaviour analyses and competitor benchmarks.
Identify and categorize audience groups based on behaviors, preferences, and characteristics
Michaels Stores: Implemented a genAI platform that increased email personalization from 20% to 95%, leading to a 41% boost in SMS click through rates and a 25% increase in engagement.
Estée Lauder: Partnered with Google Cloud to leverage genAI technologies for real-time consumer feedback monitoring and analyzing consumer sentiment across various channels.
High
Medium
Automated ad campaigns
Automate ad creation, placement, and optimization across various platforms
Showmax: Partnered with AI firms toautomate ad creation and testing, reducing production time by 70% while streamlining their quality assurance process.
Headway: Employed AI tools for ad creation and optimization, boosting performance by 40% and reaching 3.3 billion impressions while incorporating AI-generated content in 20% of their paid campaigns.
High
High
Brand sentiment tracking
Monitor and analyze public opinion about a brand across multiple channels in real time
L’Oréal: Analyzed millions of online comments, images, and videos to identify potential product innovation opportunities, effectively tracking brand sentiment and consumer trends.
Kellogg Company: Used AI to scan trending recipes featuring cereal, leveraging this data to launch targeted social campaigns that capitalize on positive brand sentiment and culinary trends.
High
Low
Campaign strategy optimization
Analyze data to predict optimal campaign approaches, channels, and timing
DoorDash: Leveraged Google’s AI-powered Demand Gen tool, which boosted its conversion rate by 15 times and improved cost per action efficiency by 50% compared with previous campaigns.
Kitsch: Employed Meta’s Advantage+ shopping campaigns with AI-powered tools to optimize campaigns, identifying and delivering top-performing ads to high-value consumers.
High
High
Content strategy
Generate content ideas, predict performance, and optimize distribution strategies
JPMorgan Chase: Collaborated with Persado to develop LLMs for marketing copy, achieving up to 450% higher clickthrough rates compared with human-written ads in pilot tests.
Hotel Chocolat: Employed genAI for concept development and production of its Velvetiser TV ad, which earned the highest-ever System1 score for adomestic appliance commercial.
High
High
Personalization strategy development
Create tailored messaging and experiences for consumers at scale
Stitch Fix: Uses genAI to help stylists interpret customer feedback and provide product recommendations, effectively personalizing shopping experiences.
Instacart: Uses genAI to offer customers personalized recipes, mealplanning ideas, and shopping lists based on individual preferences and habits.
Medium
Medium
Share article
Url copied to clipboard
No items found.
Subscribe to our Newsletter
THANK YOU FOR YOUR SUBSCRIPTION
Oops! Something went wrong while submitting the form.
Questions? We have answers
Why does CPCV matter for modern video advertising?
CPCV matters because it ties spend to attention, not just delivery. The CPCV meaning is simple: you’re paying for a cost per completed view, which makes it easier to judge whether your video actually landed end to end across CTV, programmatic video, and social.
When should brands focus on CPCV instead of other KPIs?
Brands should prioritize CPCV when the goal depends on viewers consuming the full message, such as product launches, consideration campaigns, or sequential storytelling. If the objective is pure reach, CPM may be better; if it’s outcomes, CPA or cost per conversion is the right primary KPI, with CPCV as a supporting quality check.
Which video formats and platforms are most CPCV-friendly?
Formats that are full-screen, intentional, and less prone to accidental starts tend to be most CPCV-friendly, especially in CTV/OTT and other lean-back video environments. Short, well-matched formats on social can also perform well, but results depend heavily on the opening seconds and how the platform defines completion.
How can CPCV guide creative and targeting decisions?
CPCV is a diagnostic: if it improves after a creative change, the ad is holding attention better; if it improves after a targeting or inventory change, you likely found environments where people are more willing to watch. Use it to compare creative versions, placements, and audience segments, then scale what consistently lowers the cost per completed view without sacrificing reach quality.
What is cost per conversion?
Cost per conversion is the average amount you pay to generate one desired action, such as a purchase, signup, lead, or install. It’s a lower-funnel efficiency metric and is often referred to as CPA in many platforms.
How to calculate cost per conversion?
The cost per conversion formula is total spend divided by total conversions: Cost per conversion = Total cost ÷ Number of conversions. For example, if you spend $10,000 and drive 200 conversions, your cost per conversion is $50.
What's the difference between cost per completed view and cost per conversion?
Cost per completed view (CPCV) measures what you paid for someone to finish watching the ad, using the cost per completed view formula (spend ÷ completed views), while cost per conversion measures what you paid for the final action using the cost per conversion formula (spend ÷ conversions). In short, CPCV evaluates message delivery and attention; cost per conversion evaluates business outcomes.
Have other questions?
If you have more questions, contact us so we can help.
%20%E2%80%94%20and%20Why%20It%20Matters%20for%20Video%20Advertising.webp)

.svg)
.svg)