OLV Advertising: A Complete Guide to Boosting Engagement & ROI in 2026
Mary Gabrielyan
October 6, 2025
18
minutes read
Think of OLV advertising as the connective tissue in a modern video plan. It complements OTT and CTV, fills in daytime and mobile viewing, and gives you the data to refine quickly. We’ll show the how.
Online video advertising (OLV) represents far more than moving images on screens. It's become the primary vehicle for brand storytelling, customer engagement, and measurable business outcomes across every device consumers use.
Unlike traditional TV commercials that broadcast to passive audiences, OLV advertising creates interactive experiences that follow viewers from their morning smartphone scroll to their evening tablet browsing, collecting performance data and optimizing delivery at every step.
The format's rapid ascent stems from a fundamental shift in how people consume content. Viewers now expect video everywhere: embedded in articles, auto-playing in social feeds, streaming on connected TVs. This omnipresence gives advertisers unprecedented opportunities to reach audiences with relevant messages at precisely the right moments.
As programmatic technology advances and first-party data strategies mature, OLV advertising has evolved from experimental budget line item to essential marketing channel.
This article explains how OLV marketing fits with OTT and CTV, the formats that matter, how campaigns are set up and optimized, and the practices that consistently drive results in the U.S. market.
OLV meaning: What is OLV advertising?
Online video (OLV) advertising is the placement of video ads across internet-delivered environments such as websites, mobile apps, social platforms, and streaming services when viewed off the television screen. In practice, OLV covers in-stream ads that run before, during, or after a piece of video content; outstream units that play within articles or feeds; social video ads; and newer interactive or shoppable video formats.
OLV is often discussed alongside OTT and CTV, but they are not the same thing. OTT describes internet-delivered video content, while CTV refers to the connected television device on which that content is watched. OLV typically describes digital video ads on desktop and mobile, and it complements CTV in cross-screen plans.
Marketers pick OLV because it scales across screens, supplies granular controls (targeting, frequency, creative), and proves impact with near-real-time metrics. U.S. investment has followed that logic: industry reports show digital video capturing a majority share of TV/video budgets in 2025, while streaming usage set new highs—expanding the pool of ad-supported viewing that online video can reach.
OLV reaches people on phones, tablets, and computers, and complements CTV to build unduplicated reach across devices.
Research shows that campaigns using multiple screens see 41% better recall and 13% higher purchase intent compared to single-platform approaches.
In May 2025, streaming surpassed the combined share of broadcast and cable for the first time, underscoring where viewing time is shifting. Cross-media measurement initiatives (e.g., Nielsen ONE) are designed to de-duplicate audiences across publishers and platforms so planners can manage frequency and incremental reach with confidence.
📍 What this means for plans: pair OLV (desktop/mobile/app) with CTV to extend reach beyond the living-room screen, manage frequency across touchpoints, and pick up audiences that stream on mobile at different dayparts.
High engagement & attention
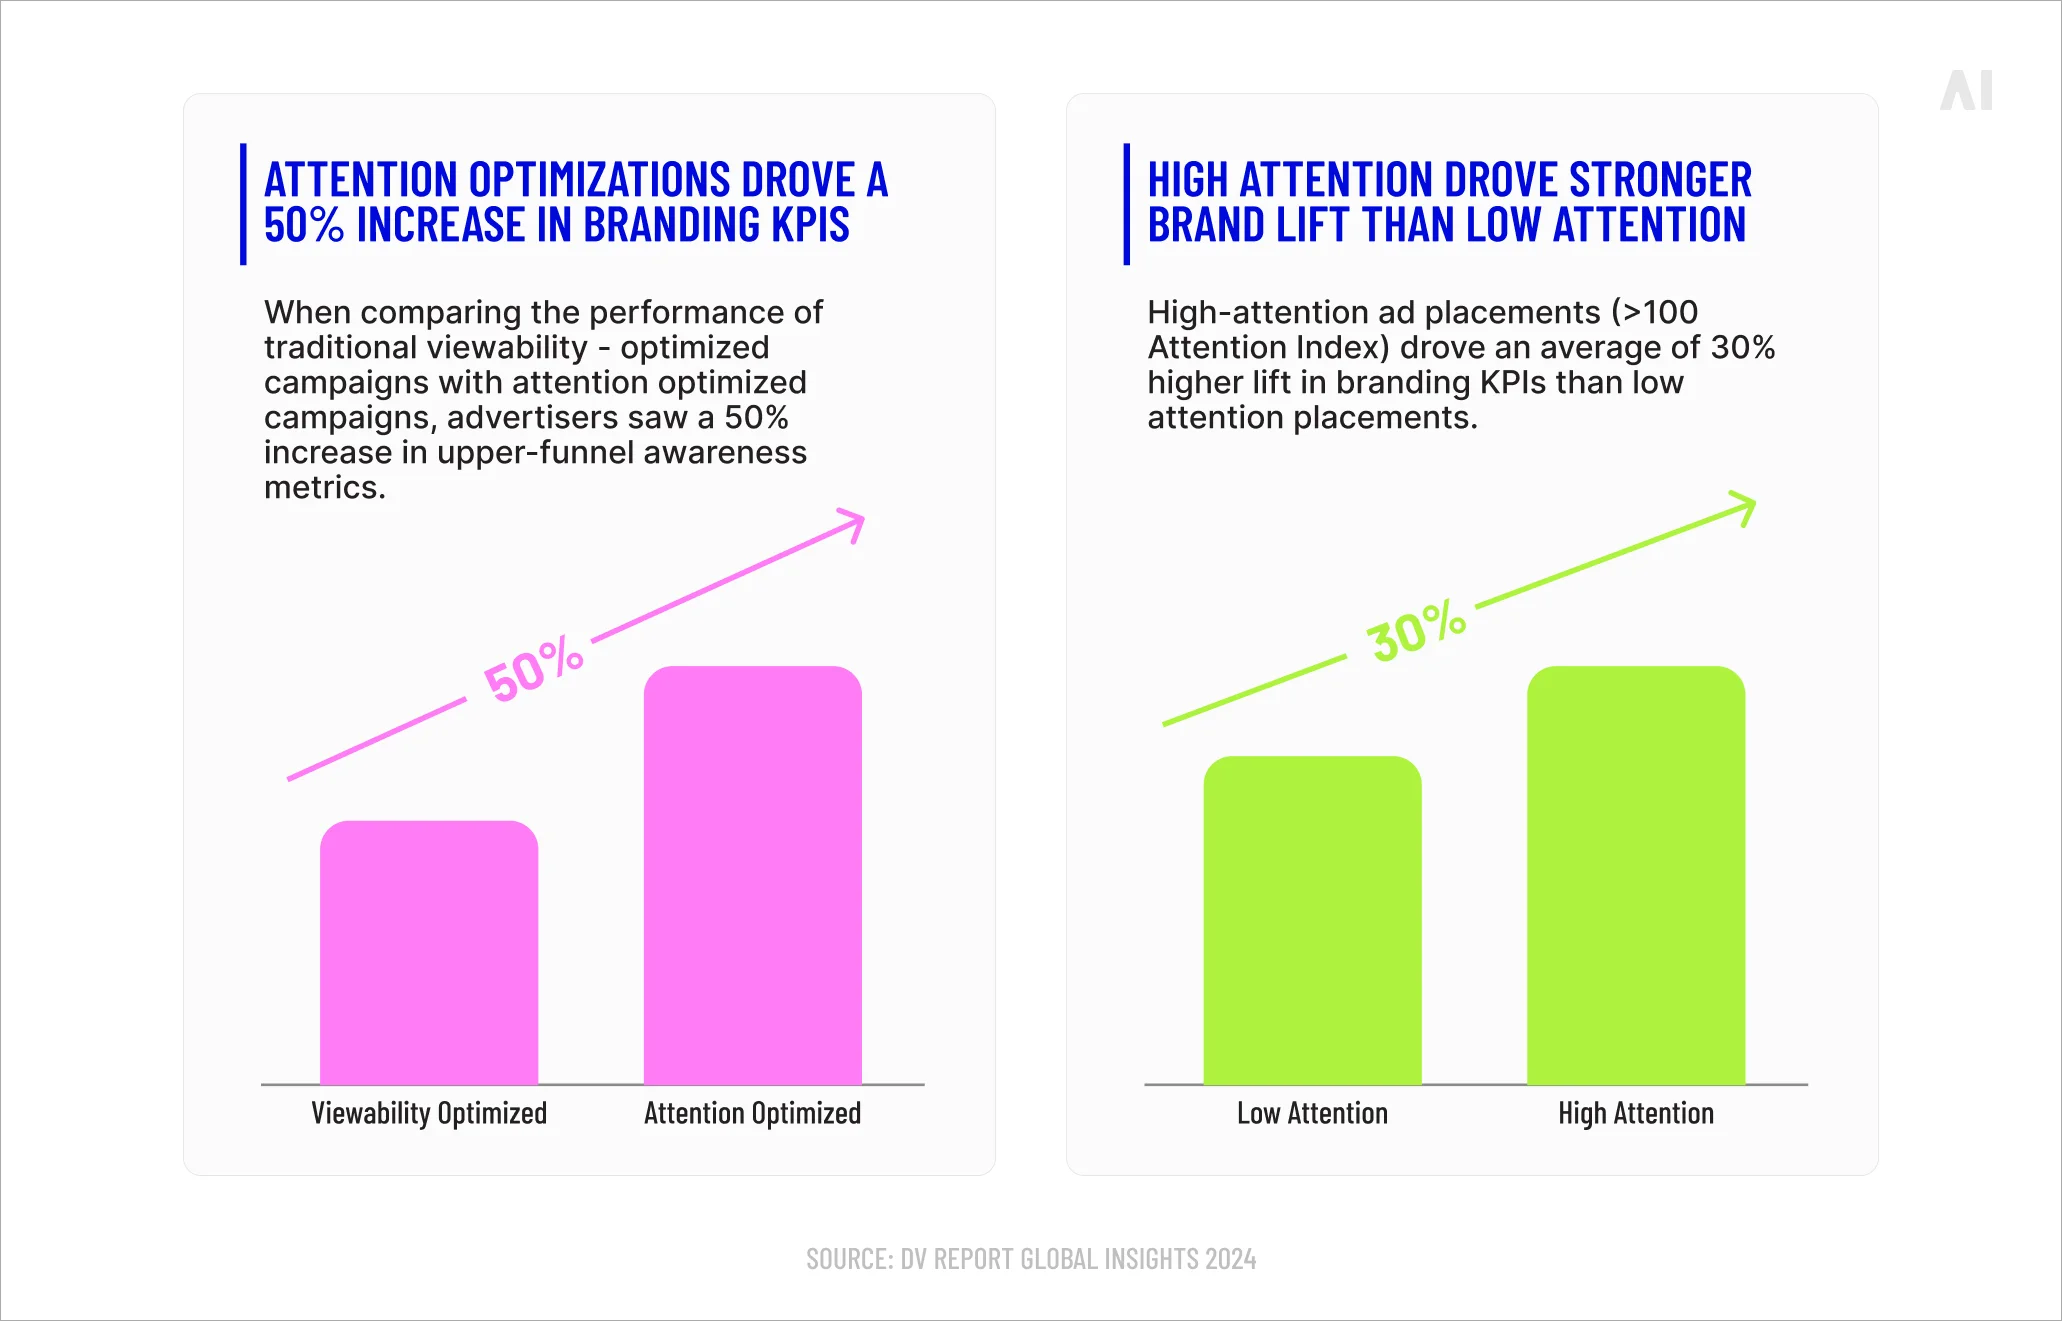
Video commands attention in ways static formats cannot match. Eye-tracking studies reveal that YouTube mobile ads capture 83% of viewers' visual attention, compared to just 45% for television ads. This heightened focus translates directly into memorability, with approximately 80% of users able to recall a video ad they've seen in the past 30 days.
The engagement advantage extends beyond mere viewing.Social videos generate 1,200% more shares than text and image posts combined, turning viewers into voluntary brand ambassadors. This organic amplification occurs because video content triggers emotional responses more effectively than other formats. Motion, sound, and narrative combine to create experiences that viewers remember and discuss.
Attention optimization leads to increased branding KPI (Source)
📍 Practical takeaway: use short, front-loaded cuts for mobile and test interactive elements (end cards, overlays, product modules) where inventory allows to lift view-through and engagement rates.
Brand storytelling potential
OLV supports sequencing—showing people a planned series of short videos that build a narrative across exposures. YouTube and DV360 document sequence campaigns that let brands introduce, reinforce, and then prompt action with creative steps tailored to each stage. Advertisers use this to adapt the arc (e.g., teaser → product proof → offer) while controlling order, pacing, and audience rules.
📍 Tip: build modular assets (6s, 10–15s, and 30s) that can be arranged into sequences for prospecting, education, and retargeting without reshoots.
Measurability & optimization
Video buyers now rankbusiness outcomes (e.g., sales, store visits) as the top KPI—pushing OLV toward biddable, test-and-learn execution with clear success criteria.
IAB’s 2024–2025 work documents this KPI shift and continued double-digit growth for digital video, reflecting confidence in measurable performance.
Verification and measurement guidelines from IAB/MRC standardize viewability and completion reporting across web, app, and OTT.
💡 Use Elevate for outcome-based setup and optimization: AI planning builds the plan, predictive forecasting sets budgets, Impact Score and custom-KPI optimization shift spend to what works, and Ask Elevate explains the why.
📍 How to act on it: define primary outcomes (conversions, lift) plus early signals (VTR quartiles, CTR), set learning budgets for week-one experiments, and shift spend quickly to winners.
Retargeting capabilities
OLV makes sequential messaging straightforward. Official Google documentation confirms you can build remarketing lists from YouTube viewers, past site visitors, and Customer Match files, then serve tailored video ads to those audiences. This supports flows such as “watched but didn’t visit,” “visited but didn’t add to cart,” or “abandoned cart.”
📍 Execution notes: maintain recency windows (e.g., 7/14/30 days), cap frequency by segment, and rotate creatives so repeat viewers see the next message in the sequence.
ROI & performance lift
Well-designed OLV programs can move both brand and sales outcomes. In one large meta-analysis of nearly 30 Nielsen Catalina Solutions sales-lift studies, L’Oréal USA reported an average 6% sales lift tied to YouTube activity, alongside a 6:1 ROAS on YouTube CTV campaigns.
Separate Ipsos work with Google shows YouTube CTV driving recall, consideration, and offline action—evidence that cross-screen video can influence upper- and lower-funnel metrics.
📍 Bottom line: treat OLV as a full-funnel lever—optimize early to attention and completion, then validate with incrementality studies (brand lift and conversion lift) as the campaign scales. business.google.com
Types of OLV ads
A single OLV plan can use several formats, each built for a different job. In-stream rides alongside video content for scale and completion, outstream adds reach in articles and feeds, social video taps native engagement, native video blends into editorial, and shoppable units pull viewers straight into commerce. Start with your goal, then match formats to attention, interactivity, and the screen you’re buying.
{{OLV-advertising-SEO-2="/tables"}}
In-stream ads (pre-roll, mid-roll, post-roll)
In-stream video runs inside a player alongside editorial or entertainment content:
pre-roll appears before the content starts,
mid-roll interrupts longer videos at natural breaks, and
post-roll plays after the content ends.
Units can be skippable or non-skippable, with common lengths of six, 10–15, and 30 seconds.
Use in-stream when you want the context of premium content, strong completion rates, and broad reach.
📍Best practices: hook viewers in the opening seconds, brand early and naturally, and align the cut to the placement (shorter for skippable pre-roll, slightly longer for mid-roll where attention is steadier). Track quartile completions, view-through rate, and frequency by placement.
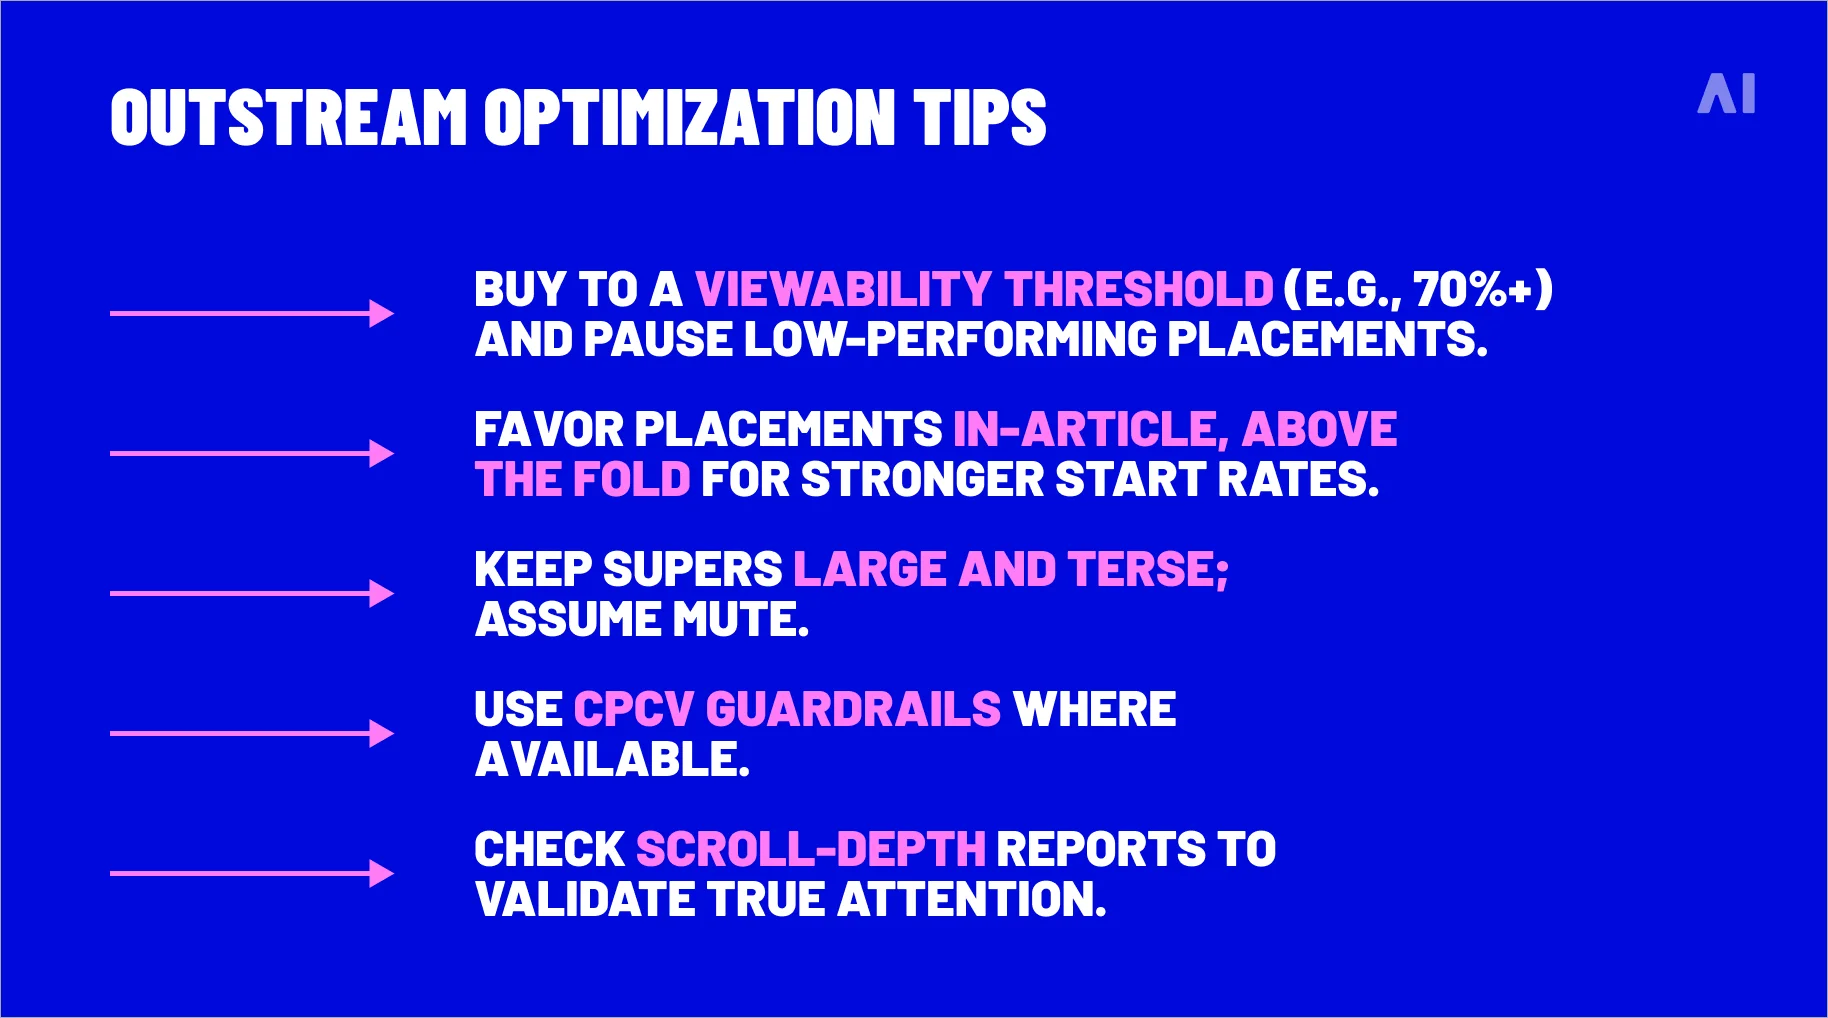
Outstream ads
Outstream video renders outside a traditional video player—inside articles, feeds, and content modules on publisher pages and apps. It typically autoplays muted when in view and pauses when scrolled out of view.
Outstream is useful for incremental reach on the open web where publishers don’t have their own video content. Creative needs to earn attention quickly without relying on sound; subtitles and punchy supers are essential.
Optimize toward viewability and completed views, and set sensible viewability thresholds in your buys.
Social video ads
Social placements (e.g., in-feed, Reels, Shorts, Stories) blend into the user’s feed and benefit from rich audience targeting and engagement signals.
Plan for mobile-first delivery with vertical or square aspect ratios, bold visuals, and captions. Lean on platform-native calls to action (swipe, tap, shop, learn more) and expect quicker creative fatigue—rotate variants and refresh regularly.
Measure beyond clicks: use view-through events, add-to-carts (where available), and on-platform engagement to identify early winners.
Native video ads
Nativevideo matches the look and feel of the surrounding environment, appearing as a sponsored post or content card rather than a traditional ad slot.
The advantage is lower disruption and higher relevance; the trade-off is that the creative must carry the story without heavy framing.
Keep headlines clear, thumbnails purposeful, and disclosures compliant.
Shoppable formats connect viewing with buying by surfacing product pins, carousels, or overlays that open a product detail page or checkout flow. They work well for retail, beauty, home, and other visually led categories.
Use tight framing on the product, concise benefit copy, and a decisive call to action. Ensure landing pages mirror the creative (same product, price, and offer) to reduce drop-off. Track product interactions, add-to-cart rate, and conversion alongside video metrics to judge true performance.
How OLV advertising works
Below is the OLV framework explained as a system: what happens inside the pipes, how platforms make decisions, and how signals flow from an impression to a business outcome.
Campaign setup
Before you launch, every setup choice becomes a rule or a signal the system will use. Objectives turn into optimization targets, audiences become eligibility filters, and creative specs define which assets can serve. Here’s how those inputs translate into delivery decisions.
How platforms translate goals into delivery
When you pick an objective (for example, completed views or site visits), the buying platform maps that choice to an optimization target. Under the hood it trains or applies a predictive model that estimates the probability of that outcome for each future impression. Your early indicators—quartile completions, view-through rate, click-through rate—become training signals and guardrails. They also inform pacing, so the system can spend at a steady rate while chasing the cheapest path to your goal.
How audiences and screens become eligibility rules
Your audience definition compiles into a set of allow lists and deny lists: geos, devices, OS versions, app/site categories, content labels, and data segments. At bid time, the DSP checks the incoming opportunity against these rules and only scores impressions that qualify. If you plan OLV to complement CTV, the system also consults frequency logs to avoid over-exposing the same people or households.
How placements and formats shape the auction
Choosing skippable in-stream, non-skippable, outstream, social, or shoppable isn’t just creative preference. Each format arrives with different auction dynamics, floor prices, and measurement capabilities.
For example, non-skippable mid-roll in long-form content often has higher floors and higher completion probability. Outstream is abundant but viewability-gated. Those supply-side realities affect the model’s expected value calculation.
How creative assets are prepared
When you upload 6s, 10–15s, and 30s cuts in multiple aspect ratios, the ad server transcodes them into renditions for various players and bandwidths. Captions are attached as VTT files for silent autoplay. The system stores “decision metadata” such as which asset is eligible for which placement, the skip offset, and whether a companion banner or end card can be shown.
How tests are wired
Your A/B plan creates traffic splits that route a fixed share of eligible impressions to each variant. Most platforms run a short learning phase, then reallocate budget to winners using simple bandit logic or similar heuristics. Pre-defining promotion and pause rules prevents the model from chasing noise.
How guardrails are enforced
Brand-safety tiers, publisher allow lists, and viewability targets are enforced twice: once before bidding (hard eligibility) and again after delivery through verification. Frequency caps live in the DSP and ad server; both keep counters keyed to identifiers such as cookies, device IDs, IP+UA, or publisher IDs on CTV. Pacing uses a target delivery curve so you do not overspend in the morning and starve the evening.
How measurement is instrumented
Pixels and SDK events are embedded in VAST tracking URLs. They fire at start, first quartile, midpoint, third quartile, and complete. Separate beacons capture viewability via OMID (Open Measurement SDK). Conversion pixels on your site or app pass back events with timestamps and anonymized IDs so the platform can link exposures to outcomes within your chosen windows.
Targeting & bidding strategies
Targeting defines who and where you’re willing to show up; bidding sets how hard you compete for those moments. Together they determine eligibility, price, and priority in the auction. Here’s how that plays out from request to render.
{{OLV-advertising-SEO-3="/tables"}}
What happens between an impression opportunity and your ad showing
A user opens a page or app. The video player requests an ad from the publisher’s ad server or SDK. The supply-side platform (SSP) packages a bid request that includes context (site/app, content category), device details, rough location, predicted viewability, and any allowed user identifiers. It attaches a floor price and any private-deal terms.
Your DSP receives the request and runs a fast pipeline:
Audience match: deterministic IDs (hashed email, platform IDs, device IDs on CTV) or probabilistic signals are matched to your first-party or third-party segments.
Prediction: a model scores the likelihood of your target event (for example, a completed view or a site visit) given historical performance on similar supply and audiences.
Bid pricing: the platform multiplies the event probability by your value per event, then applies bid caps, floors, and deal priorities to produce a CPM, CPV, or CPCV bid.
Creative selection: the system chooses the best-fit asset for the placement and device.
Submission: the bid and creative ID go back to the exchange before the time limit (often under 100 ms).
The exchange runs a first-price auction in most markets today. If you win, the player receives a VAST response or an ad URL. Playback begins, and skip logic activates at the configured second for skippable units.
How prospecting differs from retargeting
Prospecting relies on contextual signals (page topics, app categories, channel metadata), modeled interests, and first-party lookalikes. Retargeting uses viewer lists (watched X% of a video), site pixels (visited a product page), or customer files to reach people who already signaled intent. The DSP treats retargeting as higher-probability traffic and will often bid more because the predicted value is higher.
How deal types affect access
Open auctions maximize reach. Private marketplace (PMP) deals and programmatic guaranteed (PG) give priority access, consistent pricing, and stricter quality controls. A deal ID in the bid request changes the auction path and can bypass some open-market competition.
Delivery & real-time optimization
When the campaign goes live, each impression returns signals the optimizer can learn from—play time, viewability, clicks, conversions. Those signals drive bid updates, creative rotation, and supply choices. Here’s how that feedback loop works in practice.
How the system learns mid-flight
Each impression generates logs: whether it started, how far it played, if it was viewable, whether it was clicked, and if a conversion followed. The optimizer aggregates these signals by supply path, audience, and creative. It then updates bid multipliers. High VTR on a certain publisher raises bids there; poor mid-roll completion triggers a down-weight. If a creative underperforms after a minimum impressions threshold, the rotation shifts toward stronger assets.
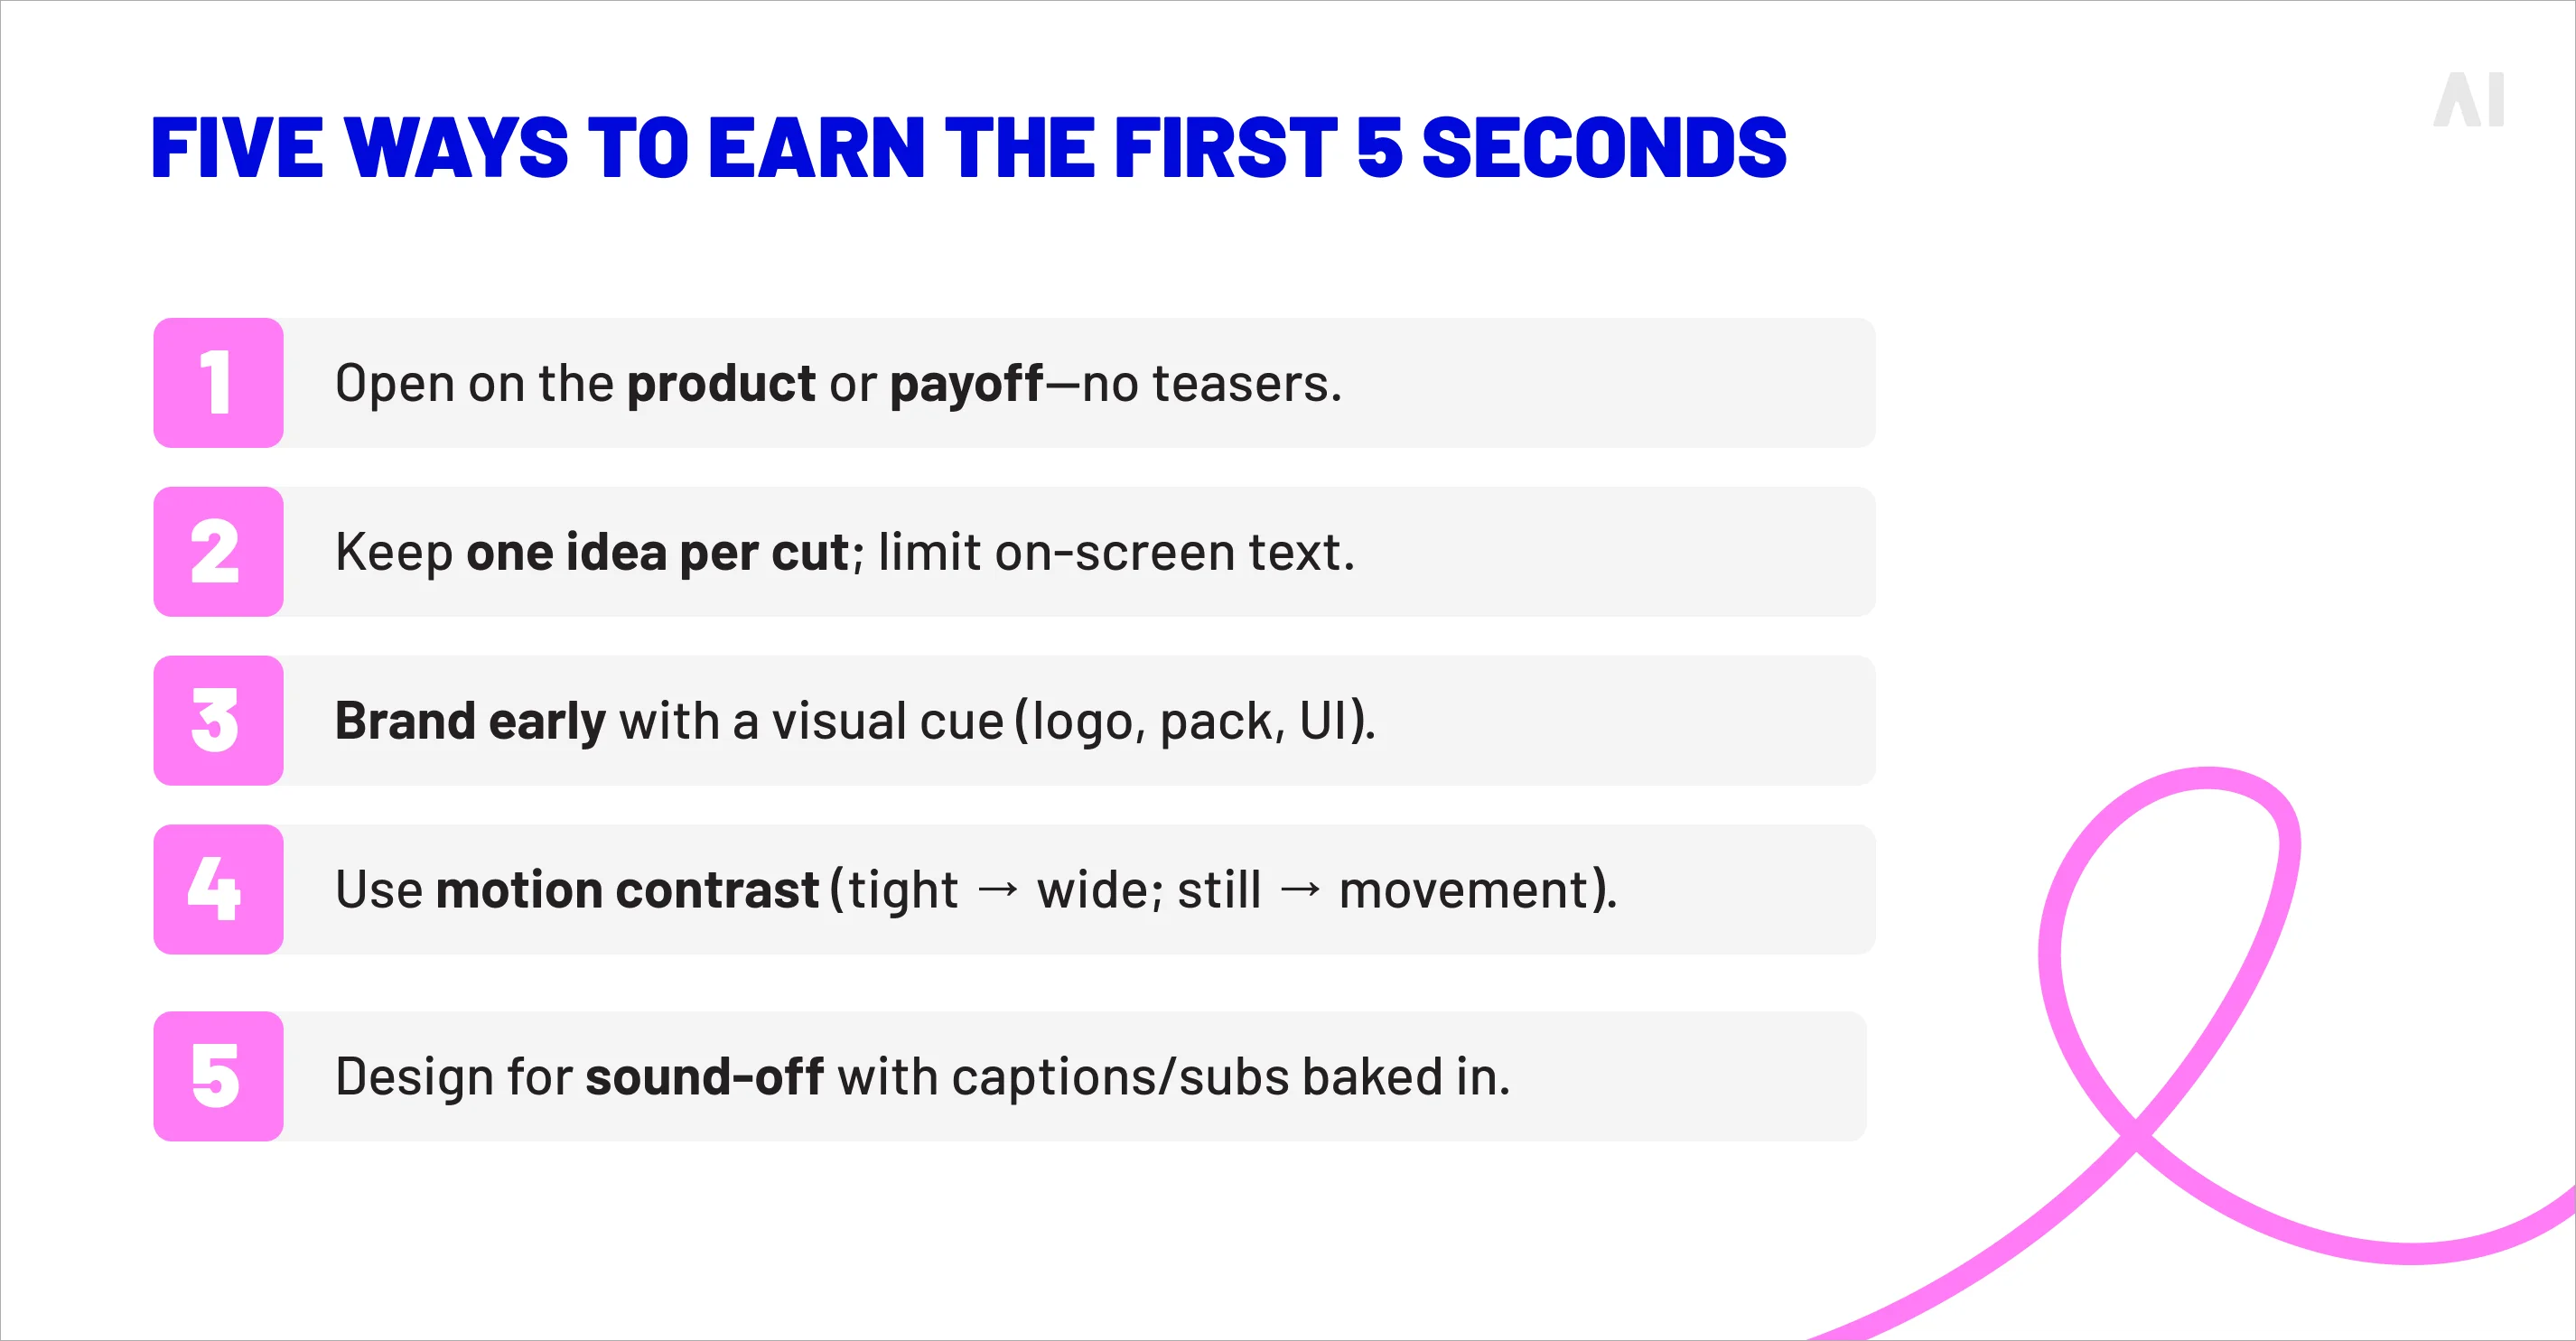
How the first five seconds drive the model
Skip behavior is a powerful negative signal. If early drop-off spikes, the optimizer lowers bids on similar contexts or devices and your team should adjust the opening: tighter framing, earlier branding, fewer words on screen, simpler motion. Shorter durations also change the expected completion curve, which improves predicted CPCV.
How frequency and fatigue are controlled
The platform tracks how outcomes change as frequency climbs. When the curve flattens for a segment, the system reduces caps or shifts spend to new supply. On CTV, where ads are often unskippable, caps are conservative to avoid annoyance; OLV can tolerate higher caps because people can scroll or skip, but you still want diminishing-return protection.
How supply is curated
Supply path optimization prefers direct and transparent routes to the same inventory to reduce fees and fraud risk. If specific apps or placements chronically miss viewability or VTR targets, they are excluded. Viewability thresholds can be raised mid-flight. If a campaign is under-delivering, the buyer can open additional formats or activate a PMP to stabilize volume.
How sequencing works in practice
Once a viewer completes Ad A or watches beyond a set quartile, the DSP adds them to a list eligible for Ad B. Recency windows ensure the follow-up runs soon enough to feel connected. This is how you progress from teaser to proof to offer without manual trafficking.
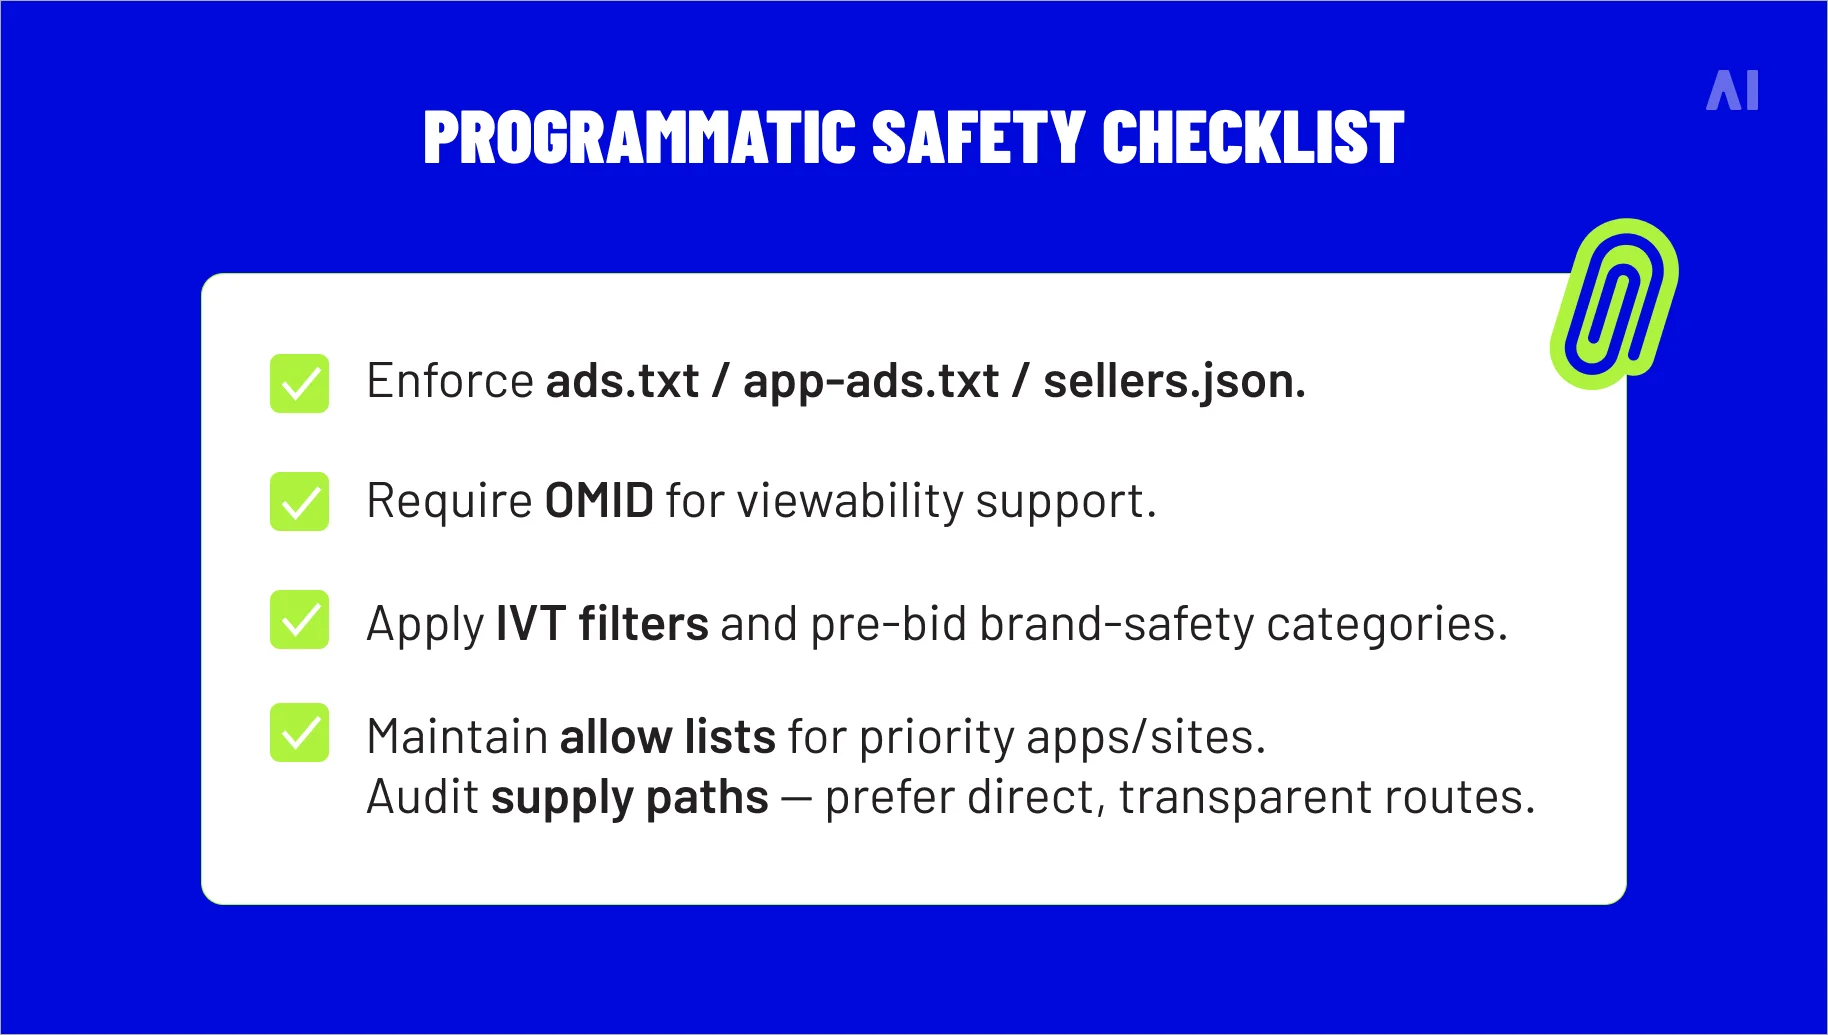
How verification prevents waste
OMID signals confirm the ad was actually in view. Invalid-traffic filters look for bots and mismatched human behavior. Brand-safety classifiers scan page or video metadata to block unsuitable content. These checks run alongside delivery, and their outcomes are factored into future bidding.
Measurement & attribution
Measurement translates exposure into evidence: first confirm what was actually seen, then connect exposures to outcomes across screens, and finally assign credit. That sequence starts with consistent definitions.
{{OLV-advertising-SEO-4="/tables"}}
How a “view” and “viewability” are counted
The player fires standardized VAST beacons at start and each quartile. Viewability is measured by an SDK sitting in the player that confirms how much of the video was on screen for how long (for example, MRC’s guideline of ≥50 percent in view for ≥2 seconds on web). On CTV and SSAI (server-side ad insertion), measurement uses server beacons and watermarking to approximate the same events.
How conversions are linked to exposures
Clicks are straightforward: a redirect tags the session, then your site conversion pixel closes the loop. View-throughs use impression logs joined to conversion logs by an identifier or clean-room match within your attribution window. If cookies or mobile IDs are sparse, platforms lean on publisher-provided IDs, login matches, or household-level keys.
How cross-screen deduplication works
Vendors build device graphs that connect phones, tablets, laptops, and TVs to a likely household or person using login data and other deterministic signals. Reporting then removes overlaps so you see true reach at your chosen frequency across OLV and CTV, rather than double-counted exposures.
How incrementality is proven
Lift tests hold out a comparable audience that does not see your ads. Differences in outcomes—surveyed awareness, conversions, sales—estimate causal impact. For large programs, geo-experiments randomize markets and read sales or site traffic directly. Clean rooms enable matchbacks with retailers or publishers while keeping user-level data private.
How attribution models assign credit
Rule-based models (last click, time decay) are simple but can under-value video. Data-driven models use path data to estimate each touchpoint’s contribution. For long sales cycles, marketing mix modeling adds a top-down lens that accounts for seasonality and non-digital channels, then you reconcile the two views.
How the loop closes
Post-campaign, platforms export performance by creative, audience, and supply path. You capture pattern-level learnings, feed them into the next flight’s targeting and creative brief, and the optimizer starts with better priors.
That is how OLV improves over time: the system continuously converts your goals and signals into bid decisions, and your team continuously supplies clearer goals and better signals.
OLV platforms and ecosystem
The OLV stack has two halves: where ads appear and how they get there. Platforms like YouTube, Meta, TikTok, and publishers supply the reach; programmatic tools route, verify, and optimize delivery using shared standards (VAST, OMID) and privacy-safe identity. Start with the major surfaces, then map the pipes that connect them.
Major OLV platforms
Below is a quick read on the largest surfaces and what they’re best at—from broad, brand-safe long-form to mobile-first short-form and context-rich publisher inventory.
YouTube. The largest single source of online video reach, with in-stream formats (skippable, non-skippable, bumper), strong content controls, and device-level reporting. Useful for full-funnel plans: broad awareness on long-form content and direct response with Shorts and in-feed placements.
Meta (Facebook and Instagram). High-scale mobile delivery in Reels, Feed, and Stories. Powerful audience building from first-party interactions, fast creative testing, and strong commerce hooks (product tags, shop modules).
TikTok. Short-form, sound-on culture where vertical video and rapid iteration win. Creative fatigue arrives quickly, so rotate variants and use native calls to action to capture intent in-app.
Publisher sites and apps. News, sports, and entertainment environments offer in-stream pre/mid/post-roll plus outstream units in articles and feeds. Useful for incremental reach and contextual alignment when you need specific topics or premium adjacencies.
Demand-side platforms (DSPs). Buying consoles that aggregate OLV supply across thousands of publishers and exchanges (and increasingly CTV). They apply optimization, frequency management, and audience logic in one place.
Programmatic connects sellers and buyers in real time. Think of it in two halves: the supply side, where publishers package impressions, and the demand side, where DSPs evaluate, bid, and deliver.
Supply layer. Publishers use an ad server and software development kits (SDKs) in their players to request ads. Supply-side platforms (SSPs) package each opportunity with context (page/app, category, device, location signals), attach a price floor or deal terms, and send bid requests through exchanges.
Demand layer. Your DSP screens each request against eligibility rules (brand safety, geo, device, frequency, budget), matches any available identifiers to your first-party or third-party segments, predicts the likelihood of your KPI (completed view, click, site visit), prices a bid accordingly, and returns the best-fit creative. Most auctions clear at first price; private marketplace and programmatic-guaranteed deals provide priority access and steadier volume.
Standards and safeguards. Delivery and measurement run on common rails: VAST for video ad serving, Open Measurement (OM SDK) for viewability, verification vendors for invalid traffic and brand suitability, and deal IDs to control supply paths. Identity graphs and clean rooms support deduplicated reach and outcome matchbacks while protecting user-level data.
Optimization. As impressions accrue, the DSP shifts budget toward higher-quality routes (supply-path optimization), better-performing audiences, and stronger creatives. Frequency caps and sequencing rules keep exposure efficient, while pacing prevents end-of-flight spikes.
Relevant video-on-demand models
These are monetization models for OTT/streaming services, not OLV platforms themselves. They matter because they determine where ads can run and how much ad inventory exists—especially in ad-supported environments.
SVOD (subscription video on demand). Paid access to libraries, typically ad-free. Many services now offer hybrid tiers, where a lower subscription includes ads.
AVOD (advertising-supported video on demand). Free or low-cost streaming funded by ads. This is where most streaming ad inventory lives, including channel-style FAST experiences that mimic linear programming.
TVOD (transactional video on demand). Pay-per-title rental or purchase. Usually ad-free, so limited relevance for ad buyers.
PVOD (premium video on demand). Higher-priced early-window rentals or purchases. Typically ad-free.
These terms overlap, but they describe different things: OLV is a digital ad placement context, OTT is a content delivery method, and CTV is a device category. The same ad can be counted in more than one bucket depending on where and how it’s viewed.
OLV vs OTT
Let’s define each clearly, then map where they overlap:
OLV (online video advertising) refers to video ads delivered in web browsers and mobile apps, including in-stream, outstream, social, and shoppable formats. These units are often clickable and frequently skippable.
OTT (over-the-top) refers to internet-delivered streaming content (the shows and movies themselves), regardless of device.
How they intersect:
A pre-roll on a news site or a YouTube ad on a laptop is OLV, not necessarily OTT.
An ad during a Hulu stream on a phone is OTT and also behaves like OLV because it’s delivered off the TV screen with typical web/app tracking.
On a smart TV, the same Hulu ad is OTT but is no longer considered OLV; it’s treated as CTV (see below).
Now, let’s start with the screen: define CTV first, then contrast it with OLV’s off-TV delivery and interactivity.
CTV (connected TV) means the ad is delivered on an internet-connected television device (smart TV, Roku, Apple TV, game console). These spots often mirror TV: high completion rates, limited interactivity, household-level targeting, and no clicks.
OLV runs on non-TV screens (desktop, mobile, tablet) and usually supports clicks, more granular audience controls, and a wider range of formats and lengths.
Rule of thumb with examples:
A Disney+ or Peacock ad on a smart TV: CTV (and also OTT).
A YouTube ad on Roku: CTV (and OTT).
The same YouTube ad on a laptop or phone: OLV (and may or may not be OTT depending on context).
Most plans use both: CTV for big-screen impact and reach; OLV for incremental reach, interactivity, and retargeting between exposures.
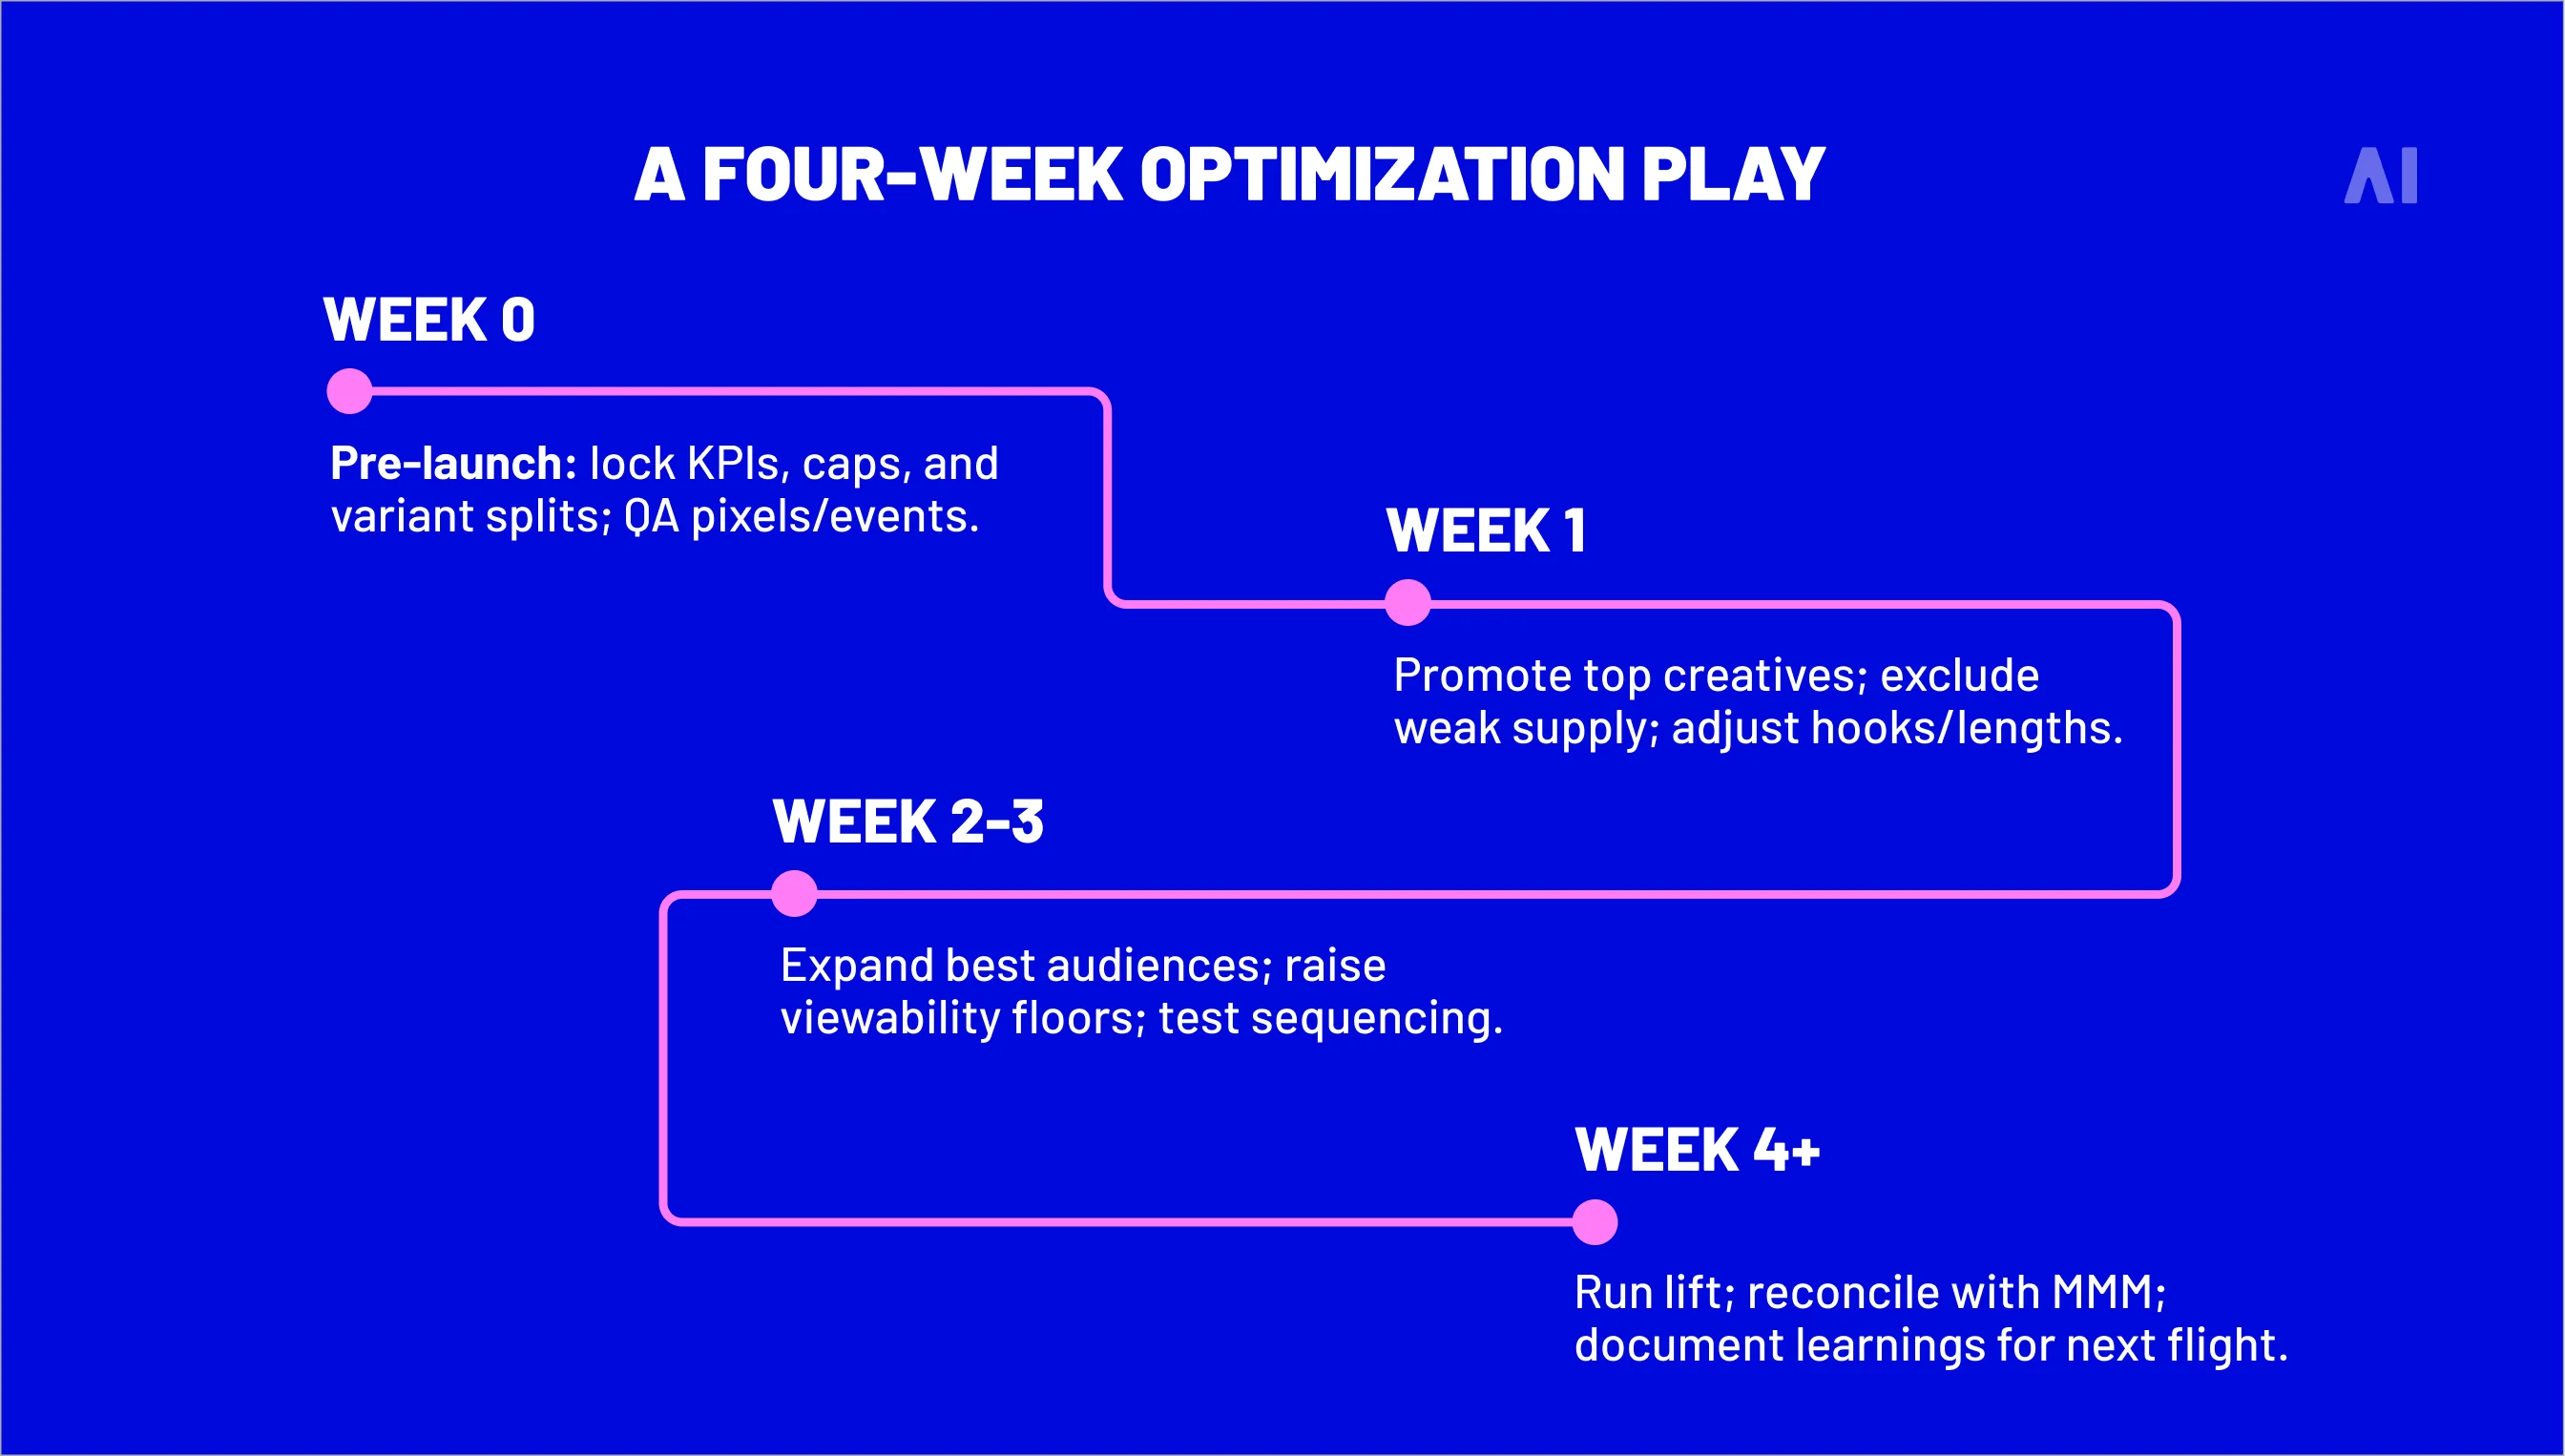
Use these as a pre-flight checklist and a week-one playbook. They focus attention, keep creative tight, and make optimizations faster.
Keep videos short and impactful
Attention drops fast, so make the first seconds work: front-load branding, a single message, and a clear next step. Six-second bumpers and 10–15s cuts consistently punch above their weight for recall and incremental reach.
In Google’s U.S. analyses, 70% of bumper campaigns lifted brand awareness (avg. +9%), and 9 in 10 drove ad recall; pairing short and longer formats further improves lift.
📍Practical bar: produce modular edits (6s / 10–15s / 30s). Use aspect ratios by placement (9:16 vertical, 1:1 square, 16:9 widescreen). If skip rates spike, re-cut openings or tighten pacing, and retest within 48–72 hours.
Optimize for mobile & multi-platform delivery
Plan assets for vertical viewing and subtitles (sound-off). Treat OLV as the workhorse across phones and laptops, with CTV as a reach multiplier at higher frequencies.
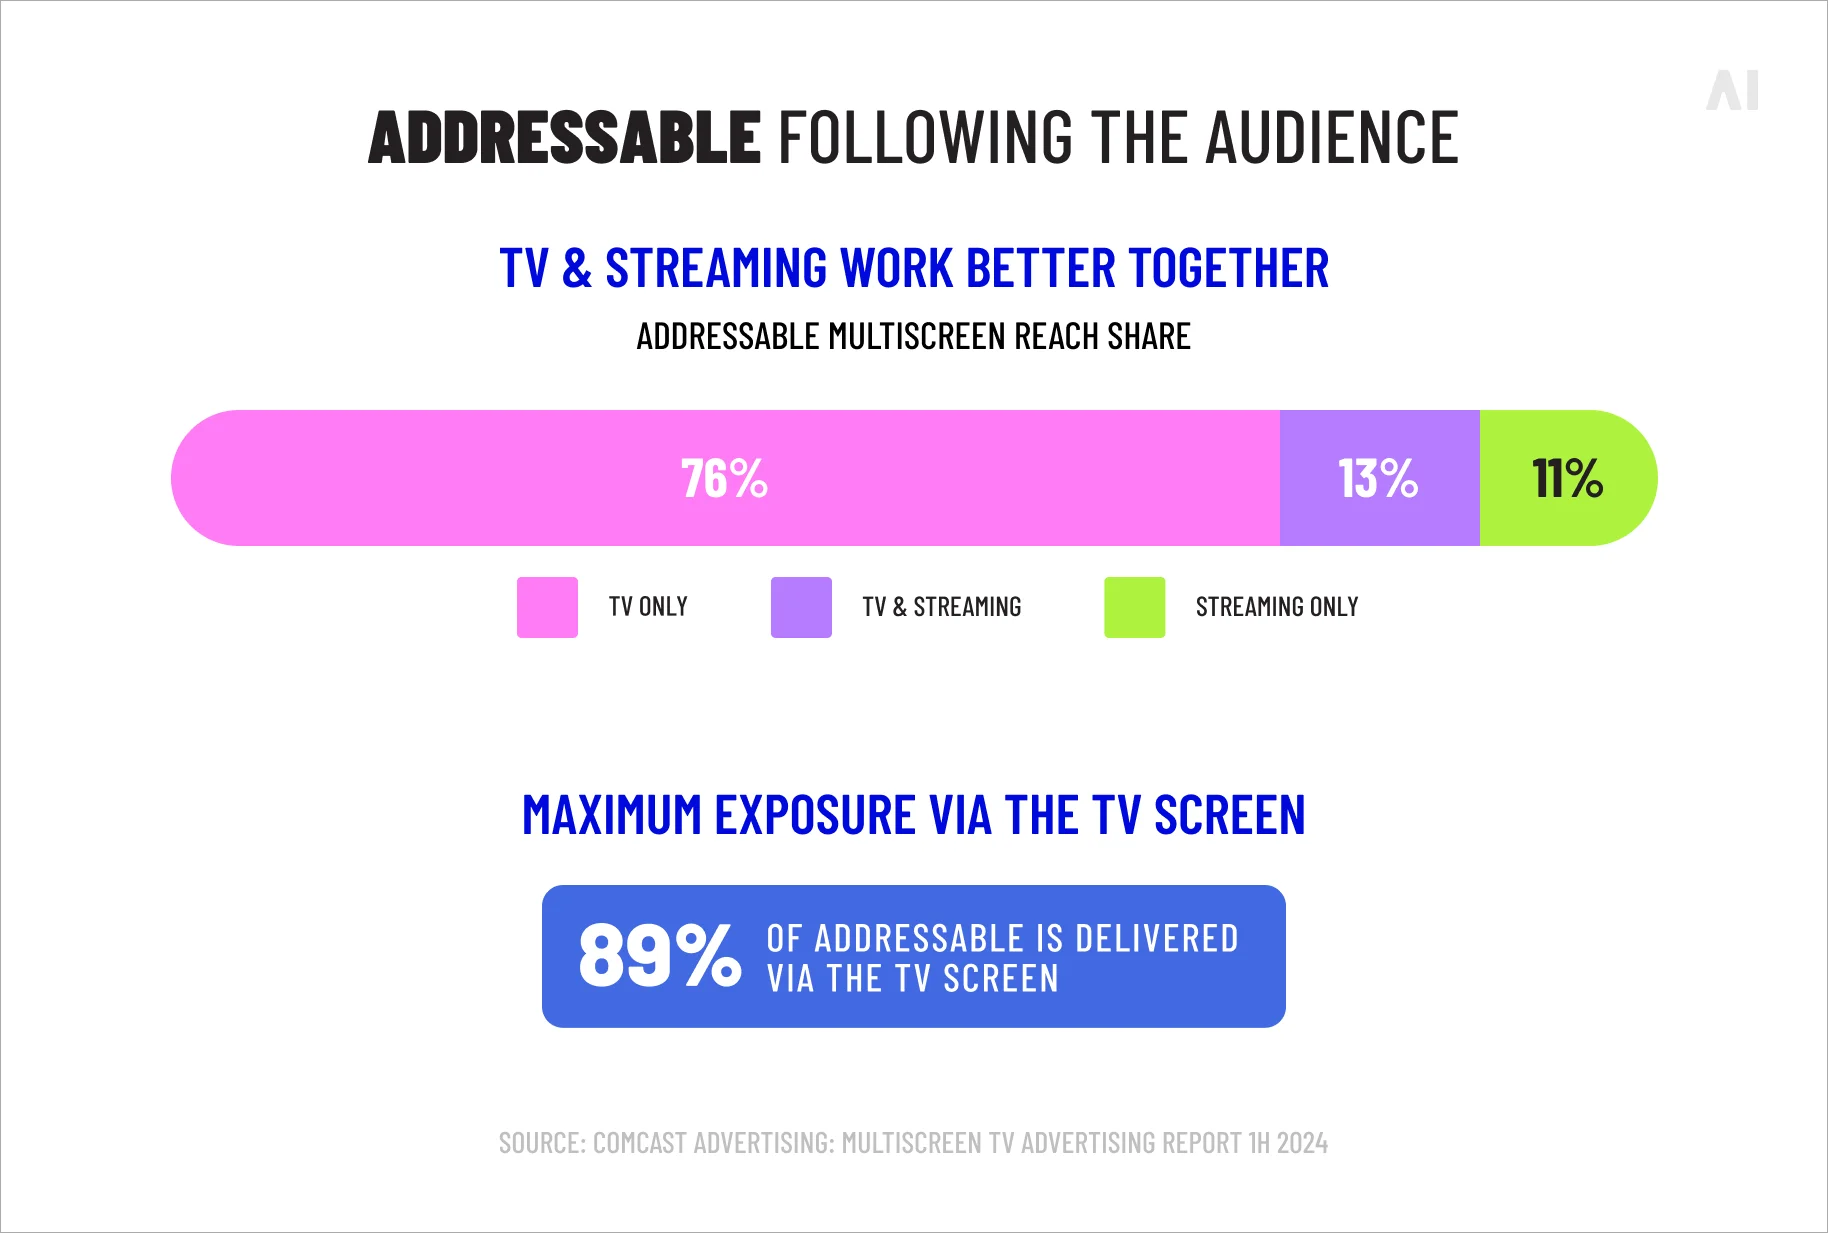
Recent measurement shows streaming adds unduplicated reach to TV:
in one Nielsen case, adding streaming lifted total reach +12%;
a Comscore-measured campaign delivered +23% incremental CTV reach; and
Comcast’s aggregated view shows 58% of streaming reach is unique to streaming—practical evidence that a multiscreen mix widens audience coverage.
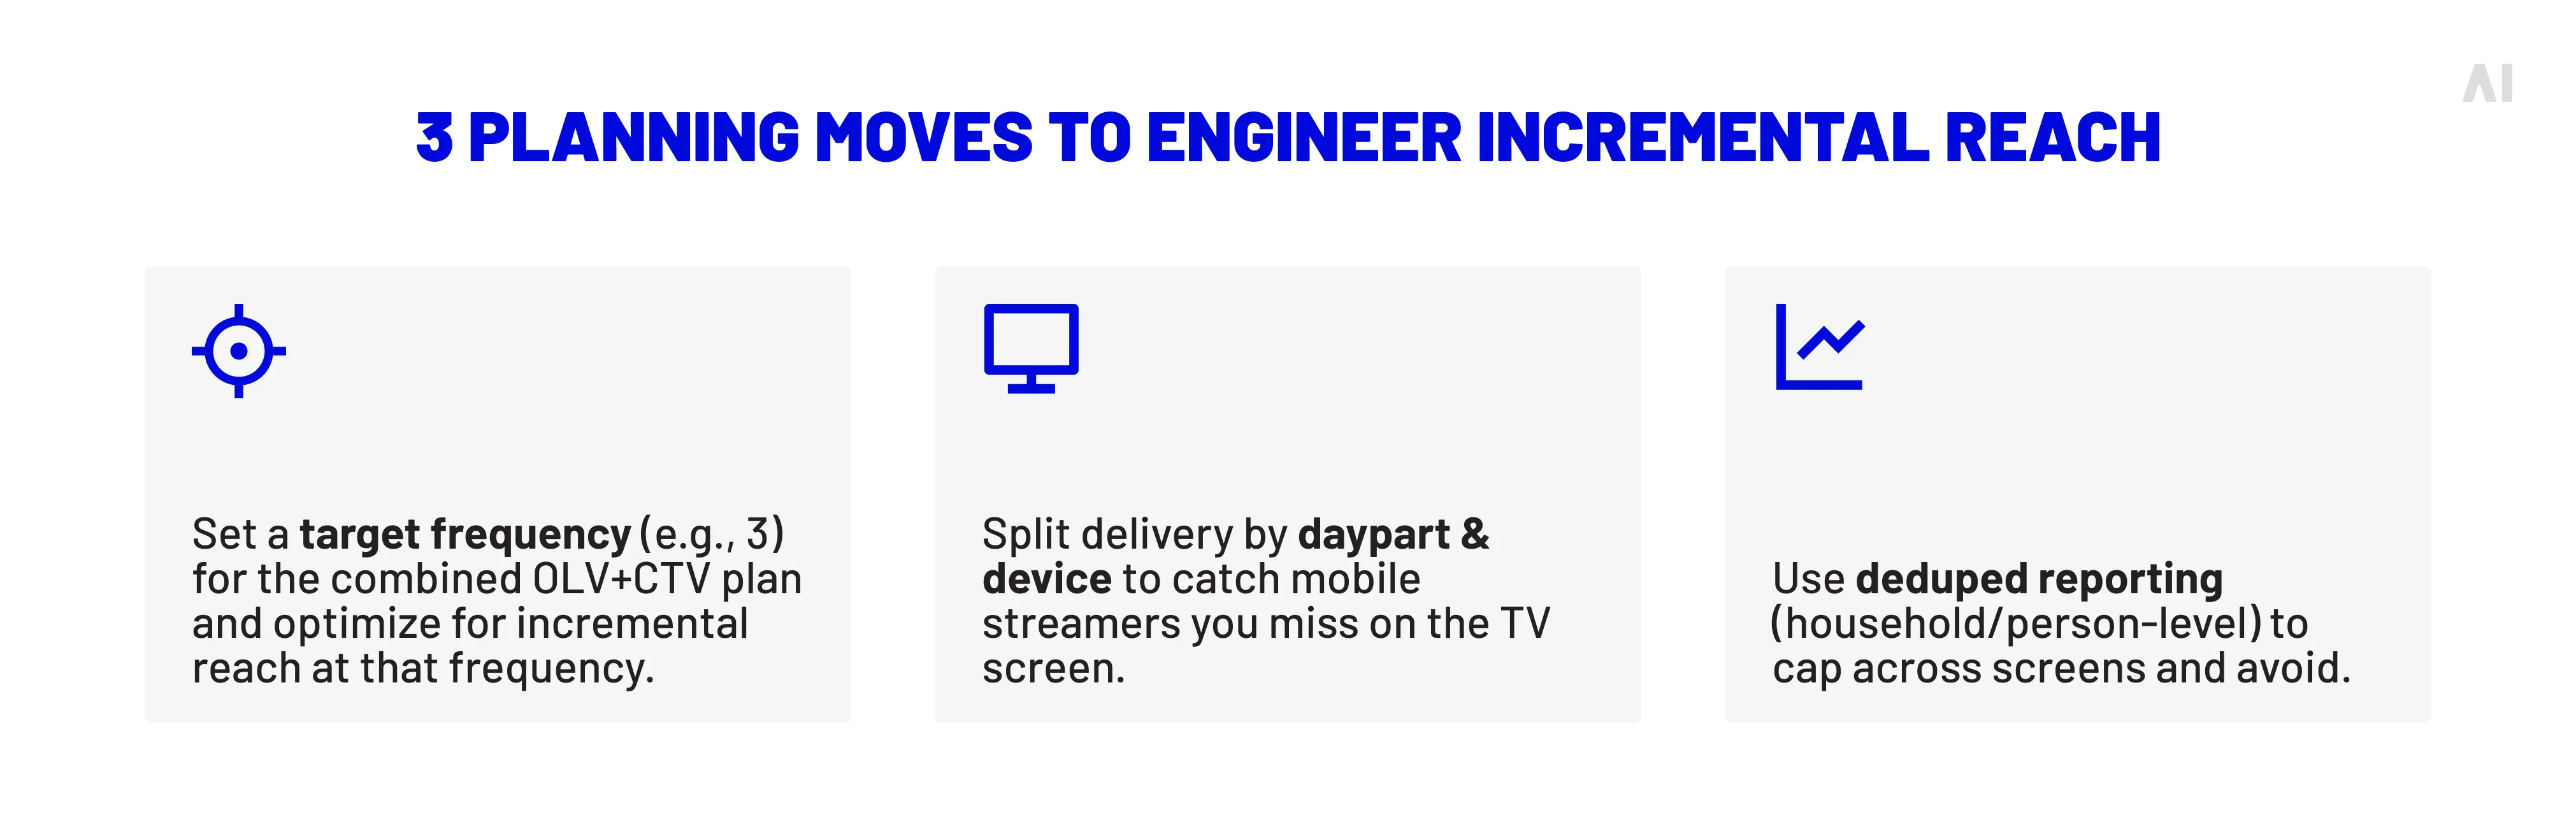
📍 Tip: build a cross-screen frequency strategy (e.g., 1–2 exposures on CTV, 3–4 on OLV) and manage caps by audience stage.
Use strong, clear CTAs
Spell out the action and make it visible on screen and end cards (e.g., “Shop the collection,” “Get a quote,” “Book today”).
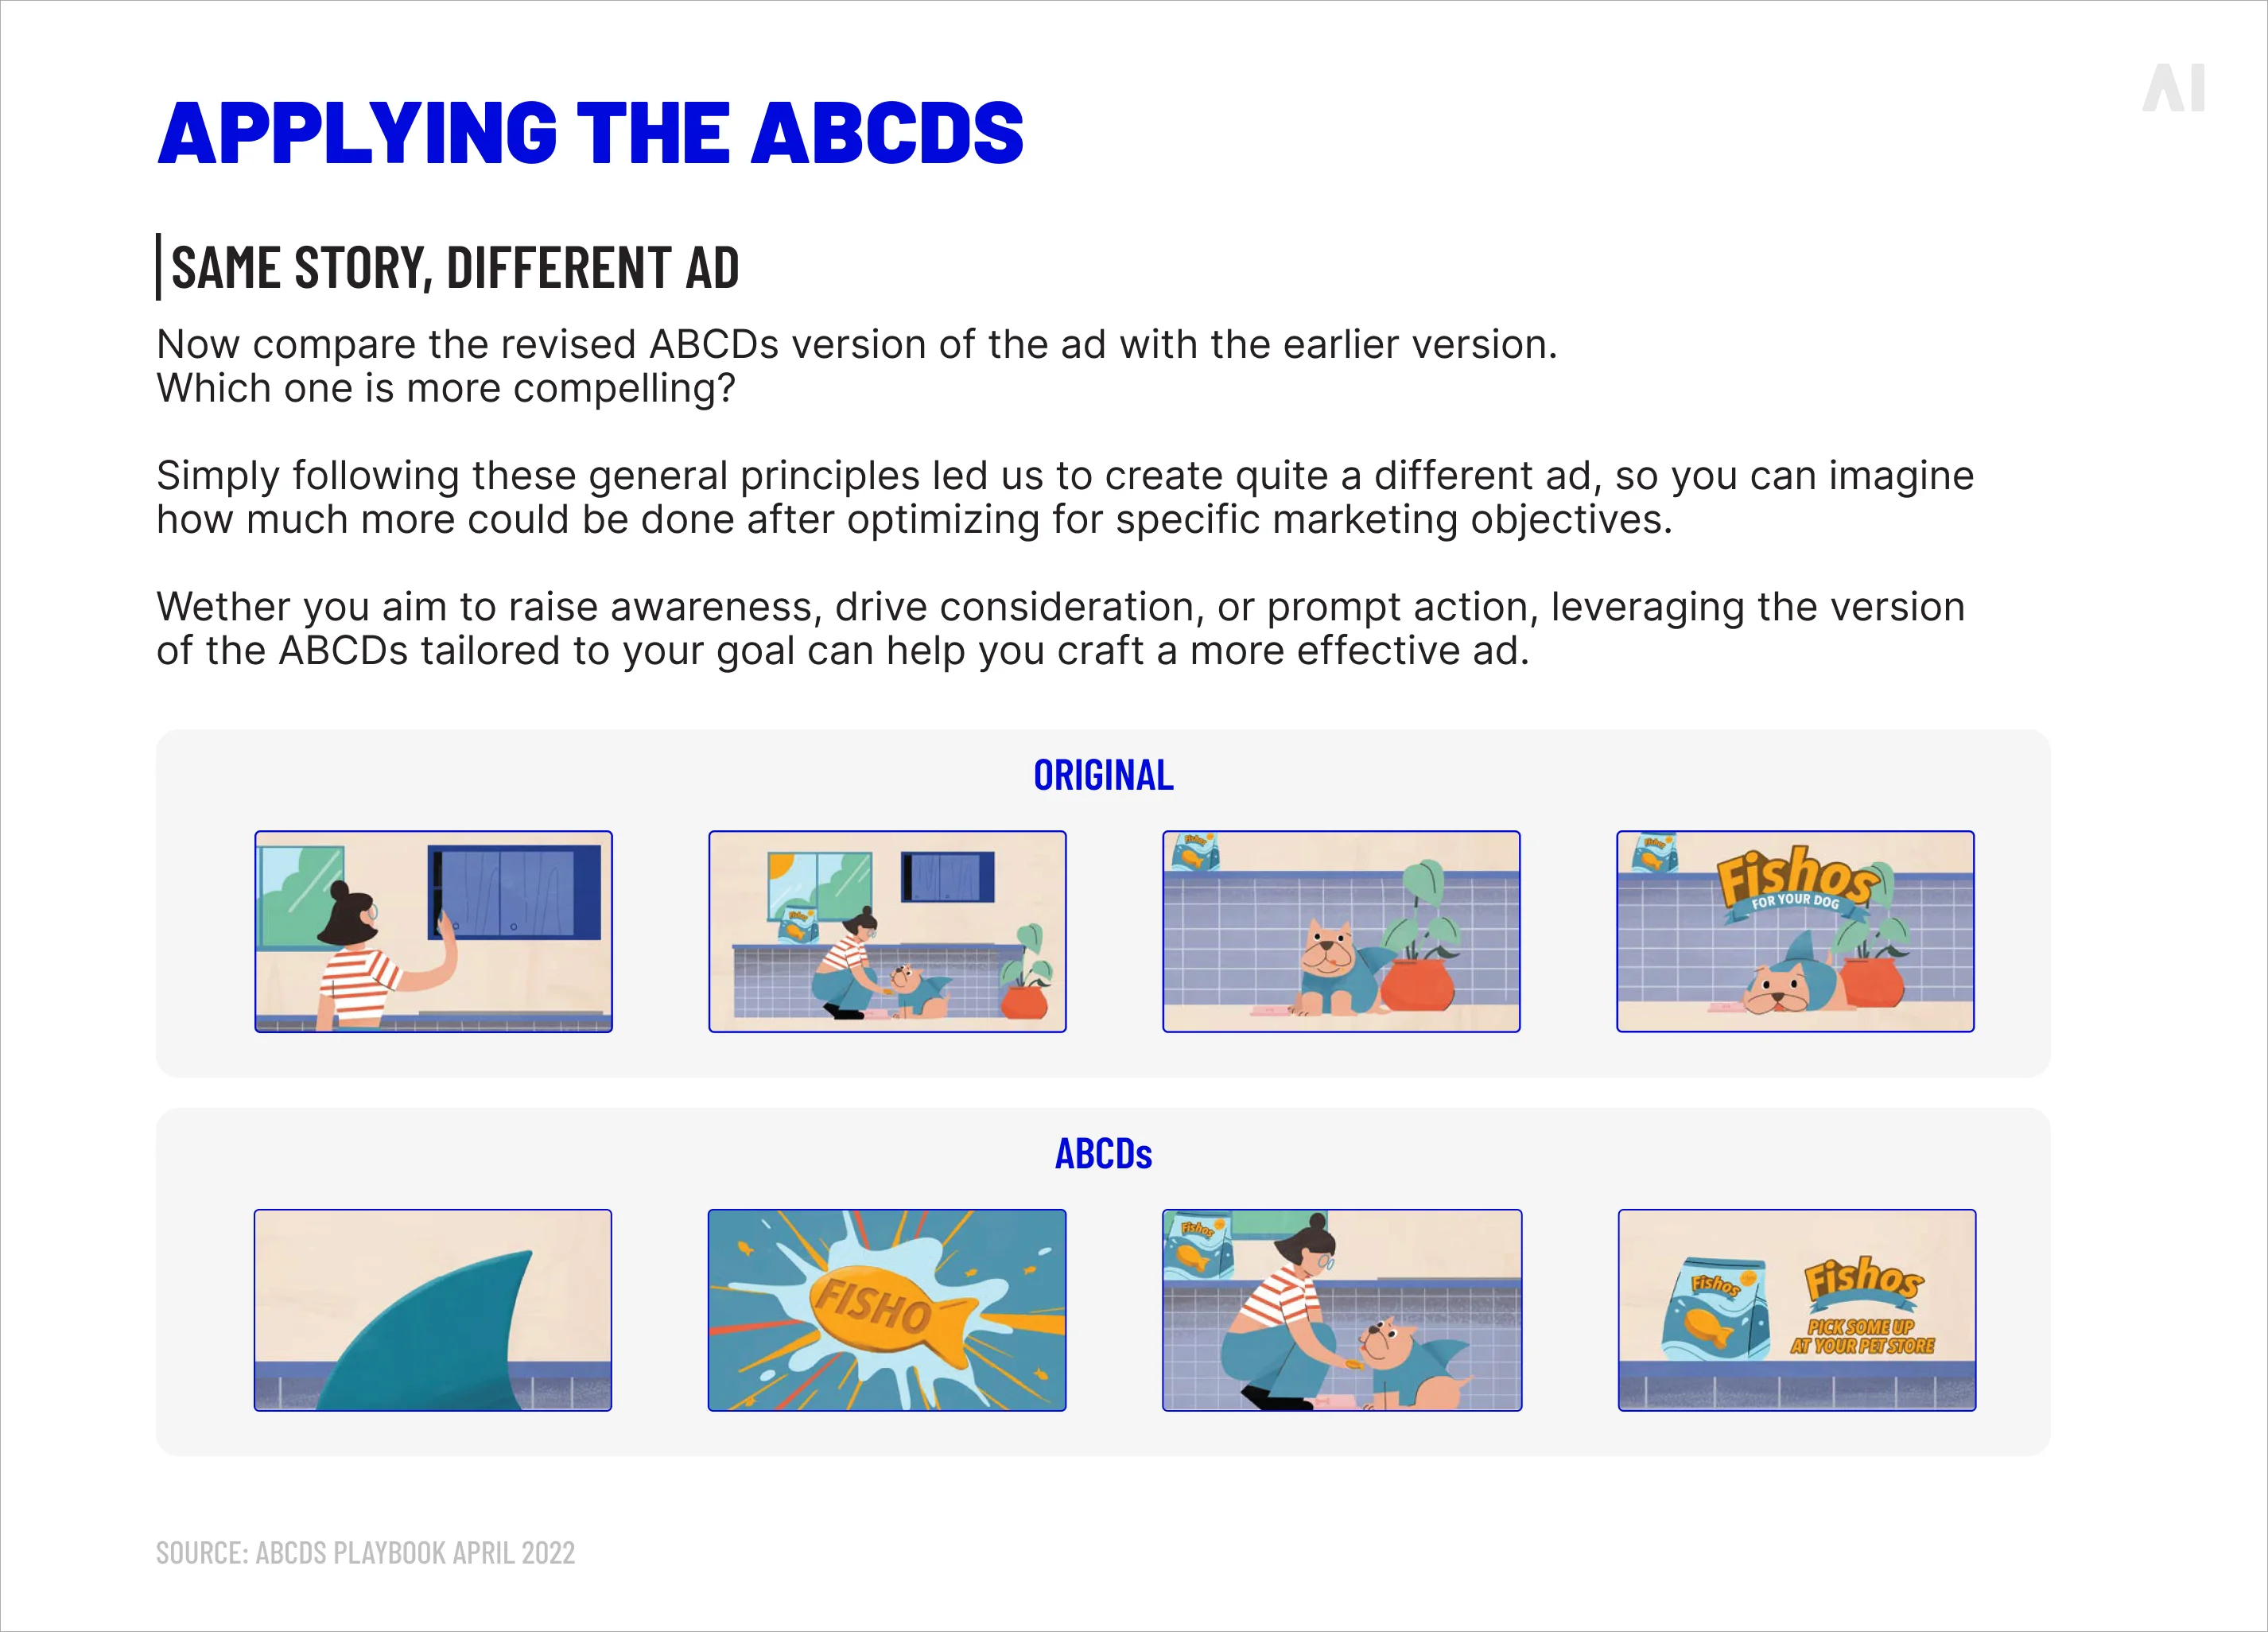
On YouTube, creative that follows the ABCD principles (Attention, Branding, Connection, Direction) delivers ~30% higher sales lift than creative that does not.
📍 Map CTA language to your objective (view, visit, lead, sale).
Leverage first-party data & AI for targeting
Sync hashed CRM/site lists for suppression, reacquisition, and lookalikes. Use AI-assisted bidding where available to optimize toward business outcomes.
Example: Omnicom’s AI bidding program reported +567% video ROAS and +153% YouTube ROAS for a large client when optimizing to offline sales signals.
Lock a learning tranche (10–20%) to A/B openers, CTAs, and lengths. Read early indicators (quartile completion, VTR, CTR, CPCV/CPV) by creative and audience, then promote winners.
Sequencing works: Google’s own video sequencing tests show 80–110% higher brand lift and 50–70% lower cost per lifted user vs. non-sequenced approaches.
📍 Use built-in Brand Lift and third-party sales-lift to validate impact.
Checklist you can apply next flight:
☑️ Ship a modular asset kit (6s / 10–15s / 30s) with captions and visible CTAs.
☑️ Cap frequency by stage; plan OLV + CTV for deduplicated reach.
☑️ Start with first-party seeds; expand with lookalikes and contextual packages.
☑️ Reserve 10–20% for creative and audience tests; decide promotion rules upfront.
☑️ Instrument Brand Lift and third-party sales-lift (e.g., NCS, Circana) to prove incrementality; fold results into MMM. (Circana added coverage for Shorts and In-feed in 2025.)
Conclusion on OLV media
OLV advertising gives marketers a flexible way to reach people across phones, tablets, and computers while pairing neatly with the big-screen impact of CTV. It isn’t the same as OTT or CTV, but it complements both: OLV brings clickable formats, granular targeting, and rapid optimization; OTT/CTV bring premium, lean-back viewing and high completion. The right mix depends on your goal (reach vs. response), budget, and audience—plus how you plan to measure outcomes across screens.
As streaming usage grows and buying becomes more automated, OLV will take an even larger role in delivering measurable, high-impact video experiences.
If you want a partner to plan, activate, and prove impact across OLV and CTV, we can help:
DSP-agnostic, transparent execution through our Open Garden approach—built to give you neutral access to inventory, unified cross-platform insight, and control over where every dollar goes.
Managed services that combine AI and human expertise, operate across 15+ DSPs, and optimize to your business KPIs.
Smart Supply curation with brand-safe, premium inventory, SPO to cut waste, and transparent reporting.
Elevate, our intelligence platform for cross-platform insight and real-time optimization—predictive planning, automated budget shifts, and KPI-aligned bidding, with proven efficiency gains.
Ready to build a cross-screen plan that proves outcomes? Reach out to AI Digital—we’ll design the OLV/CTV mix, orchestrate the right supply, and instrument lift and attribution so you can scale what works.
Blind spot
Key issues
Business impact
AI Digital solution
Lack of transparency in AI models
• Platforms own AI models and train on proprietary data • Brands have little visibility into decision-making • "Walled gardens" restrict data access
• Inefficient ad spend • Limited strategic control • Eroded consumer trust • Potential budget mismanagement
Open Garden framework providing: • Complete transparency • DSP-agnostic execution • Cross-platform data & insights
Optimizing ads vs. optimizing impact
• AI excels at short-term metrics but may struggle with brand building • Consumers can detect AI-generated content • Efficiency might come at cost of authenticity
• Short-term gains at expense of brand health • Potential loss of authentic connection • Reduced effectiveness in storytelling
Smart Supply offering: • Human oversight of AI recommendations • Custom KPI alignment beyond clicks • Brand-safe inventory verification
The illusion of personalization
• Segment optimization rebranded as personalization • First-party data infrastructure challenges • Personalization vs. surveillance concerns
• Potential mismatch between promise and reality • Privacy concerns affecting consumer trust • Cost barriers for smaller businesses
Elevate platform features: • Real-time AI + human intelligence • First-party data activation • Ethical personalization strategies
AI-Driven efficiency vs. decision-making
• AI shifting from tool to decision-maker • Black box optimization like Google Performance Max • Human oversight limitations
• Strategic control loss • Difficulty questioning AI outputs • Inability to measure granular impact • Potential brand damage from mistakes
Managed Service with: • Human strategists overseeing AI • Custom KPI optimization • Complete campaign transparency
Fig. 1. Summary of AI blind spots in advertising
Dimension
Walled garden advantage
Walled garden limitation
Strategic impact
Audience access
Massive, engaged user bases
Limited visibility beyond platform
Reach without understanding
Data control
Sophisticated targeting tools
Data remains siloed within platform
Fragmented customer view
Measurement
Detailed in-platform metrics
Inconsistent cross-platform standards
Difficult performance comparison
Intelligence
Platform-specific insights
Limited data portability
Restricted strategic learning
Optimization
Powerful automated tools
Black-box algorithms
Reduced marketer control
Fig. 2. Strategic trade-offs in walled garden advertising.
Core issue
Platform priority
Walled garden limitation
Real-world example
Attribution opacity
Claiming maximum credit for conversions
Limited visibility into true conversion paths
Meta and TikTok's conflicting attribution models after iOS privacy updates
Data restrictions
Maintaining proprietary data control
Inability to combine platform data with other sources
Amazon DSP's limitations on detailed performance data exports
Cross-channel blindspots
Keeping advertisers within ecosystem
Fragmented view of customer journey
YouTube/DV360 campaigns lacking integration with non-Google platforms
Black box algorithms
Optimizing for platform revenue
Reduced control over campaign execution
Self-serve platforms using opaque ML models with little advertiser input
Performance reporting
Presenting platform in best light
Discrepancies between platform-reported and independently measured results
Consistently higher performance metrics in platform reports vs. third-party measurement
Fig. 1. The Walled garden misalignment: Platform interests vs. advertiser needs.
Key dimension
Challenge
Strategic imperative
ROAS volatility
Softer returns across digital channels
Shift from soft KPIs to measurable revenue impact
Media planning
Static plans no longer effective
Develop agile, modular approaches adaptable to changing conditions
Brand/performance
Traditional division dissolving
Create full-funnel strategies balancing long-term equity with short-term conversion
Capability
Key features
Benefits
Performance data
Elevate forecasting tool
• Vertical-specific insights • Historical data from past economic turbulence • "Cascade planning" functionality • Real-time adaptation
• Provides agility to adjust campaign strategy based on performance • Shows which media channels work best to drive efficient and effective performance • Confident budget reallocation • Reduces reaction time to market shifts
• Dataset from 10,000+ campaigns • Cuts response time from weeks to minutes
• Reaches people most likely to buy • Avoids wasted impressions and budgets on poor-performing placements • Context-aligned messaging
• 25+ billion bid requests analyzed daily • 18% improvement in working media efficiency • 26% increase in engagement during recessions
Full-funnel accountability
• Links awareness campaigns to lower funnel outcomes • Tests if ads actually drive new business • Measures brand perception changes • "Ask Elevate" AI Chat Assistant
• Upper-funnel to outcome connection • Sentiment shift tracking • Personalized messaging • Helps balance immediate sales vs. long-term brand building
• Natural language data queries • True business impact measurement
Open Garden approach
• Cross-platform and channel planning • Not locked into specific platforms • Unified cross-platform reach • Shows exactly where money is spent
• Reduces complexity across channels • Performance-based ad placement • Rapid budget reallocation • Eliminates platform-specific commitments and provides platform-based optimization and agility
• Coverage across all inventory sources • Provides full visibility into spending • Avoids the inability to pivot across platform as you’re not in a singular platform
Fig. 1. How AI Digital helps during economic uncertainty.
Trend
What it means for marketers
Supply & demand lines are blurring
Platforms from Google (P-Max) to Microsoft are merging optimization and inventory in one opaque box. Expect more bundled “best available” media where the algorithm, not the trader, decides channel and publisher mix.
Walled gardens get taller
Microsoft’s O&O set now spans Bing, Xbox, Outlook, Edge and LinkedIn, which just launched revenue-sharing video programs to lure creators and ad dollars. (Business Insider)
Retail & commerce media shape strategy
Microsoft’s Curate lets retailers and data owners package first-party segments, an echo of Amazon’s and Walmart’s approaches. Agencies must master seller-defined audiences as well as buyer-side tactics.
AI oversight becomes critical
Closed AI bidding means fewer levers for traders. Independent verification, incrementality testing and commercial guardrails rise in importance.
Fig. 1. Platform trends and their implications.
Metric
Connected TV (CTV)
Linear TV
Video Completion Rate
94.5%
70%
Purchase Rate After Ad
23%
12%
Ad Attention Rate
57% (prefer CTV ads)
54.5%
Viewer Reach (U.S.)
85% of households
228 million viewers
Retail Media Trends 2025
Access Complete consumer behaviour analyses and competitor benchmarks.
Identify and categorize audience groups based on behaviors, preferences, and characteristics
Michaels Stores: Implemented a genAI platform that increased email personalization from 20% to 95%, leading to a 41% boost in SMS click through rates and a 25% increase in engagement.
Estée Lauder: Partnered with Google Cloud to leverage genAI technologies for real-time consumer feedback monitoring and analyzing consumer sentiment across various channels.
High
Medium
Automated ad campaigns
Automate ad creation, placement, and optimization across various platforms
Showmax: Partnered with AI firms toautomate ad creation and testing, reducing production time by 70% while streamlining their quality assurance process.
Headway: Employed AI tools for ad creation and optimization, boosting performance by 40% and reaching 3.3 billion impressions while incorporating AI-generated content in 20% of their paid campaigns.
High
High
Brand sentiment tracking
Monitor and analyze public opinion about a brand across multiple channels in real time
L’Oréal: Analyzed millions of online comments, images, and videos to identify potential product innovation opportunities, effectively tracking brand sentiment and consumer trends.
Kellogg Company: Used AI to scan trending recipes featuring cereal, leveraging this data to launch targeted social campaigns that capitalize on positive brand sentiment and culinary trends.
High
Low
Campaign strategy optimization
Analyze data to predict optimal campaign approaches, channels, and timing
DoorDash: Leveraged Google’s AI-powered Demand Gen tool, which boosted its conversion rate by 15 times and improved cost per action efficiency by 50% compared with previous campaigns.
Kitsch: Employed Meta’s Advantage+ shopping campaigns with AI-powered tools to optimize campaigns, identifying and delivering top-performing ads to high-value consumers.
High
High
Content strategy
Generate content ideas, predict performance, and optimize distribution strategies
JPMorgan Chase: Collaborated with Persado to develop LLMs for marketing copy, achieving up to 450% higher clickthrough rates compared with human-written ads in pilot tests.
Hotel Chocolat: Employed genAI for concept development and production of its Velvetiser TV ad, which earned the highest-ever System1 score for adomestic appliance commercial.
High
High
Personalization strategy development
Create tailored messaging and experiences for consumers at scale
Stitch Fix: Uses genAI to help stylists interpret customer feedback and provide product recommendations, effectively personalizing shopping experiences.
Instacart: Uses genAI to offer customers personalized recipes, mealplanning ideas, and shopping lists based on individual preferences and habits.
Medium
Medium
Share article
Url copied to clipboard
No items found.
Subscribe to our Newsletter
THANK YOU FOR YOUR SUBSCRIPTION
Oops! Something went wrong while submitting the form.
Questions? We have answers
Is Netflix OLV?
Not typically. Netflix is an OTT streaming service. Ads on its ad-supported tier are OTT, and when viewed on a smart TV they’re counted as CTV. If watched on a phone or laptop, they behave like digital video, but most plans still categorize Netflix as OTT/CTV rather than OLV.
Is YouTube OTT or OLV?
Both—device decides. YouTube on a TV app is CTV (and OTT). YouTube on desktop or mobile is OLV. Many plans split reporting by device for that reason.
Are OLV ads skippable?
Often, yes. Skippable in-stream is common, but there are also non-skippable 15s (and 6s bumper) units. Outstream usually autoplays muted and is “scroll-skippable.” Social video skippability varies by placement.
What formats are included in OLV?
In-stream (pre-roll, mid-roll, post-roll), outstream (in-article/in-feed), social video (Reels, Shorts, Stories), native video, and shoppable/interactive video, plus 6-second bumpers and vertical/square cuts for mobile.
Is OLV cost-effective?
It can be. OLV typically delivers lower CPM/CPV than premium CTV and supports clicks, retargeting, and rapid optimization. Cost-effectiveness hinges on creative quality, targeting, frequency control, and clear outcome measurement (e.g., CPCV/CPA/ROAS).
What are the most prominent OLV advertising examples?
Recent, well-documented OLV examples include L’Oréal USA’s meta-analysis of ~30 Nielsen Catalina Solutions sales-lift studies, which found ~6% average sales lift from YouTube activity and ~6:1 ROAS on YouTube CTV screens; DocuSign’s CTV-dedicated YouTube campaign that delivered +33% ad-recall lift and +126% conversion lift; and Adidas’s YouTube sequencing work showing +33% brand awareness and +317% product-interest lift.
What is OLV full form?
The OLV acronym stands for online video; in advertising, “OLV advertising” means video ads delivered on web and app environments (desktop, mobile, social, and streaming off-TV).
Have other questions?
If you have more questions, contact us so we can help.
.webp)
.webp)
.svg)
.svg)


%20Platform%20Providers%20for%20Businesses%20in%202026.webp)