CTR vs CPC vs CPM vs CPA vs CPV: Understanding Ad Metrics and Pricing Models
Mary Gabrielyan
May 6, 2026
14
minutes read
Digital advertising runs on five core metrics — CTR, CPC, CPM, CPA, and CPV — but knowing what each abbreviation stands for is not the same as knowing when to use one over another. In this article, we break down how each metric and pricing model works, where it fits in the marketing funnel, and how to combine them into a measurement framework that connects media spend to real business outcomes.
Every digital campaign generates data, but not all of that data tells the same story. Click-through rate (CTR), cost per click (CPC), cost per mille (CPM), cost per acquisition (CPA), and cost per view (CPV) each measure something different — engagement, traffic cost, reach, conversions, or video attention—yet they all feed into the same question: is this campaign delivering results worth the spend? For marketers managing budgets across search, display, video, and connected TV, understanding how these metrics and pricing models work individually is only the starting point. The real advantage comes from knowing how they interact, where they overlap, and when one should take priority over another.
This guide breaks down each metric and pricing model in practical terms — formulas, use cases, pitfalls, and direct comparisons — so that media planners and performance marketers can align measurement with campaign goals rather than defaulting to a single KPI.
Modern campaigns rarely operate on one metric alone. A brand awareness push might optimize for CPM while tracking CTR as a quality signal. A performance campaign might bid on CPC while measuring CPA as the ultimate success indicator. The most effective media strategies treat these metrics as complementary signals across the funnel — awareness through conversion — rather than isolated data points competing for attention. Aligning the right combination with each campaign objective is what separates strategic planning from reactive reporting.
Before comparing CTR, CPC, CPM, CPA, and CPV directly, it helps to separate two concepts that are often conflated: ad metrics and pricing models.
Ad metrics are measurement tools. They tell you how a campaign performed after the fact — how many people clicked, how many converted, how much attention your creative captured. CTR and CPA fall primarily into this category. They exist to evaluate outcomes.
Pricing models, by contrast, determine how you pay for media. CPM, CPC, and CPV are buying mechanisms—they define the unit of transaction between an advertiser and a platform or publisher. When you run a display campaign on a CPM basis, you are agreeing to pay a set rate per thousand impressions regardless of how many clicks or conversions those impressions produce.
Look at where they overlap, and the picture gets considerably more interesting. CPC functions as both a pricing model (you pay per click) and a performance metric (your cost per click tells you how efficiently your budget generates traffic). CPM works the same way — it is simultaneously a buying model and a measure of reach efficiency. This dual nature means that a single abbreviation can mean different things depending on context: a media buyer negotiating CPM rates is having a different conversation from a campaign analyst reviewing CPM as a benchmark for audience reach.
In programmatic advertising, where auctions happen in milliseconds across demand-side platforms (DSPs) and supply-side platforms (SSPs), this distinction matters more than ever. The pricing model you select at the bidding stage directly shapes which metrics matter for optimization.
Choose CPM bidding and your priority is impression volume and frequency management.
Choose CPC bidding and you are telling the algorithm to optimize for clicks, which shifts how and where your ads are served.
Understanding this relationship—that metrics evaluate and pricing models transact—is the foundation for everything that follows.
CTR: Measuring engagement and creative effectiveness
Click-through rate measures the percentage of people who see an ad and click on it. At its core, CTR answers a simple question: did this creative capture enough attention and interest to prompt action? That makes it one of the most direct indicators of how well an ad resonates with its audience, and it is especially valuable at the top and middle of the funnel where the goal is to generate engagement and qualified traffic rather than immediate conversions.
CTR formula
The CTR formula is as follows:
CTR = (Clicks ÷ Impressions) × 100
If an ad receives 500 clicks from 100,000 impressions, its CTR is 0.5%. The result tells you the proportion of viewers who found the ad compelling enough to interact with—a reflection of both creative quality and targeting precision.
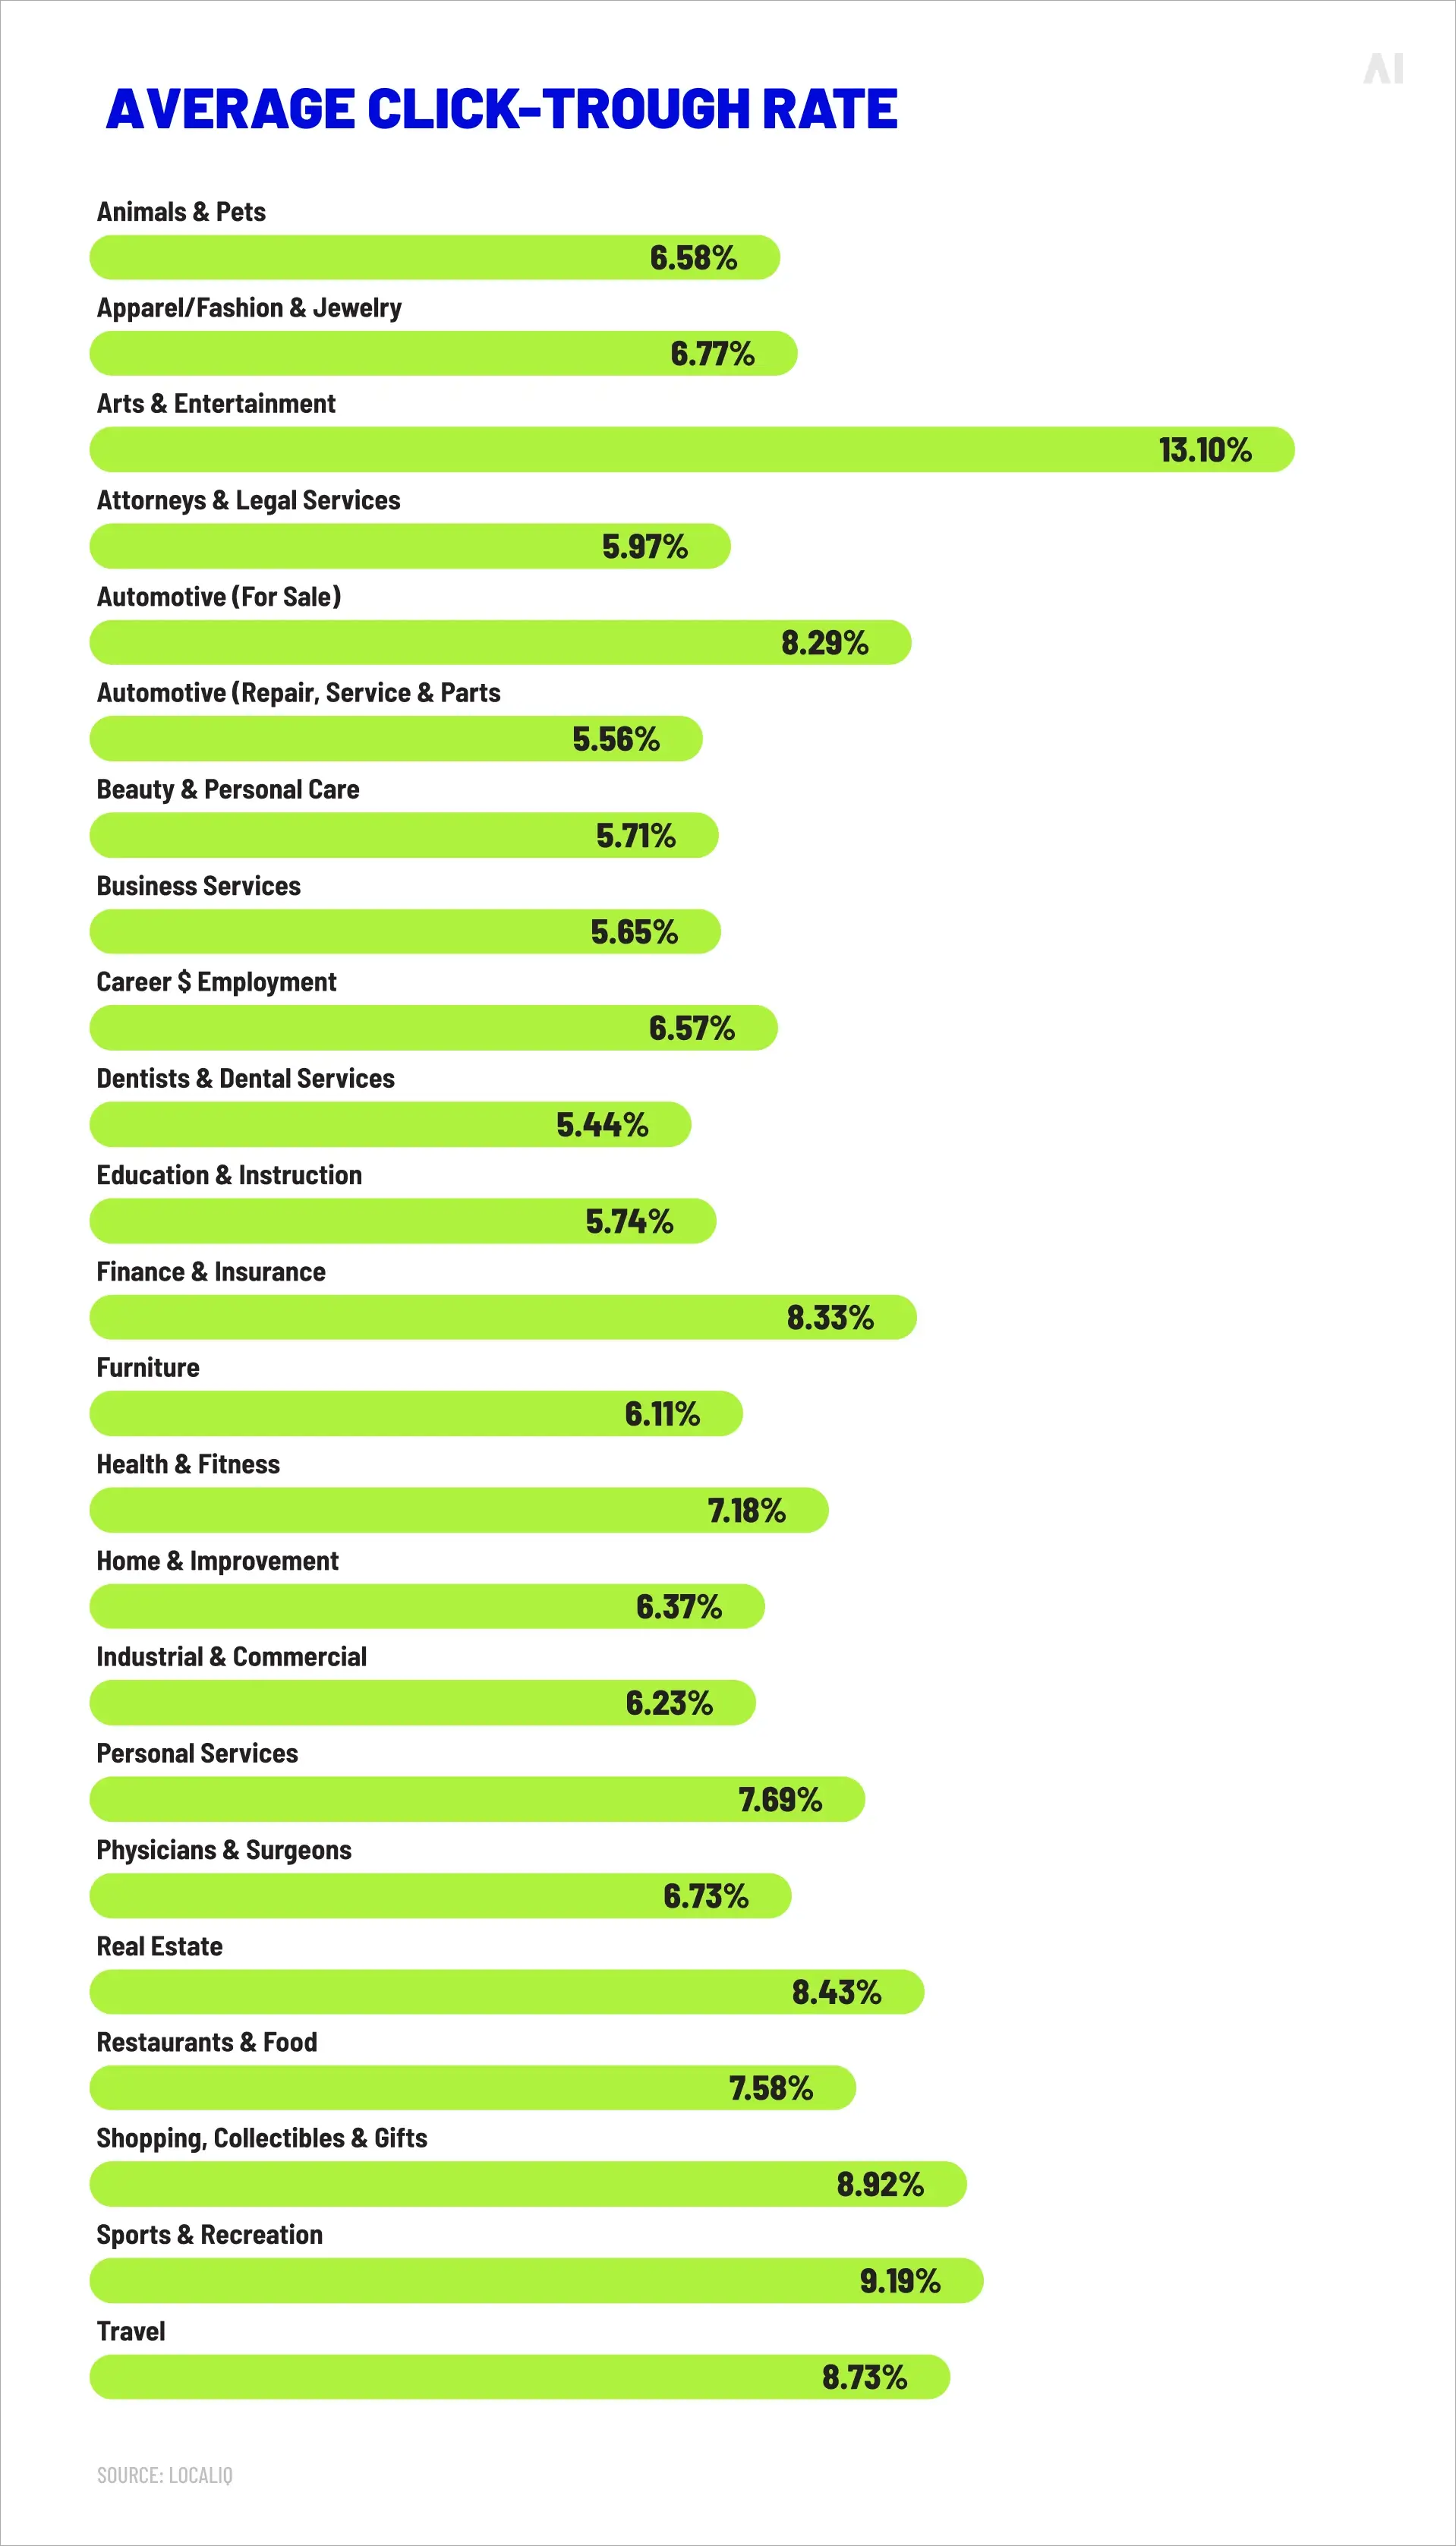
What counts as a strong CTR varies significantly by channel and format. Benchmark data points in the same direction, though they should be treated as directional rather than perfectly comparable. LocaliQ’s 2025 search advertising benchmarks found an average search CTR of 6.66%, while older WordStream Google Ads benchmark data put average display CTR at 0.46%. The gap reflects the fact that search ads capture active intent, whereas display ads typically reach users during browsing behavior earlier in the journey.
CTR is most strategically useful in three scenarios.
Creative testing. When running A/B tests across ad variations, CTR is the clearest signal of which headline, image, or call-to-action combination resonates. A statistically significant CTR difference between two creatives gives you actionable data before you have enough conversion volume to optimize on CPA.
Prospecting campaigns. When reaching cold audiences for the first time, CTR helps gauge whether your messaging and targeting alignment is working. A prospecting campaign with a rising CTR indicates growing relevance; a declining one signals audience fatigue or poor fit.
Traffic growth. For campaigns where the primary KPI is driving qualified visitors to a landing page, blog, or product page, CTR directly measures progress toward that goal.
⚡ A high CTR tells you the ad is working. It does not tell you what happens after the click. Always evaluate CTR alongside post-click metrics.
CTR pitfalls and how to avoid them
The most common mistake with CTR is treating it as a success metric in isolation. A display ad with a 1.2% CTR looks impressive against the 0.46% industry average, but if those clicks produce a bounce rate above 80% and zero conversions, the high CTR is masking poor traffic quality—or a disconnect between the ad's promise and the landing page experience.
Another risk is click fraud and accidental clicks, particularly on mobile placements where small screens and touch interfaces inflate CTR artificially. Retargeting campaigns tend to produce higher CTRs (often 0.7%–1.2% for display, per industry estimates) because they reach users who already know the brand, but this does not necessarily mean the creative itself is stronger.
To avoid these traps, evaluate CTR alongside CPC (are you paying more for those clicks?), CPA (are those clicks converting?), and bounce rate (are those visitors engaging?). A balanced view prevents CTR from becoming a vanity metric.
Cost per click measures how much an advertiser pays each time someone clicks on an ad. While CTR tells you whether people are clicking, CPC tells you what each of those clicks costs—making it a direct measure of traffic acquisition efficiency and a critical input for budget planning.
CPC formula
The CPC formula is as follows:
CPC = Total Ad Spend ÷ Total Clicks
If a campaign spends $5,000 and generates 2,000 clicks, the CPC is $2.50. A rising CPC can signal intensifying competition for your target audience, declining ad relevance (which lowers quality scores on platforms like Google Ads), or seasonal demand spikes. A falling CPC, meanwhile, may indicate improved creative performance, better targeting, or reduced competitive pressure.
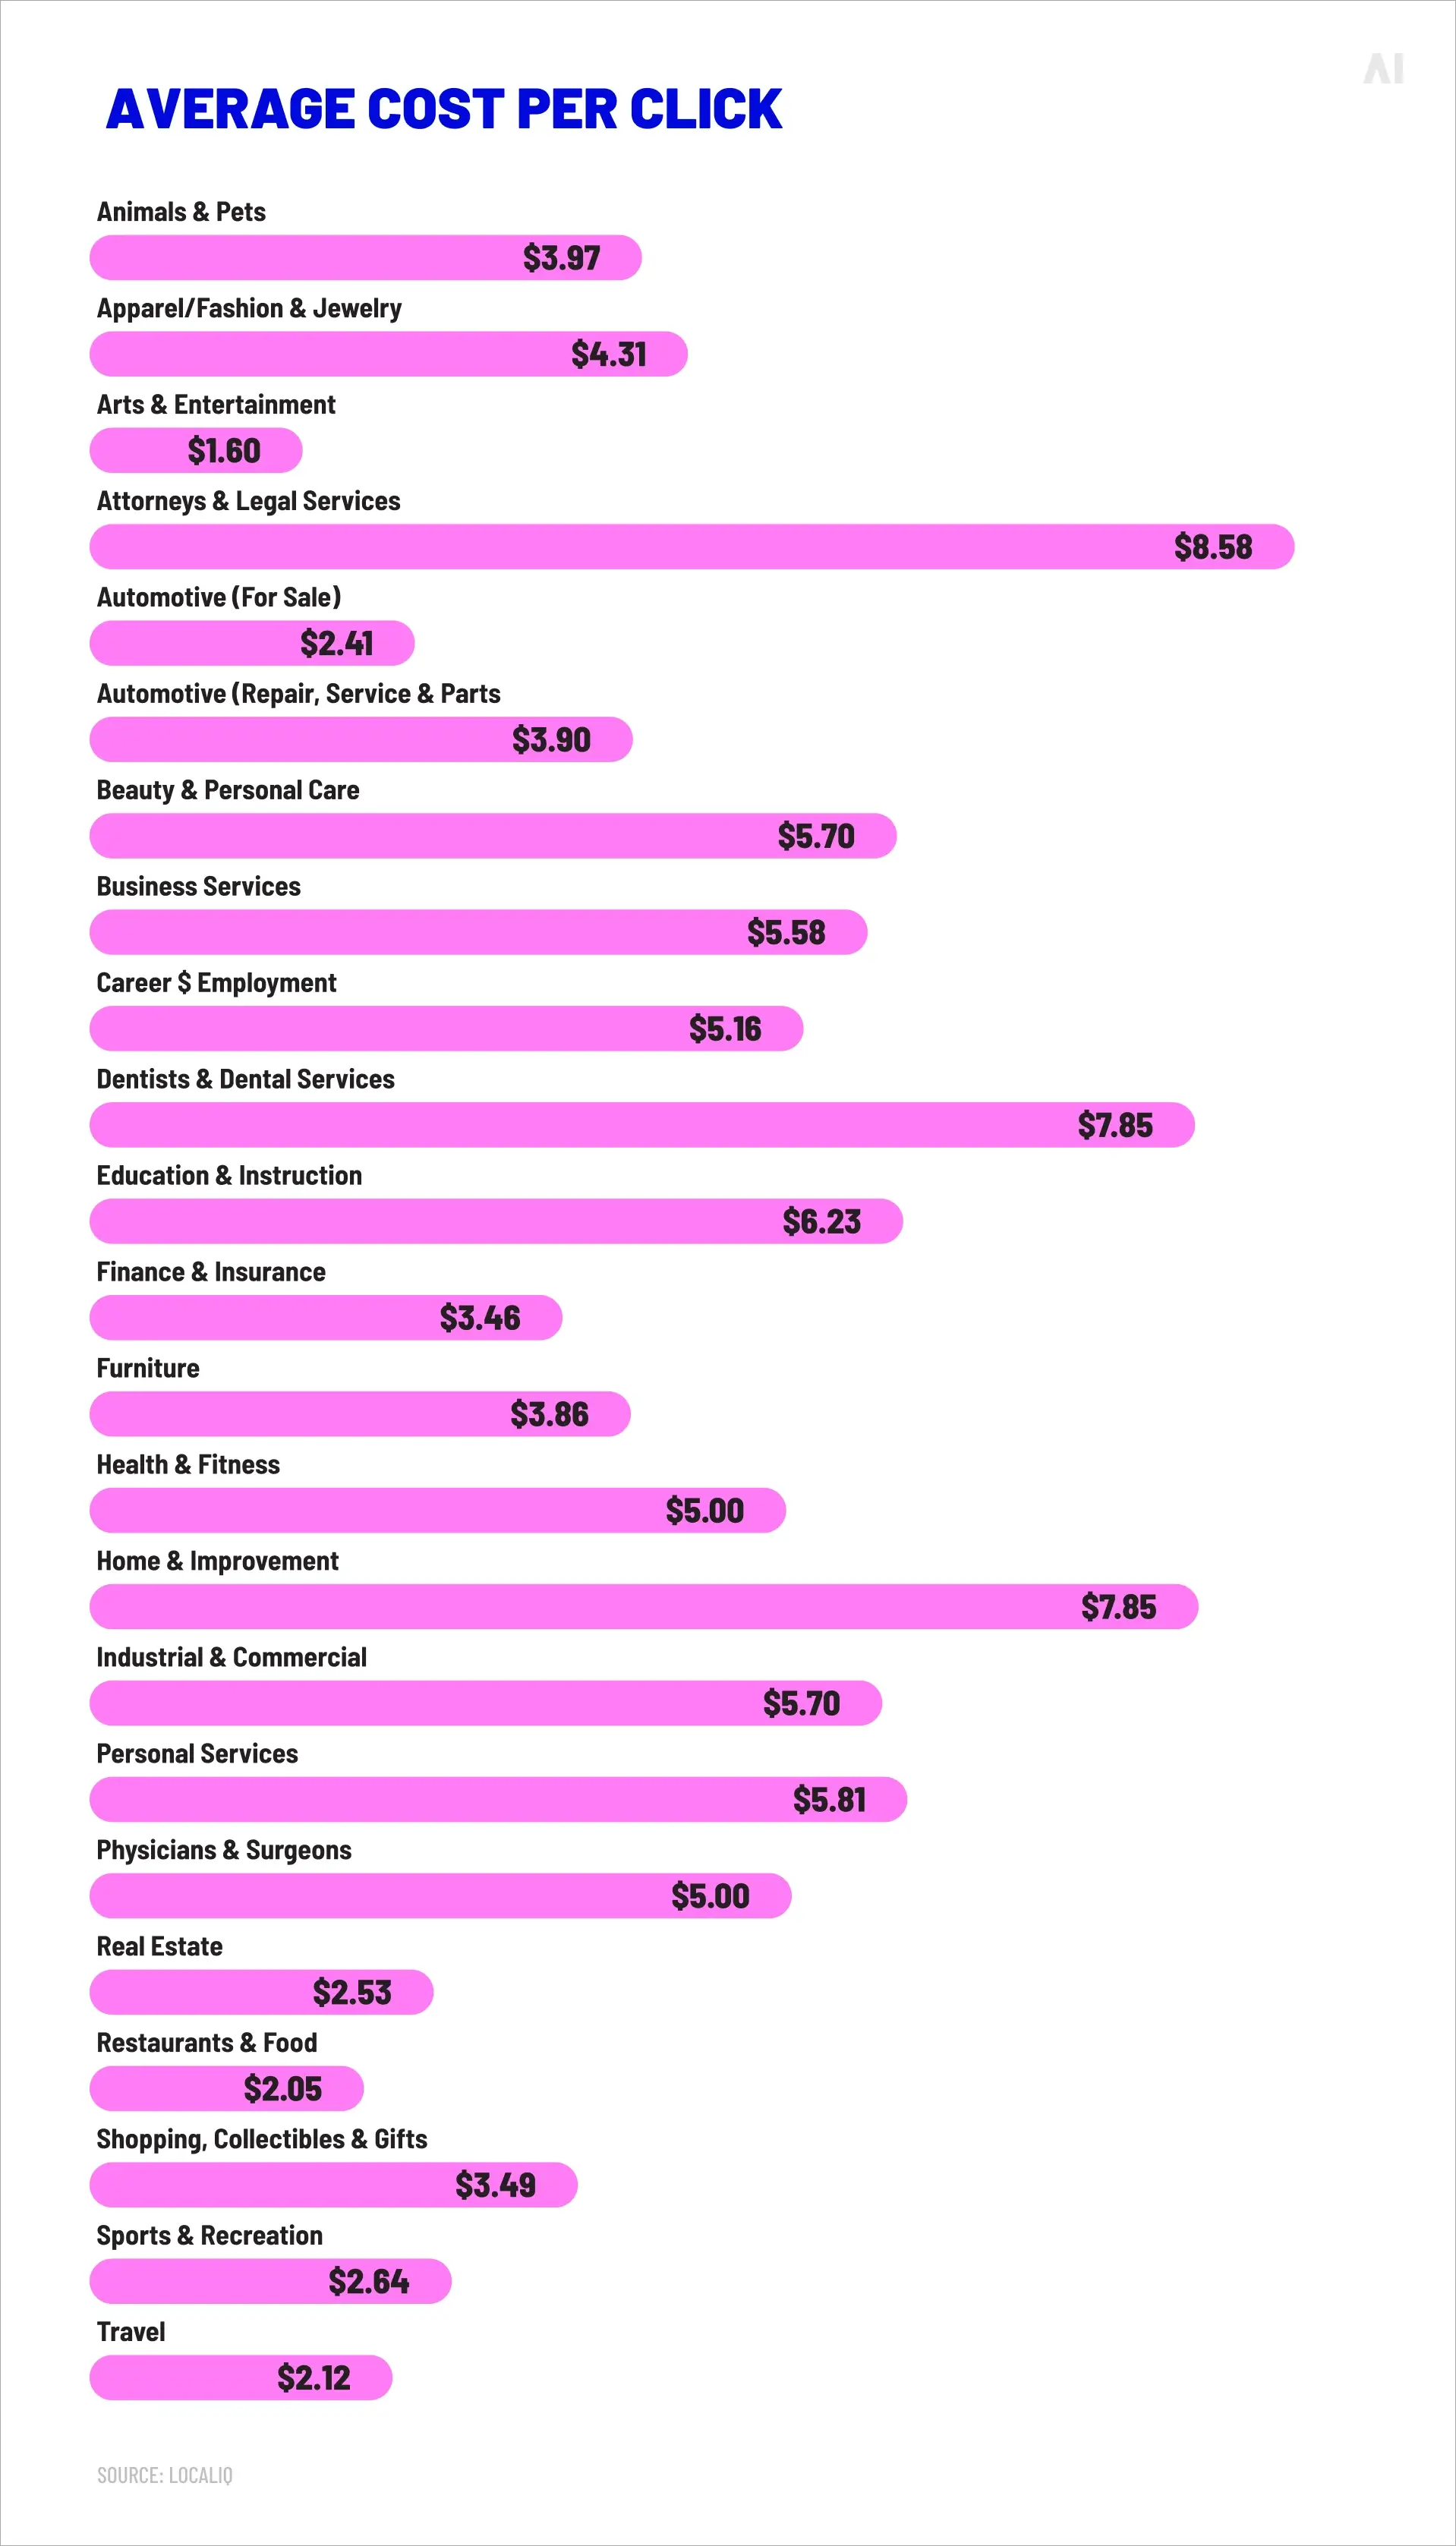
For context, WordStream by LocaliQ’s 2025 benchmark report, based on more than 16,000 U.S.-based campaigns, found an average search CPC of $5.26, with costs ranging from $1.60 in arts and entertainment to $8.58 in legal services. Display CPCs are typically much lower than search CPCs because display campaigns reach users as they browse websites, apps, and Google-owned properties, rather than when they are actively searching.
CPC bidding is most effective when the campaign goal is driving a defined volume of qualified traffic within a controlled budget.
Search campaigns. Paid search is the natural home of CPC, since users are actively searching for products, services, or information. Bidding on a CPC basis aligns spend directly with demand signals.
Retargeting. When re-engaging users who have previously visited a website or engaged with content, CPC ensures you only pay for the re-engagement itself, not the impression. This makes it efficient for mid-to-lower-funnel strategies focused on bringing warm prospects back.
Lead generation. For B2B campaigns or services with longer sales cycles, CPC allows marketers to control the cost of each inbound visit while building pipeline. The key is pairing CPC with conversion tracking so that traffic quality, not just traffic volume, informs optimization decisions.
Performance-focused traffic acquisition. E-commerce brands driving visitors to product pages often prefer CPC over CPM because it ties spend to an action (the click) rather than passive exposure. Combined with CPA tracking downstream, CPC becomes a controllable lever within a broader performance framework.
CPM: Scaling reach and awareness
Cost per mille (cost per thousand impressions) measures how much it costs to show an ad to 1,000 people. It is the standard buying currency for campaigns focused on visibility, reach, and frequency—the metrics that matter most at the top of the funnel where the objective is exposure rather than immediate action.
CPM formula
The CPM formula is as follows:
CPM = (Total Ad Spend ÷ Total Impressions) × 1,000
If a campaign spends $10,000 and delivers 2,000,000 impressions, the CPM is $5.00. Marketers interpret CPM in relation to three factors: the size of the audience reached, the frequency at which individuals were exposed to the ad, and the media efficiency relative to other available channels.
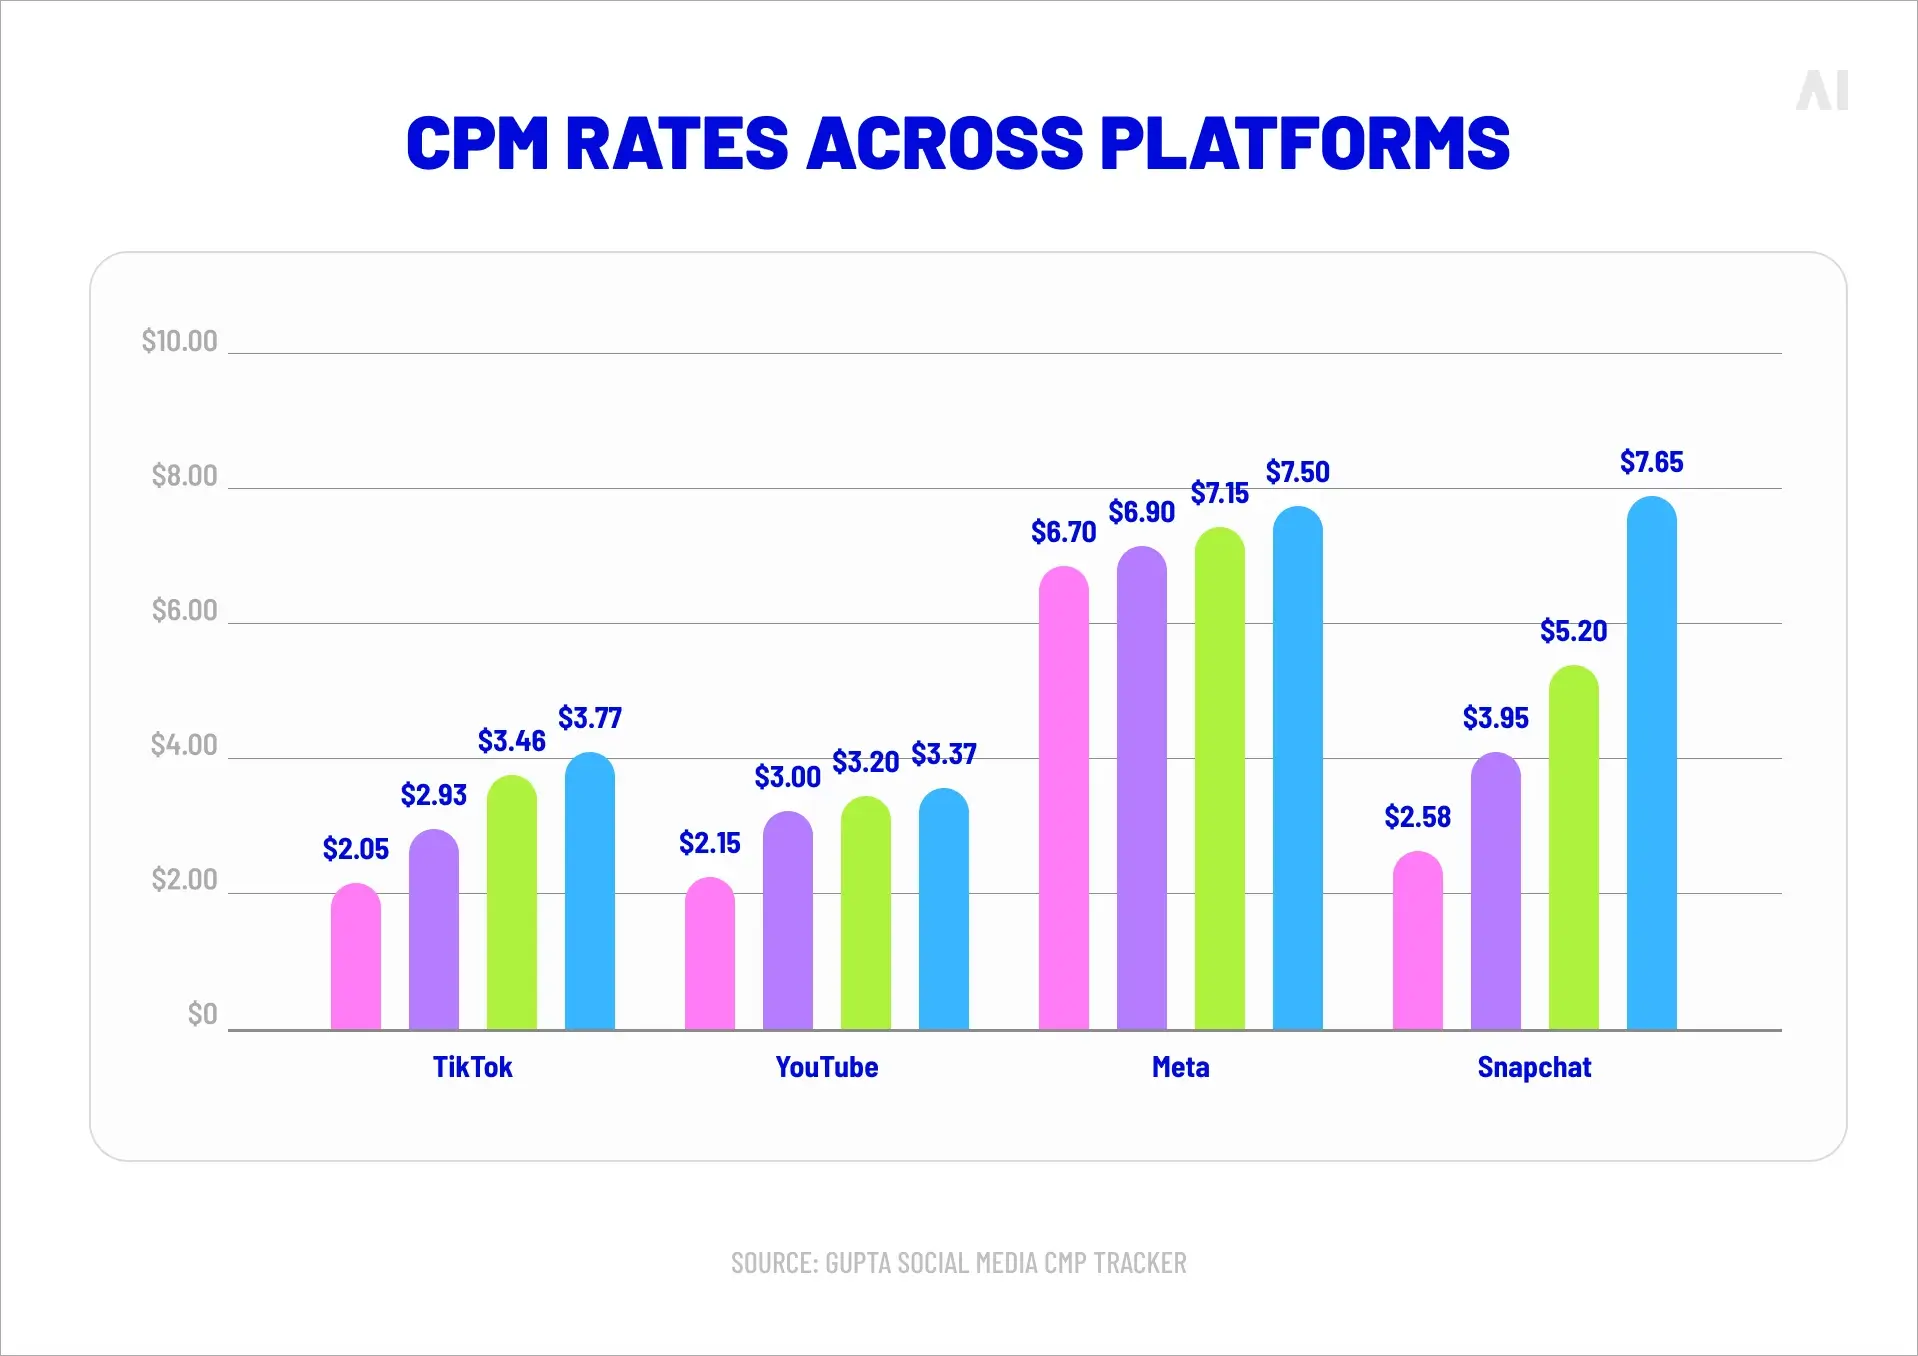
CPM rates vary sharply by channel, inventory quality, and buying path. In Pixis’s 2025 Google and Meta benchmark data, display was the cheapest Google campaign type at $2.54 CPM, though that figure reflects Pixis’s own customer base rather than a universal market average. On paid social, Gupta Media’s 2025 Social CPM Tracker reported average CPMs of $8.19 for Meta, $4.82 for TikTok, $4.99 for YouTube, $8.60 for Snapchat, and $4.67 for Pinterest. CTV typically carries a premium over open-web display, especially in private marketplace deals: Simulmedia reported average CTV PMP CPM of $15.00 versus $5.54 on the open marketplace.
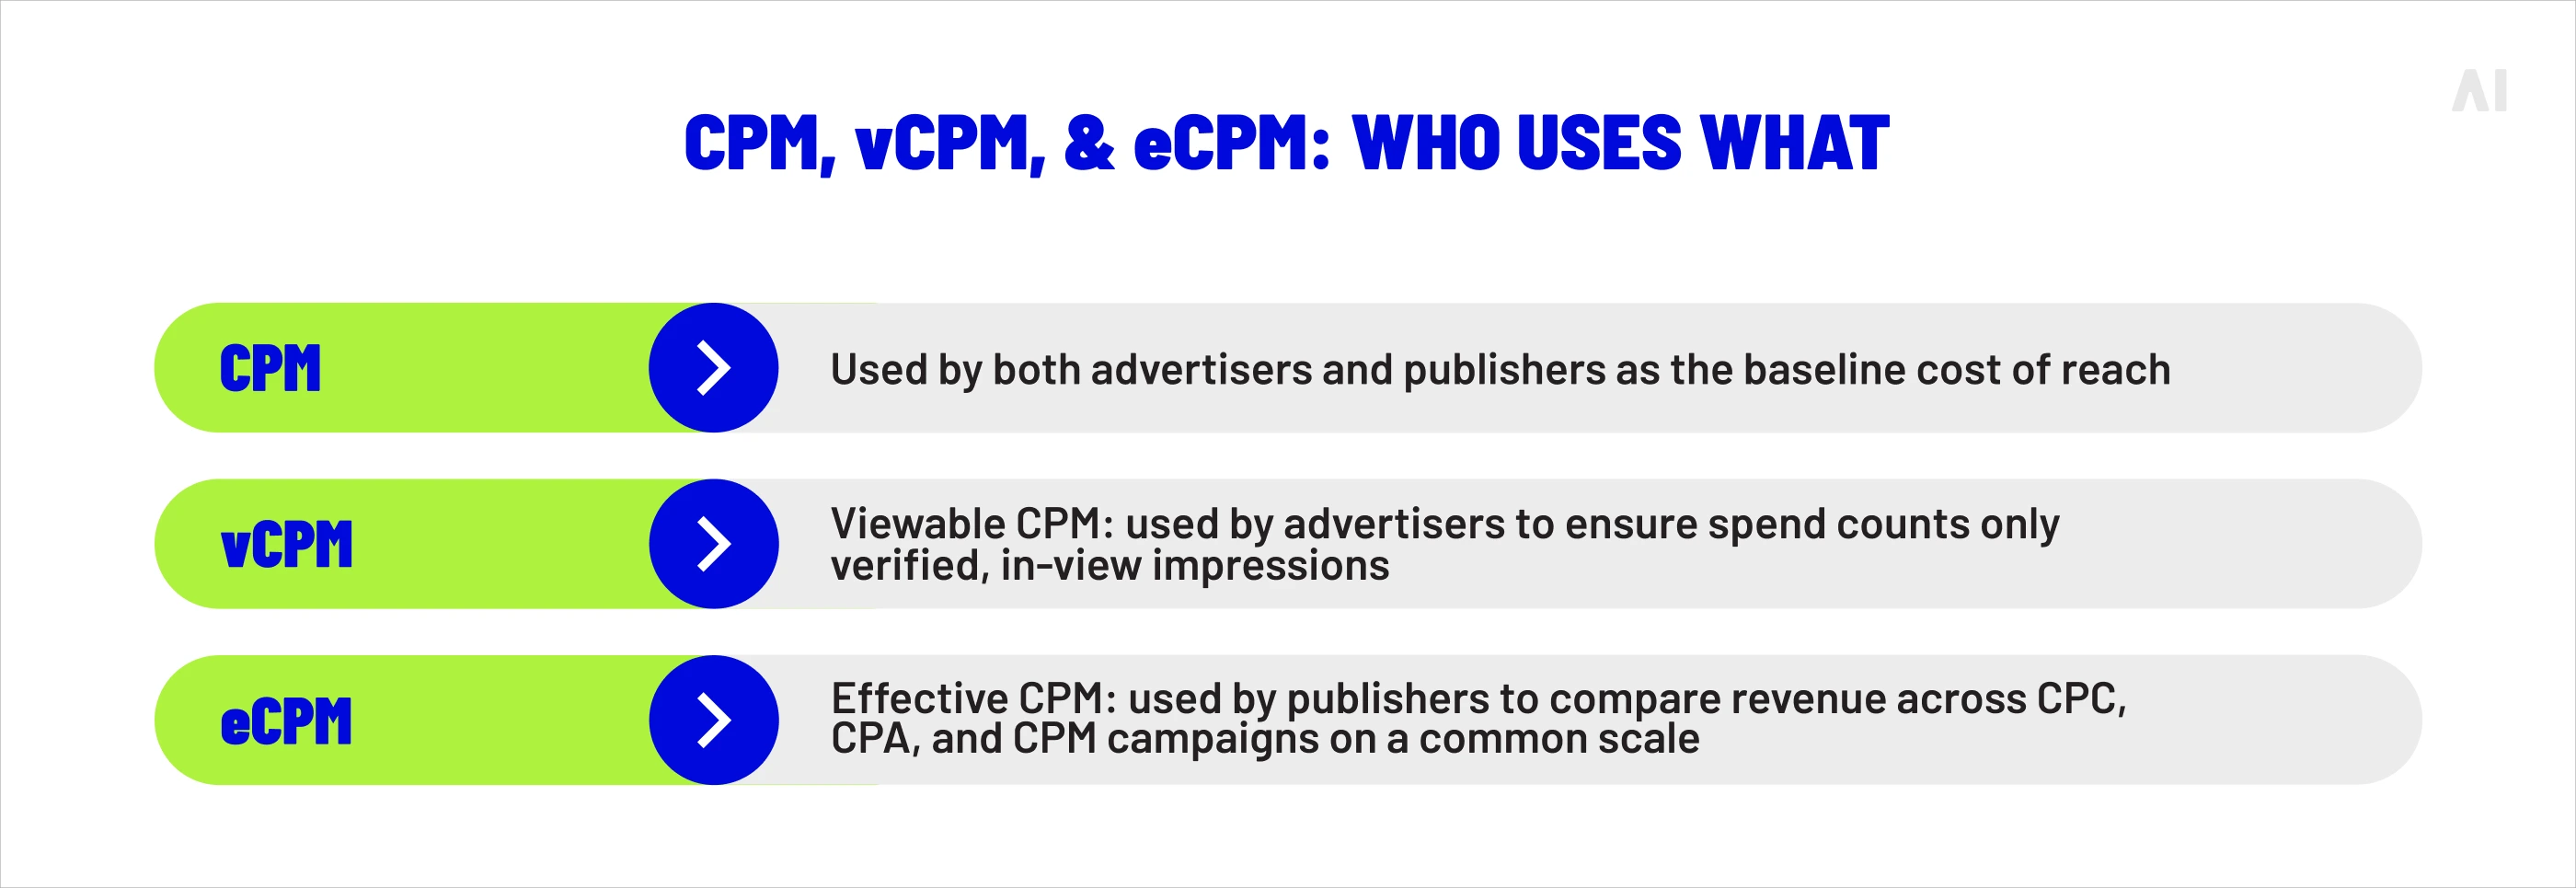
Three variations of CPM appear in reporting, and each serves a different purpose.
CPM is the standard cost per thousand impressions, regardless of whether those impressions were actually viewable by a human.
Viewable CPM (vCPM) counts only impressions that meet viewability standards—typically defined by the Media Rating Council as at least 50% of the ad being in view for at least one second (two seconds for video). For advertisers, vCPM is a more honest measure of actual exposure. Google Ads and most DSPs now offer vCPM bidding as an option.
Effective CPM (eCPM) is a publisher-side metric that normalises revenue across different pricing models. If a publisher earns $500 from a CPC campaign that delivered 200,000 impressions, their eCPM is $2.50. It helps publishers compare the value of CPM, CPC, and CPA campaigns on a common scale.
For advertisers, vCPM is the most relevant variant because it ties spend to verified human attention. For publishers evaluating inventory performance, eCPM matters most.
CPM-based buying aligns most naturally with campaigns where the primary objective is visibility at scale rather than immediate user action:
Brand awareness. CPM is the natural model for campaigns designed to put a brand, product, or message in front of as many relevant people as possible. When the goal is mental availability rather than immediate response, paying per impression is more efficient than paying per click.
Video distribution. Pre-roll, mid-roll, and bumper ad formats on YouTube and CTV are predominantly bought on a CPM basis. With US digital video ad spend projected to reach $72 billion in 2025, CPM is the dominant model powering that growth.
Programmatic display. For prospecting campaigns across the open web, CPM bidding gives advertisers control over how their budget is distributed across audiences and placements, with DSP algorithms optimizing for the lowest cost per thousand within the target parameters.
⚡ CPM measures how far your budget reaches. It says nothing about what that reach produces. Pair it with viewability and brand lift metrics to evaluate real impact.
Cost per acquisition (sometimes cost per action) measures how much it costs to generate a specific conversion—a purchase, a sign-up, a lead form submission, or any other defined action that represents a real business outcome. Where CPM measures exposure and CPC measures engagement, CPA measures results.
CPA formula
The CPA formula is as follows:
CPA = Total Ad Spend ÷ Total Conversions
If a campaign spends $15,000 and generates 300 conversions, the CPA is $50. The interpretation depends entirely on what the conversion is worth. A $50 CPA is excellent if the average customer lifetime value is $500; it is unsustainable if the product margin is $30.
Recent benchmark datasets point in the same direction—acquisition is getting more expensive:
AgencyAnalytics’ 2025 Google Ads benchmark report, based on 150,000 campaigns run by 7,000 agencies, found a median cost per conversion of $34.61 overall
LocaliQ’s 2025 search benchmark, based on 16,000+ campaigns from April 2024 through March 2025, reported an average search cost per lead of $70.11 across industries.
For ecommerce-focused advertisers, Triple Whale’s 2025 Google Ads benchmark report, based on 18,000 brands, found that median CPA rose 12.35% year over year to $23.74, with 13 of 14 industries seeing acquisition costs increase.
The CPC vs CPA distinction comes down to where you accept risk.
With CPC, you pay for every click regardless of outcome. You control the cost of traffic but absorb the risk that those clicks may not convert. With CPA-based buying (or target CPA bidding), you set a desired cost per conversion and the platform's algorithm adjusts delivery to hit that target. The risk shifts toward the platform, which must find the right users at the right moments to meet your CPA goal.
CPA is the stronger model when conversion tracking is robust and volume is sufficient for algorithmic learning. CPC works better in early-stage campaigns where conversion data is sparse and you need to build a dataset before the algorithm can optimize effectively. In practice, many campaigns start on CPC and migrate to target CPA once enough conversion signals have accumulated.
{{26-CTR-CPC-CPM-CPA-CPV-1="/tables"}}
Use cases for CPA advertising
CPA optimization belongs at the bottom of the funnel, where campaigns are measured by tangible outcomes.
E-commerce conversions. Online retailers measuring success by purchase volume and revenue per order naturally gravitate toward CPA. It directly ties media cost to sales, making ROI calculations straightforward.
Lead generation. B2B campaigns, financial services, insurance, and education providers often define a lead (form fill, phone call, demo request) as their primary conversion. CPA tells them exactly what each lead costs.
Subscription and app install campaigns. SaaS companies and mobile-first businesses optimize for sign-ups or installs as their target action, with CPA as the primary efficiency metric.
Cost per view measures how much an advertiser pays each time a user watches a video ad. "Watch" is defined differently across platforms—on YouTube, a view counts when a user watches at least 30 seconds of a skippable ad (or the full ad if it is shorter) or interacts with it. This makes CPV a measure of earned attention rather than passive exposure, positioning it between CPM (which counts all impressions) and CPC (which requires a click).
CPV formula
The CPV formula is as follows:
CPV = Total Ad Spend ÷ Total Video Views
If a video campaign spends $3,000 and generates 60,000 qualified views, the CPV is $0.05.
CPV on YouTube varies widely by format, targeting, and campaign goal. Google defines a billable TrueView view for skippable in-stream ads as a viewer watching 30 seconds or to the end of the ad, or interacting with the ad, which means CPV benchmarks are highly format-dependent. Open vendor benchmarks from LocaliQ place YouTube advertising costs at roughly $0.10–$0.30 per view or impression, but those figures should be treated as directional rather than official platform averages.
CPV vs CPM for video
When buying video inventory, the choice between CPV and CPM depends on the campaign objective.
CPV is ideal when the goal is engaged viewing. You pay only when someone watches a meaningful portion of your video, which means budget is not consumed by skips or partial views. This makes CPV the stronger choice for storytelling campaigns, product demonstrations, and mid-funnel content designed to deepen brand understanding.
CPM is more appropriate for video when the goal is maximum reach and frequency. Non-skippable ads and bumper formats (six seconds or fewer) are typically bought on CPM because every impression delivers the full message. For brand awareness pushes where completion is guaranteed by format, CPM gives more predictable reach at scale.
As a general principle: use CPV when attention quality matters more than impression volume, and CPM when distribution breadth matters more than depth of engagement.
CPV performs strongest in campaigns where the value lies in sustained viewer attention rather than a click or conversion:
Video awareness campaigns. Launching a new product, entering a new market, or building brand recognition through video storytelling benefits from CPV because it ensures budget flows toward viewers who actually engage with the content.
Mid-funnel audience engagement. After initial awareness, sequential video campaigns can use CPV to deepen interest among viewers who watched the first ad. YouTube's video sequencing tools, for example, allow advertisers to serve progressively detailed content to engaged viewers while excluding those who skipped early.
Performance measurement for creative quality. CPV functions as a creative diagnostic. A rising CPV suggests the audience is less willing to watch; a falling one indicates stronger hooks and more compelling content.
⚡ In video advertising, the real question is not "how many saw it?" but "how many chose to watch?" CPV answers the latter.
Comparing ad metrics and pricing models
The table below provides a direct comparison across all five metrics and models discussed in this guide.
{{26-CTR-CPC-CPM-CPA-CPV-2="/tables"}}
How to choose the right ad metric
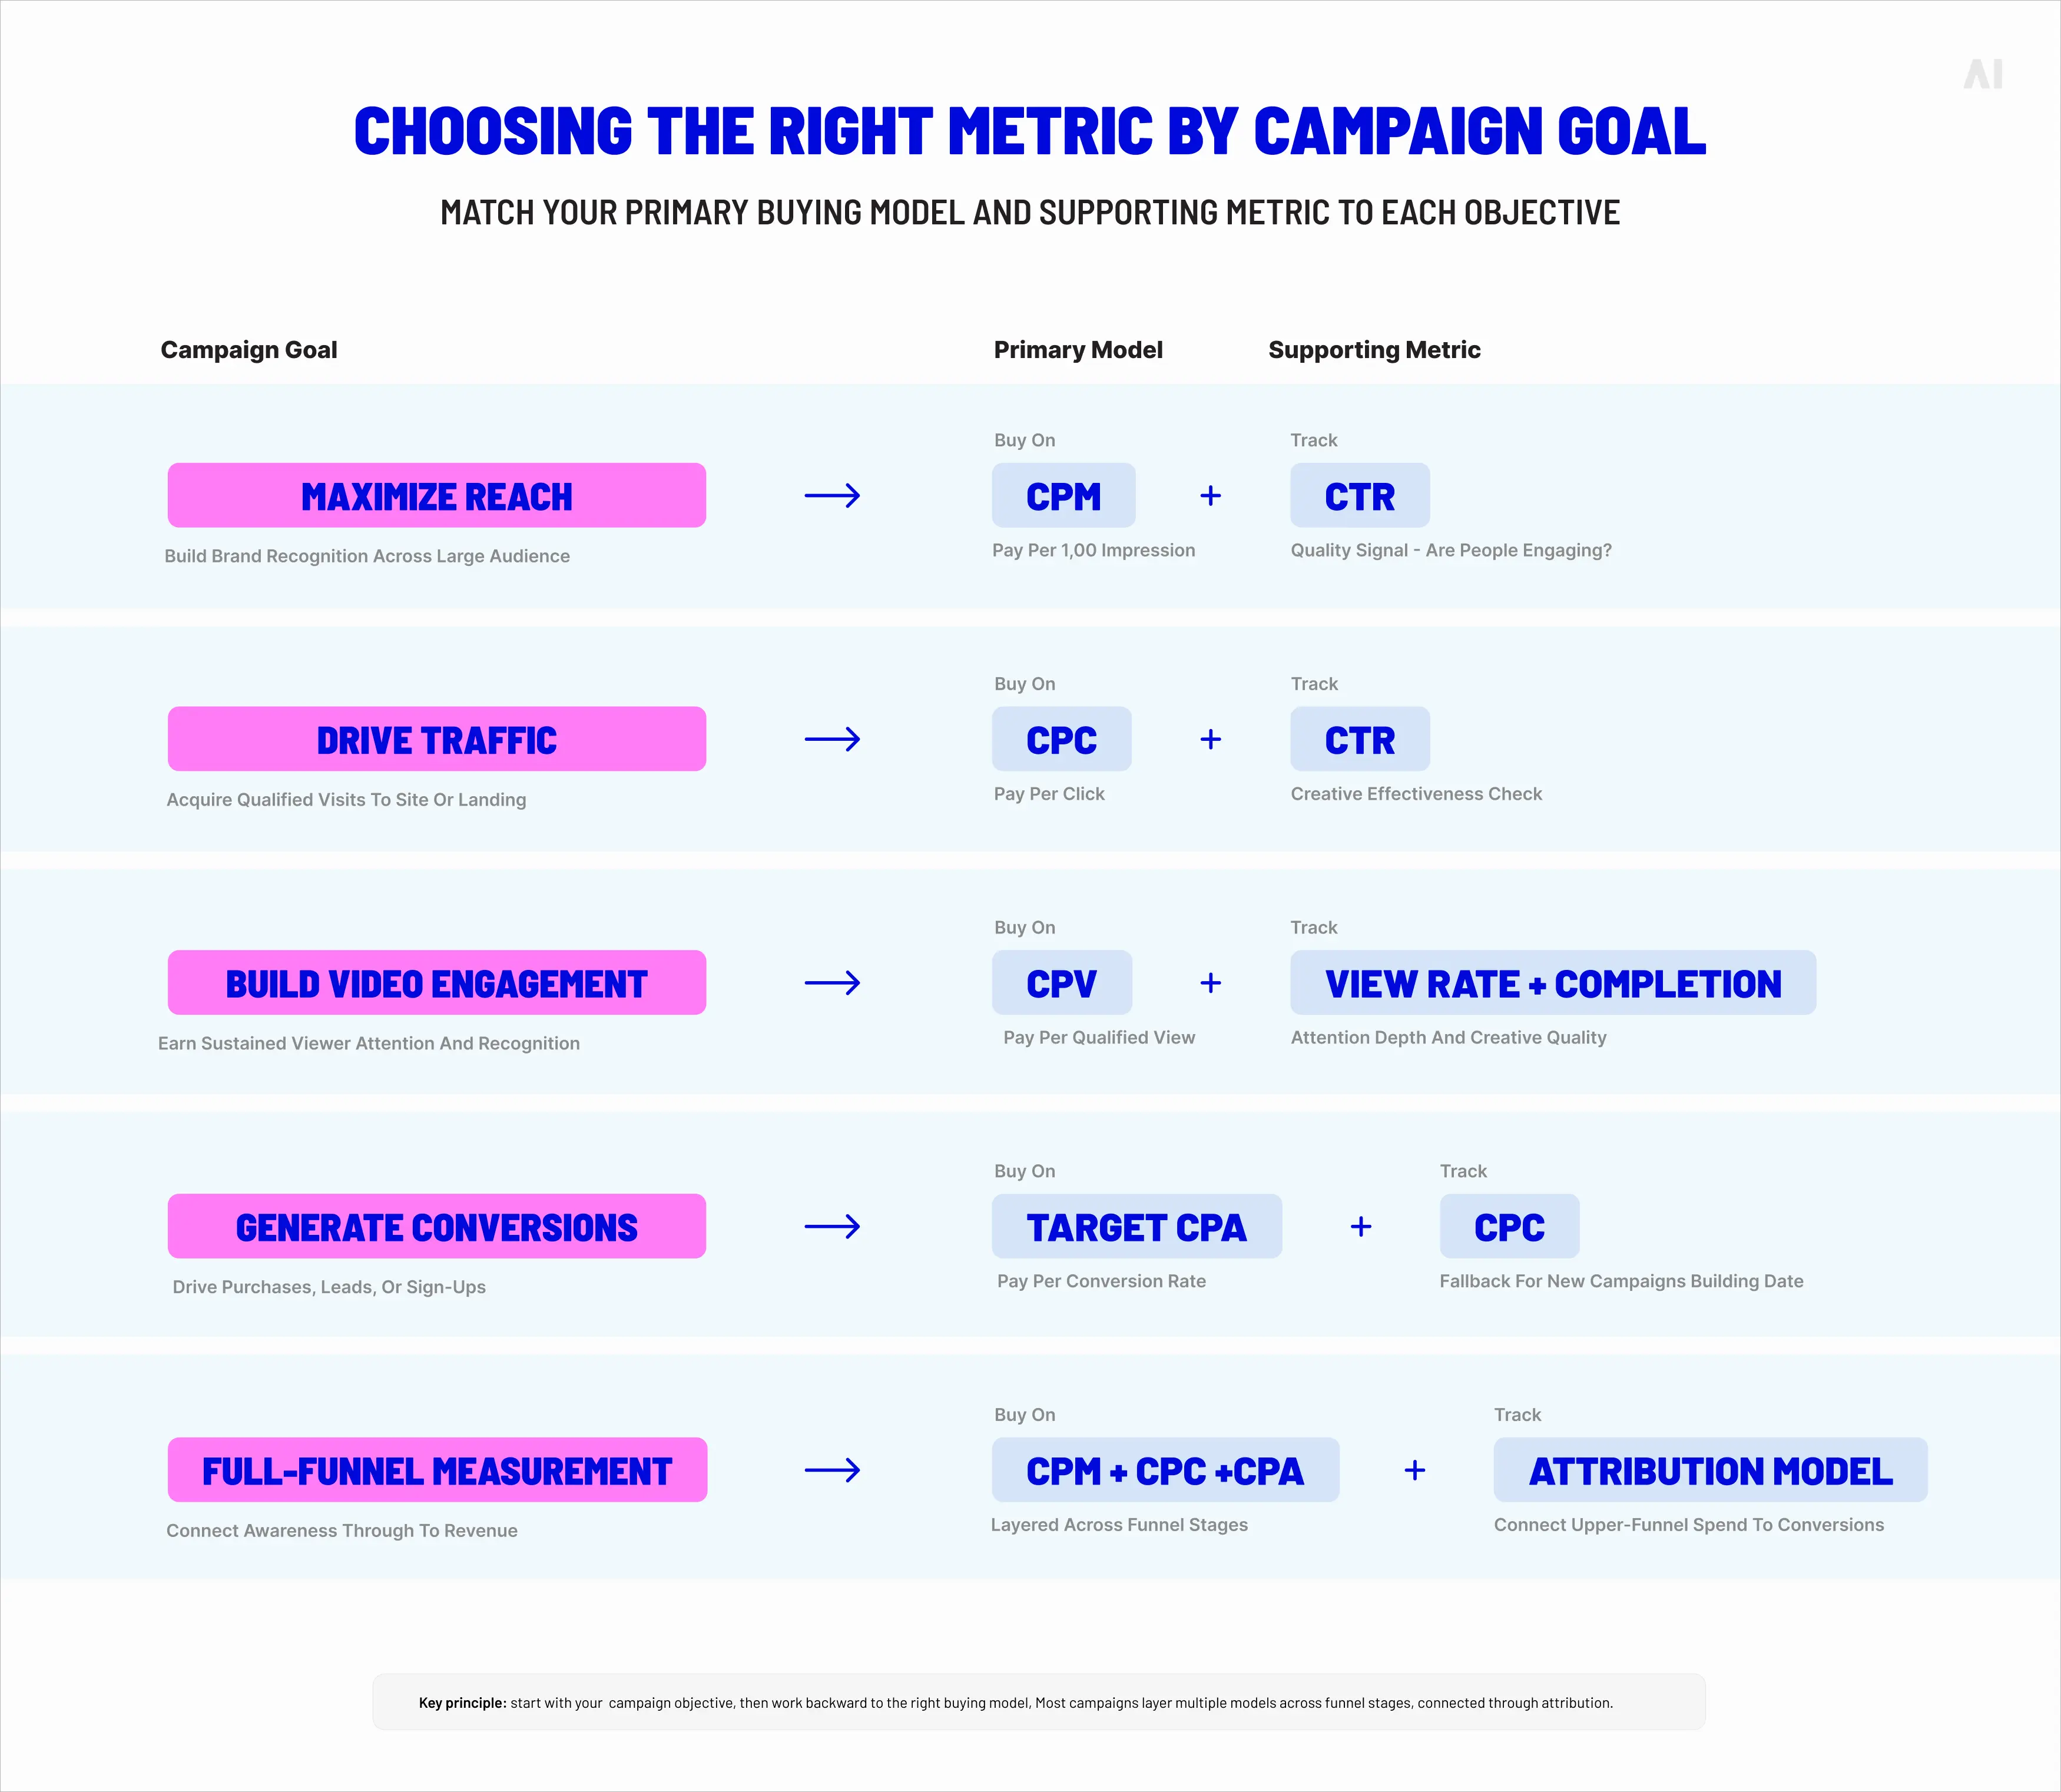
Selecting the right metric is not an exercise in picking a favourite—it is about matching measurement to objective at each stage of the funnel.
Awareness stage. When the goal is reaching new audiences and building recognition, CPM is the primary buying model and CTR serves as a quality check. A healthy CPM campaign delivers broad reach at a controlled cost, while CTR indicates whether the creative is generating interest within that audience. For video-first awareness strategies, CPV offers a more precise gauge of attention.
Consideration and traffic stage. When the goal shifts to driving qualified visits, CPC becomes the primary model. CTR remains important as a performance signal (is the ad compelling?), while CPC tells you what that engagement costs. Monitoring both together prevents you from celebrating high CTR that comes at an unsustainable CPC.
Conversion stage. When the goal is measurable actions—purchases, sign-ups, leads—CPA takes centre stage. CPC may still be the bidding mechanism (especially in campaigns with limited conversion data), but CPA is the metric that determines whether the campaign is profitable.
Cross-funnel strategy. The most sophisticated marketers do not operate in one stage at a time. They run CPM-based awareness campaigns that feed CPC-based consideration campaigns that ultimately drive CPA-optimized conversions—measuring different things at each level while connecting them through attribution modelling. This is where the metrics stop being alternatives and start being layers.
⚡ There is no single "best" ad metric. The best metric is the one that answers the question your campaign is actually asking.
How AI-driven platforms connect ad metrics to real business outcomes
The challenge with managing CTR, CPC, CPM, CPA, and CPV across multiple campaigns, channels, and funnel stages is operational complexity. Each platform—Google Ads, Meta, a DSP, a CTV provider—reports its own metrics in its own format, making it difficult to build a unified picture of how media spend connects to business outcomes.
This is where AI-driven advertising platforms change the equation. Rather than forcing marketers to manually reconcile data across siloed environments, these platforms aggregate performance signals from multiple sources and apply machine learning to optimize across the full funnel in real time.
The practical impact is significant. Instead of a media planner manually adjusting bids across 15 DSPs based on yesterday's CPA data, an AI-powered system can process performance signals every 15 minutes, shifting budget between high-performing audience segments, placements, and creatives automatically. Instead of evaluating CPM and CPA as separate metrics in separate dashboards, a unified platform can model how awareness spend (measured in CPM) ultimately influences conversion cost (measured in CPA), connecting the top and bottom of the funnel with data rather than assumptions.
AI Digital's approach to this challenge centres on three principles.
First, DSP-agnostic execution across more than 15 demand-side platforms ensures that no single platform's algorithm dictates where budget flows—decisions are driven by performance data, not platform bias.
Second, custom KPI alignment means campaigns optimize toward business-specific goals (revenue, ROAS, customer acquisition cost) rather than defaulting to standard platform metrics like impressions or click volume.
Third, the combination of AI automation with human strategic oversight ensures that algorithmic efficiency is guided by business context that machines alone cannot fully interpret.
The result is a measurement framework where CPM, CPC, CTR, CPV, and CPA are not competing metrics but connected data points within a single performance model—each informing the others, each contributing to a clear picture of how advertising investment translates into growth.
Conclusion: Turn ad metrics into performance marketing results
CTR, CPC, CPM, CPA, and CPV are not five competing ways to measure the same thing. They are five complementary lenses, each designed to evaluate a different dimension of campaign performance. CTR reveals creative effectiveness. CPC quantifies traffic cost. CPM measures the efficiency of reach. CPA connects spend to business outcomes. CPV captures video attention.
Used individually, each metric provides a partial view. Used together within a structured measurement framework, they give marketers full visibility across the funnel—from first impression to final conversion. The brands and agencies that consistently outperform are not the ones chasing a single metric but the ones building systems that connect all five to real business growth.
If you are looking for support in building that kind of integrated measurement approach—one that connects media metrics across channels and platforms to the outcomes that matter—get in touch with AI Digital. We help advertisers move beyond siloed reporting toward unified, performance-driven media strategies.
• Platforms own AI models and train on proprietary data • Brands have little visibility into decision-making • "Walled gardens" restrict data access
• Inefficient ad spend • Limited strategic control • Eroded consumer trust • Potential budget mismanagement
Open Garden framework providing: • Complete transparency • DSP-agnostic execution • Cross-platform data & insights
Optimizing ads vs. optimizing impact
• AI excels at short-term metrics but may struggle with brand building • Consumers can detect AI-generated content • Efficiency might come at cost of authenticity
• Short-term gains at expense of brand health • Potential loss of authentic connection • Reduced effectiveness in storytelling
Smart Supply offering: • Human oversight of AI recommendations • Custom KPI alignment beyond clicks • Brand-safe inventory verification
The illusion of personalization
• Segment optimization rebranded as personalization • First-party data infrastructure challenges • Personalization vs. surveillance concerns
• Potential mismatch between promise and reality • Privacy concerns affecting consumer trust • Cost barriers for smaller businesses
Elevate platform features: • Real-time AI + human intelligence • First-party data activation • Ethical personalization strategies
AI-Driven efficiency vs. decision-making
• AI shifting from tool to decision-maker • Black box optimization like Google Performance Max • Human oversight limitations
• Strategic control loss • Difficulty questioning AI outputs • Inability to measure granular impact • Potential brand damage from mistakes
Managed Service with: • Human strategists overseeing AI • Custom KPI optimization • Complete campaign transparency
Fig. 1. Summary of AI blind spots in advertising
Dimension
Walled garden advantage
Walled garden limitation
Strategic impact
Audience access
Massive, engaged user bases
Limited visibility beyond platform
Reach without understanding
Data control
Sophisticated targeting tools
Data remains siloed within platform
Fragmented customer view
Measurement
Detailed in-platform metrics
Inconsistent cross-platform standards
Difficult performance comparison
Intelligence
Platform-specific insights
Limited data portability
Restricted strategic learning
Optimization
Powerful automated tools
Black-box algorithms
Reduced marketer control
Fig. 2. Strategic trade-offs in walled garden advertising.
Core issue
Platform priority
Walled garden limitation
Real-world example
Attribution opacity
Claiming maximum credit for conversions
Limited visibility into true conversion paths
Meta and TikTok's conflicting attribution models after iOS privacy updates
Data restrictions
Maintaining proprietary data control
Inability to combine platform data with other sources
Amazon DSP's limitations on detailed performance data exports
Cross-channel blindspots
Keeping advertisers within ecosystem
Fragmented view of customer journey
YouTube/DV360 campaigns lacking integration with non-Google platforms
Black box algorithms
Optimizing for platform revenue
Reduced control over campaign execution
Self-serve platforms using opaque ML models with little advertiser input
Performance reporting
Presenting platform in best light
Discrepancies between platform-reported and independently measured results
Consistently higher performance metrics in platform reports vs. third-party measurement
Fig. 1. The Walled garden misalignment: Platform interests vs. advertiser needs.
Key dimension
Challenge
Strategic imperative
ROAS volatility
Softer returns across digital channels
Shift from soft KPIs to measurable revenue impact
Media planning
Static plans no longer effective
Develop agile, modular approaches adaptable to changing conditions
Brand/performance
Traditional division dissolving
Create full-funnel strategies balancing long-term equity with short-term conversion
Capability
Key features
Benefits
Performance data
Elevate forecasting tool
• Vertical-specific insights • Historical data from past economic turbulence • "Cascade planning" functionality • Real-time adaptation
• Provides agility to adjust campaign strategy based on performance • Shows which media channels work best to drive efficient and effective performance • Confident budget reallocation • Reduces reaction time to market shifts
• Dataset from 10,000+ campaigns • Cuts response time from weeks to minutes
• Reaches people most likely to buy • Avoids wasted impressions and budgets on poor-performing placements • Context-aligned messaging
• 25+ billion bid requests analyzed daily • 18% improvement in working media efficiency • 26% increase in engagement during recessions
Full-funnel accountability
• Links awareness campaigns to lower funnel outcomes • Tests if ads actually drive new business • Measures brand perception changes • "Ask Elevate" AI Chat Assistant
• Upper-funnel to outcome connection • Sentiment shift tracking • Personalized messaging • Helps balance immediate sales vs. long-term brand building
• Natural language data queries • True business impact measurement
Open Garden approach
• Cross-platform and channel planning • Not locked into specific platforms • Unified cross-platform reach • Shows exactly where money is spent
• Reduces complexity across channels • Performance-based ad placement • Rapid budget reallocation • Eliminates platform-specific commitments and provides platform-based optimization and agility
• Coverage across all inventory sources • Provides full visibility into spending • Avoids the inability to pivot across platform as you’re not in a singular platform
Fig. 1. How AI Digital helps during economic uncertainty.
Trend
What it means for marketers
Supply & demand lines are blurring
Platforms from Google (P-Max) to Microsoft are merging optimization and inventory in one opaque box. Expect more bundled “best available” media where the algorithm, not the trader, decides channel and publisher mix.
Walled gardens get taller
Microsoft’s O&O set now spans Bing, Xbox, Outlook, Edge and LinkedIn, which just launched revenue-sharing video programs to lure creators and ad dollars. (Business Insider)
Retail & commerce media shape strategy
Microsoft’s Curate lets retailers and data owners package first-party segments, an echo of Amazon’s and Walmart’s approaches. Agencies must master seller-defined audiences as well as buyer-side tactics.
AI oversight becomes critical
Closed AI bidding means fewer levers for traders. Independent verification, incrementality testing and commercial guardrails rise in importance.
Fig. 1. Platform trends and their implications.
Metric
Connected TV (CTV)
Linear TV
Video Completion Rate
94.5%
70%
Purchase Rate After Ad
23%
12%
Ad Attention Rate
57% (prefer CTV ads)
54.5%
Viewer Reach (U.S.)
85% of households
228 million viewers
Retail Media Trends 2025
Access Complete consumer behaviour analyses and competitor benchmarks.
Identify and categorize audience groups based on behaviors, preferences, and characteristics
Michaels Stores: Implemented a genAI platform that increased email personalization from 20% to 95%, leading to a 41% boost in SMS click through rates and a 25% increase in engagement.
Estée Lauder: Partnered with Google Cloud to leverage genAI technologies for real-time consumer feedback monitoring and analyzing consumer sentiment across various channels.
High
Medium
Automated ad campaigns
Automate ad creation, placement, and optimization across various platforms
Showmax: Partnered with AI firms toautomate ad creation and testing, reducing production time by 70% while streamlining their quality assurance process.
Headway: Employed AI tools for ad creation and optimization, boosting performance by 40% and reaching 3.3 billion impressions while incorporating AI-generated content in 20% of their paid campaigns.
High
High
Brand sentiment tracking
Monitor and analyze public opinion about a brand across multiple channels in real time
L’Oréal: Analyzed millions of online comments, images, and videos to identify potential product innovation opportunities, effectively tracking brand sentiment and consumer trends.
Kellogg Company: Used AI to scan trending recipes featuring cereal, leveraging this data to launch targeted social campaigns that capitalize on positive brand sentiment and culinary trends.
High
Low
Campaign strategy optimization
Analyze data to predict optimal campaign approaches, channels, and timing
DoorDash: Leveraged Google’s AI-powered Demand Gen tool, which boosted its conversion rate by 15 times and improved cost per action efficiency by 50% compared with previous campaigns.
Kitsch: Employed Meta’s Advantage+ shopping campaigns with AI-powered tools to optimize campaigns, identifying and delivering top-performing ads to high-value consumers.
High
High
Content strategy
Generate content ideas, predict performance, and optimize distribution strategies
JPMorgan Chase: Collaborated with Persado to develop LLMs for marketing copy, achieving up to 450% higher clickthrough rates compared with human-written ads in pilot tests.
Hotel Chocolat: Employed genAI for concept development and production of its Velvetiser TV ad, which earned the highest-ever System1 score for adomestic appliance commercial.
High
High
Personalization strategy development
Create tailored messaging and experiences for consumers at scale
Stitch Fix: Uses genAI to help stylists interpret customer feedback and provide product recommendations, effectively personalizing shopping experiences.
Instacart: Uses genAI to offer customers personalized recipes, mealplanning ideas, and shopping lists based on individual preferences and habits.
Medium
Medium
Share article
Url copied to clipboard
No items found.
Subscribe to our Newsletter
THANK YOU FOR YOUR SUBSCRIPTION
Oops! Something went wrong while submitting the form.
Questions? We have answers
Which ad metric is best for measuring campaign performance and ROI?
CPA is the most direct measure of ROI because it ties ad spend to specific conversion actions—purchases, leads, or sign-ups. However, CPA alone does not account for the awareness and consideration work that feeds those conversions. A complete ROI picture combines CPA for bottom-funnel evaluation with CPM and CTR for upper-funnel effectiveness.
When should advertisers optimize for CPA instead of CPC or CPM?
Optimise for CPA when conversion tracking is reliable, conversion volume is sufficient for algorithmic learning (most platforms recommend at least 30–50 conversions per month), and the business has a clear target cost per acquisition. CPC is better for campaigns still building conversion data, and CPM is better for objectives focused on awareness rather than direct response.
Is CTR still an important KPI in modern programmatic advertising?
Yes, but with caveats. CTR remains valuable as a creative quality signal and a tool for A/B testing, but its importance has shifted. According to WordStream's 2025 data, the average search CTR rose slightly year over year while conversion rates improved across 65% of industries—suggesting that the industry is moving toward valuing click quality over click volume. CTR should inform creative decisions, not define campaign success.
How do CPV and CPM compare for video and CTV campaigns?
CPV is charged when a viewer watches a defined portion of a video (typically 30 seconds on YouTube), making it a measure of engaged attention. CPM is charged per thousand impressions regardless of view duration. For CTV, where ad completion rates exceed 95% and most formats are non-skippable, CPM is the standard pricing model since nearly every impression produces a complete view. For skippable video formats, CPV gives advertisers more control over paying for genuine attention.
What metrics should be used for awareness vs conversion-focused campaigns?
For awareness: CPM as the primary buying model, with CTR and viewability as quality indicators. For video awareness, add CPV to measure attention depth. For conversions: CPA as the primary success metric, with CPC as a controllable input and conversion rate as a diagnostic. The metrics themselves do not change—the emphasis and interpretation shift based on the objective.
When should marketers focus on CPC CPM comparisons?
A CPC CPM comparison is useful when a campaign sits between awareness and performance. If a brand is deciding whether to buy broad visibility or pay only for visits, comparing CPC and CPM can help clarify which model better suits the objective, audience, and funnel stage. The better choice depends on whether the campaign needs reach, traffic, or a balance of both.
How do you choose between CPM vs CPC vs CPA?
The choice between CPM vs CPC vs CPA depends on what success looks like. CPM is usually the right starting point for awareness. CPC is better when the goal is to drive site visits or landing-page traffic. CPA becomes the most relevant when the campaign is expected to deliver measurable business outcomes such as leads, sign-ups, or purchases. They are not interchangeable—they reflect different stages of performance.
Have other questions?
If you have more questions, contact us so we can help.

.svg)
.svg)