Digital Transit Advertising: How DOOH Extends Reach Beyond Online Media
Sarah Moss
February 3, 2026
10
minutes read
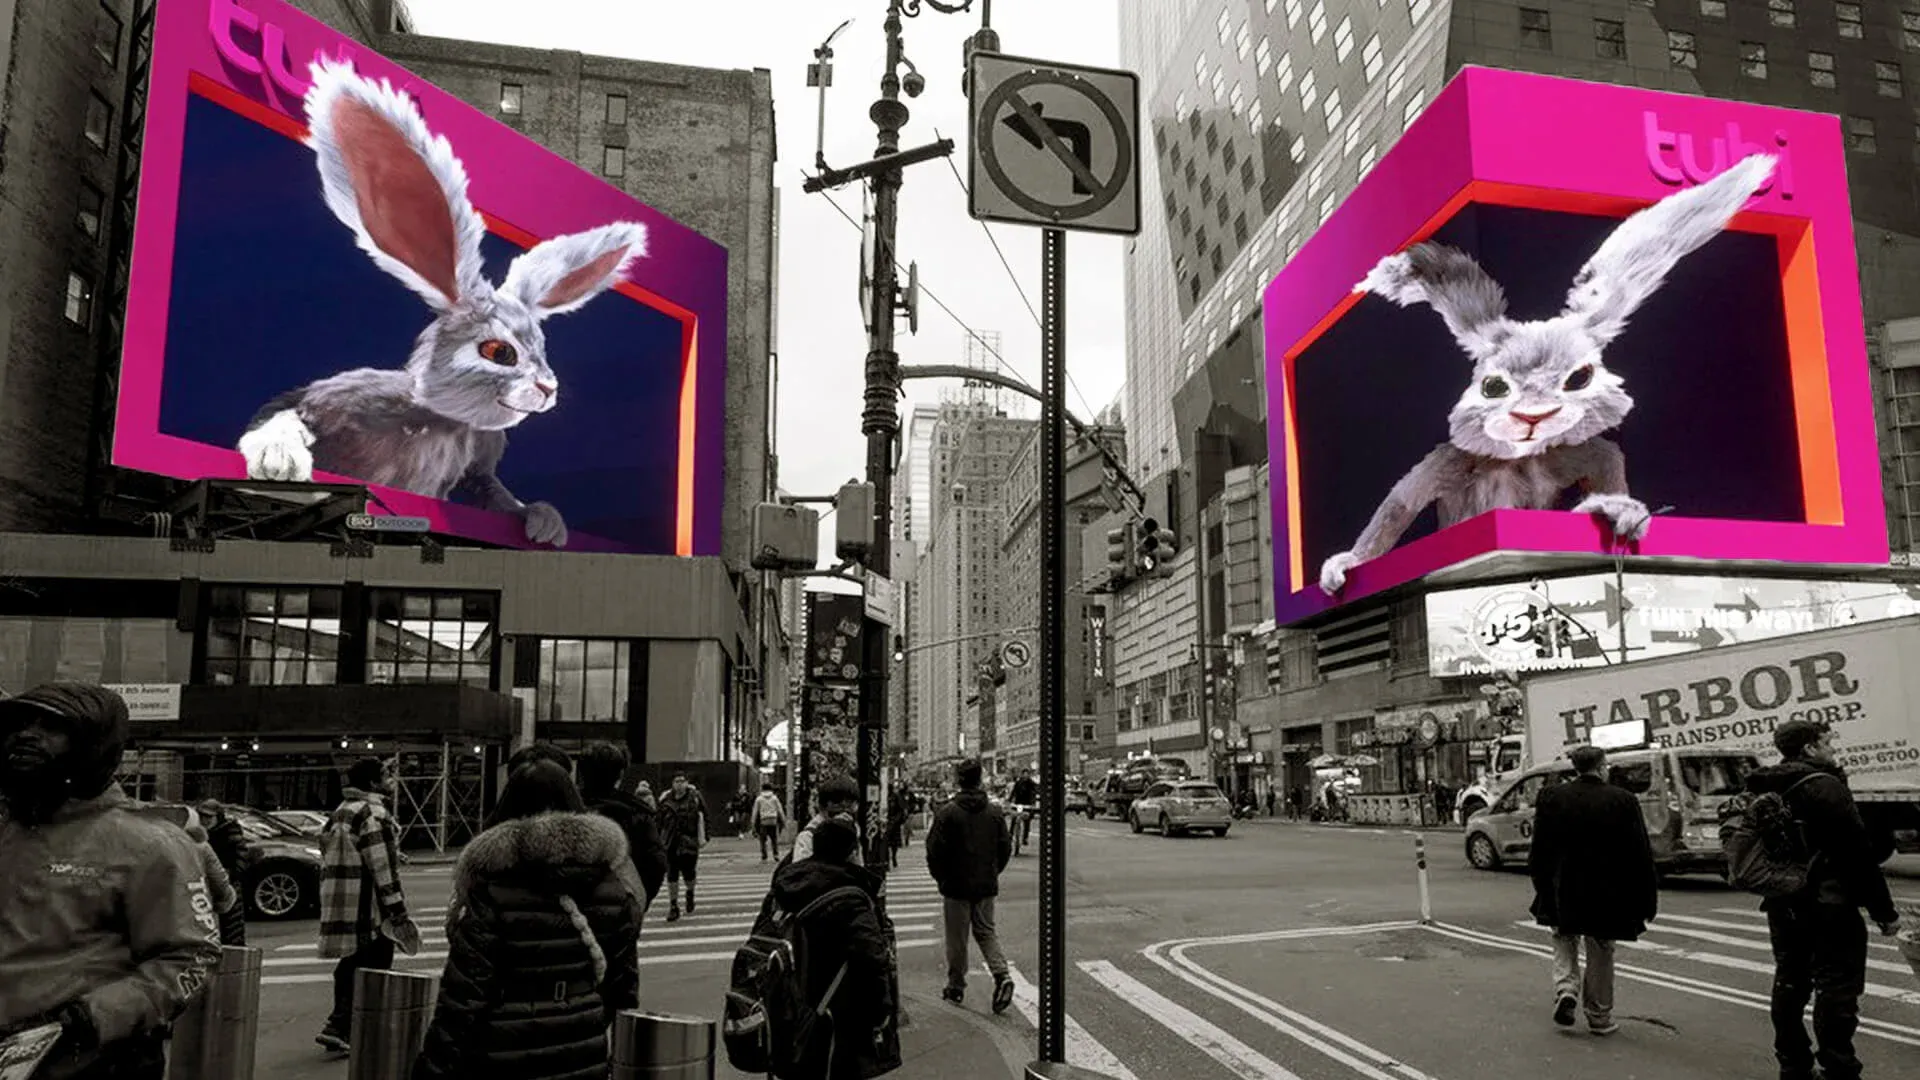
Digital transit advertising is the modern extension of digital media into the physical world, reaching audiences during billions of daily trips across cities. It uses programmatic delivery, location data, and AI-driven planning to activate campaigns in environments where commuters spend 25–60+ minutes per day in repeated routines. Instead of competing for fragmented attention online, transit delivers 3–10+ exposures per person per week through predictable movement. The result is scalable reach, measurable outcomes, and real-world attention that traditional digital channels struggle to achieve at the same cost.
Commuter attention is one of the last scaled, high-attention environments left in modern media. Every day, billions of trips take place across buses, metros, trains, and stations, with average commute times stretching from 25 to 60+ minutes in large cities. Unlike digital feeds where attention is fragmented and constantly interrupted—transit environments concentrate attention over time, creating repeated, unavoidable exposure during daily routines.
This makes transit advertising fundamentally different from most online media. People encounter the same routes, the same stations, and the same screens day after day, allowing frequency to build without relying on cookies, logins, or retargeting loops. The result is high recall driven by physical presence and repetition, not fleeting impressions.
Digital transit advertising bridges the gap between online precision and offline impact. Screens across public transportation are now powered by programmatic delivery, real-time location data, and AI-driven planning that adapts messaging by time of day, traffic patterns, and audience movement. What used to be static out-of-home placements has evolved into a measurable channel that supports targeting, optimization, and performance analysis at city scale.
💡This convergence is why DOOH transit is increasingly planned alongside digital video, retail media, and local campaigns. Brands gain the trust and visibility of physical media while extending reach beyond personal devices and into shared urban spaces.
⚡️ For a broader foundation on how this ecosystem works, see our overview of DOOH advertising. The guide explains how digital transit advertising works in practice, from key formats and planning logic to why high-traffic transit environments consistently deliver strong brand lift and ROI when strategy, data, and creative are aligned.
What is digital transit advertising?
Digital transit advertising is the use of data-enabled digital screens across transit environments to deliver measurable campaigns at city scale. Unlike traditional out-of-home, digital transit turns these moments into addressable, optimizable media inventory rather than fixed placements bought weeks in advance.
Scale is the defining advantage. In major metro areas, a single transit network can reach 60–90% of the working population within a typical week, often with 3–7 repeated exposures per commuter on the same routes. This natural frequency is critical: studies consistently show that brand recall increases sharply after the third exposure, and transit environments deliver that threshold without inflating impression costs.
Modern digital transit campaigns are planned and optimized using real data. Screens are activated based on time of day, traffic volume, audience density, and proximity to points of interest, allowing brands to shift messaging between morning rush hours, midday lulls, and evening commutes. Campaigns can be adjusted in near real time, with performance measured through impression delivery, dwell time, mobility lift, and downstream location visits—metrics that were impossible in static OOH just a few years ago.
Measurement is no longer hypothetical. Today’s transit DOOH campaigns can be linked to mobile location signals, exposing uplift in store visits that often ranges from 5% to 20%, depending on category and creative. CPMs typically sit 30–50% lower than premium digital video, while delivering significantly higher attention duration due to screen size, proximity, and lack of competing content.
⚡️Digital transit advertising extends digital reach into physical space, reinforces online campaigns with real-world presence, and supports location-based strategies across retail, QSR, entertainment, and mobility-driven categories.
Digital transit advertising is built on screen-based, data-enabled inventory, designed to deliver flexibility, targeting, and measurement at scale. Unlike classic OOH, these formats support dynamic creative, time-based delivery, and integration with programmatic buying and location data—making them adaptable to real-world movement rather than fixed placements.
{{26-Digital-Transit-Advertising-1="/tables"}}
Digital screens in stations and transit hubs
Stations and transit hubs are high-dwell, high-frequency environments. Commuters typically spend 5–15 minutes per visit waiting on platforms, navigating corridors, or passing through entrances, with exposure repeating multiple times per week. Digital screens in these locations include large-format displays, wall-mounted panels, and sequential screen networks that create visual dominance without competing content.
These screens are often connected into digital signage advertising networks, allowing media owners to activate campaigns across hundreds or thousands of screens simultaneously. Messaging can rotate by time of day, audience density, or nearby retail activity, improving relevance while keeping CPMs efficient. Large transit hubs alone can generate millions of monthly impressions, making them ideal for brand launches, retail awareness, and upper-funnel reinforcement.
In-vehicle digital displays
In-vehicle screens deliver some of the longest continuous exposure in DOOH. Displays inside buses, trams, trains, and ride-share vehicles capture attention during trips that average 15–45 minutes, often with limited visual distractions. This creates strong conditions for message recall, especially when creative is sequenced or updated by route and time.
Most in-vehicle inventory is now bought and managed through programmatic DOOH (pDOOH) platforms, enabling advertisers to scale campaigns across fleets while maintaining control over frequency, pacing, and budget allocation. Ads can be triggered by route location, trip duration, or proximity to destinations, turning vehicles into moving, data-driven media units.
⚡️For a more technical and execution-focused view, see AI Digital’s guide, What Is Programmatic DOOH (pDOOH) and How Does It Work?. It walks through how pDOOH platforms automate buying across transit inventory, how impressions are triggered by time, location, and audience signals, and how advertisers maintain control over budget allocation, frequency, and optimization at scale.
⚡️For a more technical and execution-focused view, see AI Digital’s guide, What Is Programmatic DOOH (pDOOH) and How Does It Work?. It walks through how pDOOH platforms automate buying across transit inventory, how impressions are triggered by time, location, and audience signals, and how advertisers maintain control over budget allocation, frequency, and optimization at scale.
Mobile-enabled and dynamic placements
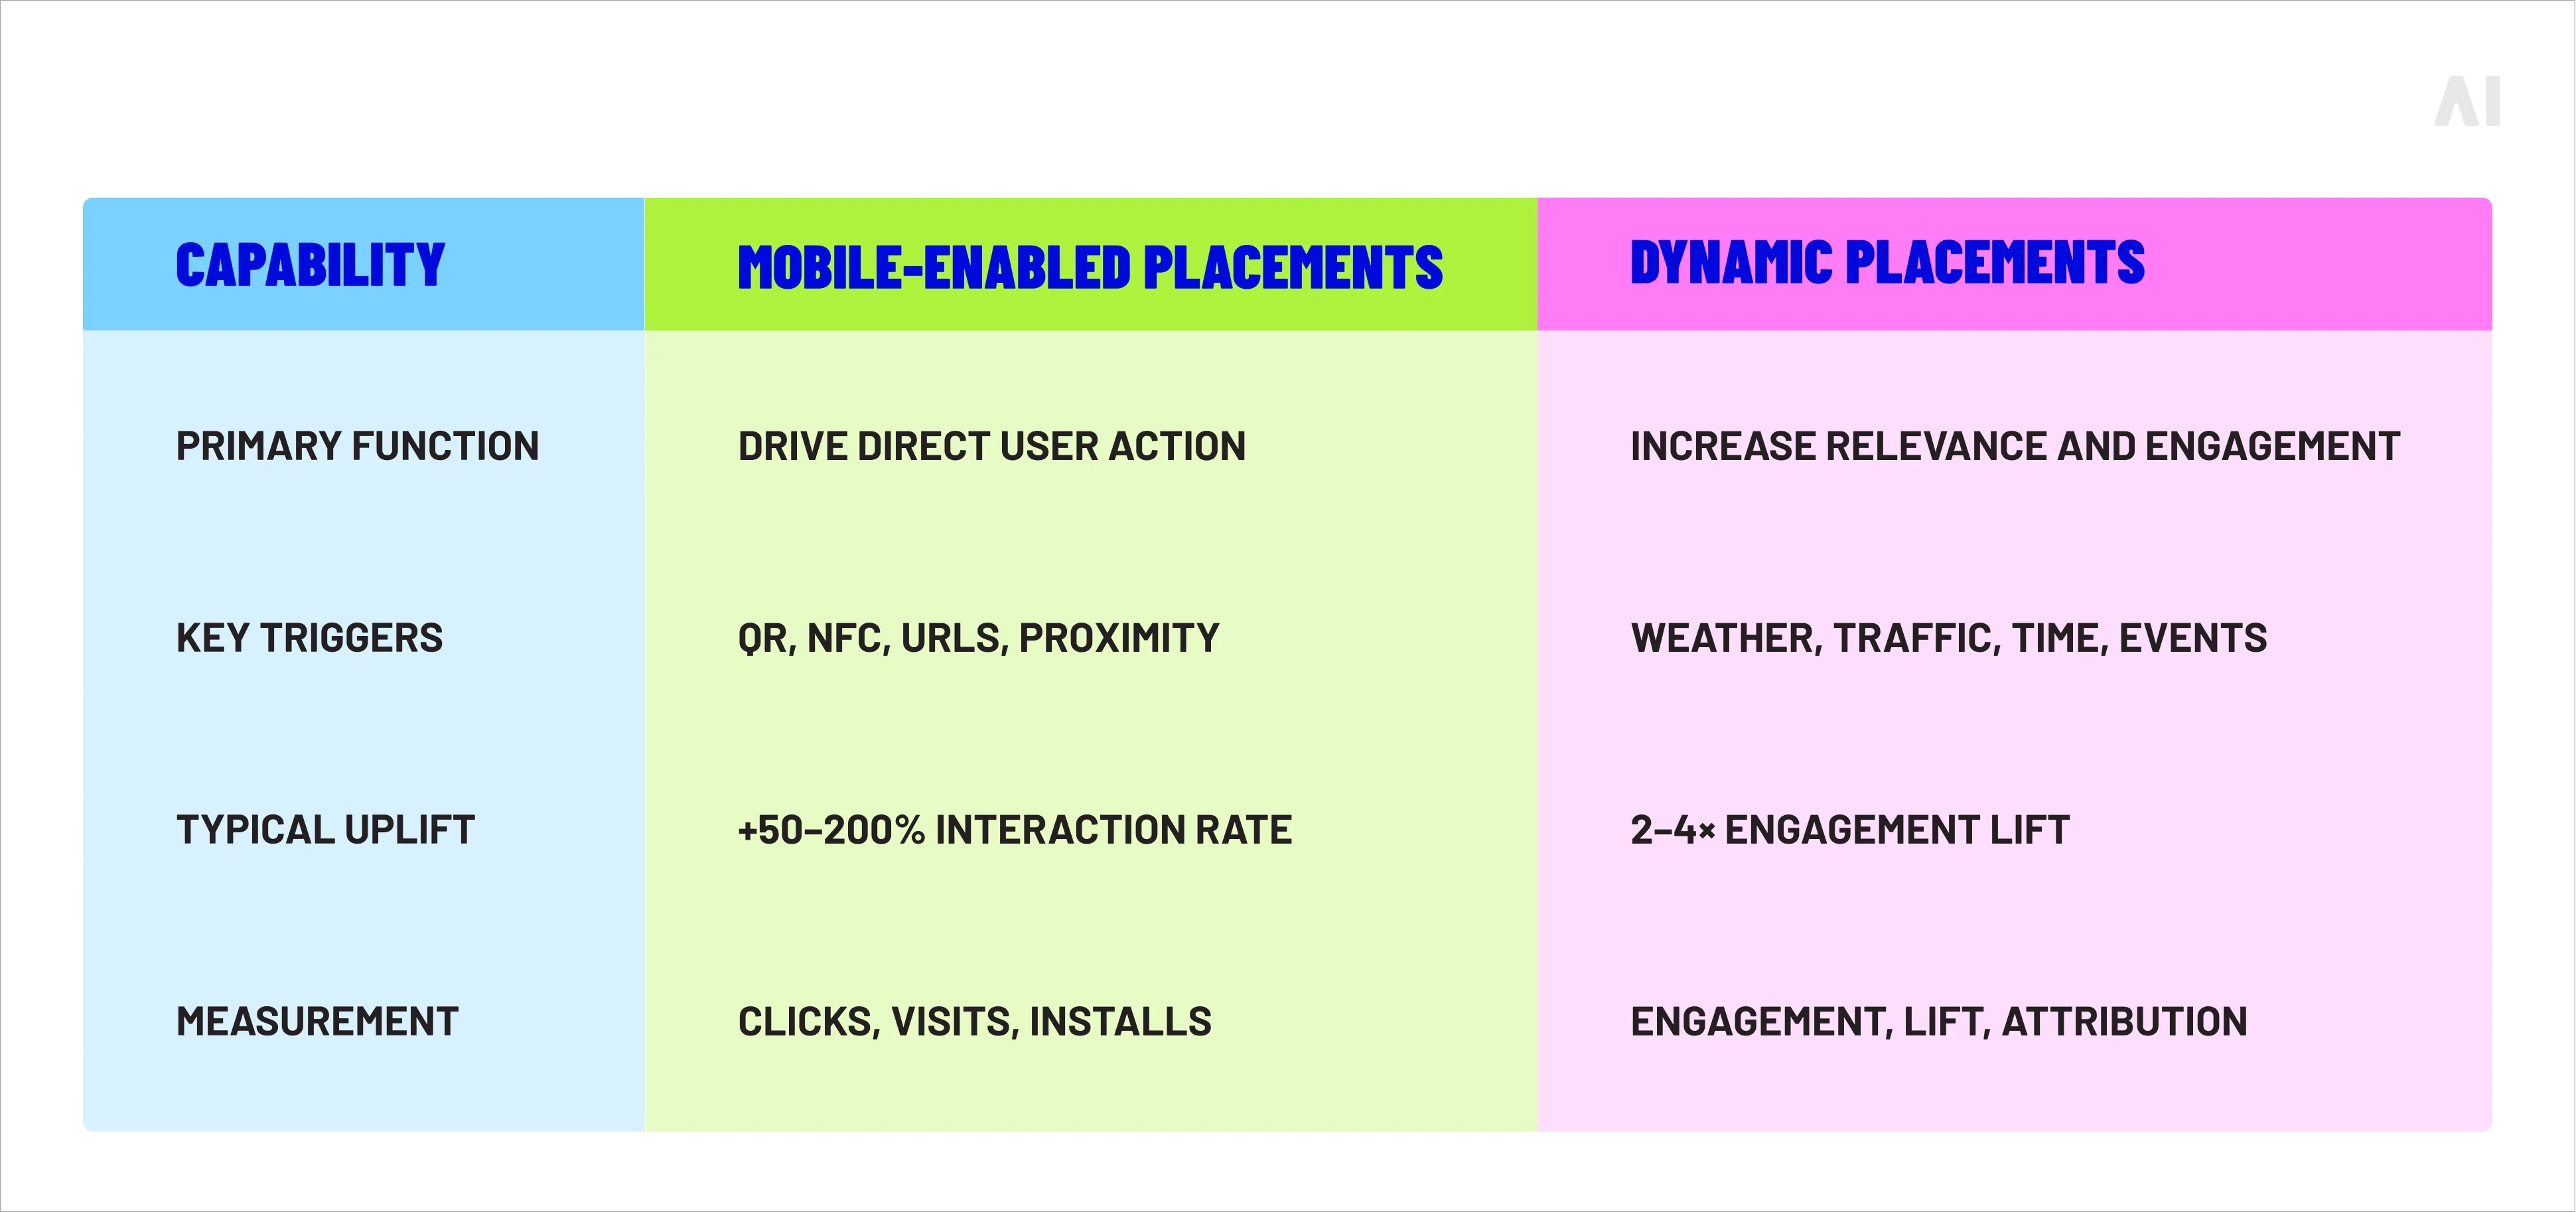
Mobile-enabled transit formats turn physical exposure into measurable action. By connecting digital screens to smartphones through QR codes, NFC, short links, or proximity-based triggers, these placements close the gap between seeing a message and acting on it. In transit environments, where dwell time ranges from 30 seconds to several minutes, scan and interaction rates are consistently higher than standard OOH benchmarks—often 1.5–3× higher than static formats, depending on creative and placement. Typical post-exposure actions include map searches, store visits, app installs, offer saves, and mobile site visits, all of which can be tracked through location-based attribution.
Dynamic placements add a real-time decision layer. Creative can change automatically based on weather conditions, traffic congestion, time of day, service disruptions, or nearby events, ensuring the message aligns with what commuters are experiencing in that exact moment. Campaigns using dynamic triggers regularly show 2–4× higher engagement rates than fixed messaging, while also reducing wasted impressions during low-relevance periods. For example, retail and QSR campaigns often see 5–15% lifts in store visitation when creative is activated within defined distance and time windows around transit routes.
💡The result is transit media that behaves like digital while keeping physical impact. Instead of broadcasting one message to everyone, mobile-enabled and dynamic transit formats operate as responsive systems, adapting to city movement and feeding real-world behavior back into campaign measurement. This makes them especially effective for performance-driven goals, where attribution, optimization, and real outcomes matter as much as reach.
Transit advertising vs DOOH: where digital transit fits
Digital transit advertising is a specialized subset of DOOH, built for movement, repetition, and location context. While DOOH broadly includes any digital screen in public spaces—such as malls, retail stores, airports, and roadside billboards—transit advertising focuses specifically on people in motion, following predictable routes multiple times per week.
{{26-Digital-Transit-Advertising-2="/tables"}}
The key difference is repetition driven by routine. A commuter may pass the same station, platform, or bus route 5–10 times per week, often at the same times of day. This creates automatic frequency without additional media spend, a dynamic that most other DOOH environments cannot replicate. In contrast, many DOOH placements prioritize one-time exposure in high-traffic areas, where audiences are transient and less predictable.
Digital transit is also uniquely optimized for location relevance. Screens are activated along routes that connect residential areas, business districts, universities, and retail zones, allowing campaigns to align messaging with where people are going, not just where they are. This movement-based context enables stronger performance for categories like retail, QSR, entertainment, mobility, and local services, where proximity and timing directly influence outcomes.
💡From a planning perspective, digital transit provides continuity. Transit inventory delivers sustained exposure over days or weeks, reinforcing brand memory and improving recall rates, while still benefiting from DOOH capabilities such as programmatic buying, dynamic creative, and location-based measurement.
Why digital transit works: reach, data, and real-world attention
Digital transit advertising performs because it aligns three forces most digital channels struggle to combine at scale: real-world attention, movement-based data, and cost-efficient reach. Instead of competing for fragmented screen time, it operates inside daily routines where exposure is repeated, contextual, and measurable.
High-attention commuter environments
Transit environments capture attention when people are least distracted by choice. Commuters aren’t scrolling endlessly or skipping content; they’re waiting, riding, or moving through space. Average dwell times range from 5–15 minutes in stations and 15–45 minutes in vehicles, creating sustained exposure that online formats rarely achieve.
⚡️This matters because attention—not impressions—is what drives growth, yet most digital metrics still overvalue reach and clicks. As explored in AI Digital’s analysis of misleading performance signals, inflated online metrics often hide stagnating real impact. Transit cuts through that noise by delivering visible, unavoidable exposure that correlates more strongly with recall and brand lift.
Location-driven relevance at scale
Digital transit campaigns are activated based on where people are and where they’re going. Screens can deliver different messages by time of day, route direction, neighborhood, or proximity to retail and services, making relevance contextual rather than inferred.
At scale, this allows brands to align messaging with real-world intent—morning commuters, evening shoppers, weekend travelers—without relying on cookies or personal identifiers. The result is contextual targeting that remains privacy-safe while outperforming generic reach.
Cost-efficient reach beyond online saturation
Online media is increasingly expensive and crowded. CPMs for premium digital video have risen sharply, while attention has declined due to clutter and frequency caps. In contrast, digital transit often delivers 30–50% lower CPMs than premium online video, with built-in repetition driven by routine movement.
Because commuters encounter the same screens multiple times per week, brands achieve effective frequency without paying repeatedly for the same user, improving cost efficiency and reducing waste.
Neighborhood-level and route-based exposure
Transit advertising operates at a geographic resolution digital channels struggle to match. Campaigns can be planned around specific neighborhoods, corridors, or transit routes, making them especially effective for retail, QSR, entertainment, and local services.
When paired with addressable geofencing, transit exposure can be reinforced with mobile follow-ups or measured against post-exposure movement. This route-based logic allows advertisers to control not just who sees the message, but where and how often it appears within the urban fabric.
⚡️The AI Digital guide, What Is Addressable Geofencing? How It Works + Benefits, breaks down how geofencing layers integrate with DOOH and transit inventory, how zones are defined and activated in real time, and how advertisers use this framework to improve local relevance, frequency control, and performance measurement—without relying on personal identifiers.
Message reinforcement through daily movement
Repetition is not accidental in transit. A typical commuter may pass the same station or vehicle display 5–10 times per week, often at the same times of day. This creates consistent message reinforcement that strengthens memory encoding and brand association.
Unlike digital retargeting, which can feel intrusive or random, transit repetition feels natural because it mirrors daily life. Over time, this builds familiarity, trust, and recall, turning simple exposure into durable brand presence.
💡Together, these factors explain why digital transit works: it reaches people at scale, uses real-world data instead of assumptions, and earns attention through presence rather than interruption.
Measuring success in digital transit advertising
Measuring digital transit advertising requires shifting focus from surface-level metrics to real-world outcomes. Because transit campaigns operate in physical environments, success isn’t defined by clicks alone—it’s defined by exposure quality, movement, and behavior after exposure.
💡Modern transit measurement frameworks combine DOOH delivery data with location intelligence to show what actually changed because the campaign ran.
At the foundation are verified delivery metrics. These include impressions based on screen play-outs, dwell time, and modeled opportunity-to-see (OTS). Unlike many online metrics, these signals are grounded in physical presence and repeat exposure.
The next layer is real-world impact measurement. Using privacy-safe mobile location data, advertisers can analyze foot traffic lift, comparing exposed audiences to control groups that were not exposed to the campaign. This makes it possible to measure outcomes such as store visits, venue attendance, or neighborhood movement, often revealing 5–20% visitation lift depending on category, location, and creative.
Crucially, digital transit success is evaluated through the right KPIs—not inherited digital ones. Click-through rates and last-touch attribution often understate the value of high-attention, offline media. Instead, transit campaigns are assessed using metrics such as incremental reach, effective frequency, brand lift, mobility lift, and cost per visit. These indicators better reflect how exposure in transit environments influences awareness, consideration, and action over time.
⚡️AI Digital’s breakdown of modern performance frameworks explains how to align measurement with business outcomes rather than vanity metrics.
The result is a measurement model built for reality, not proxies. By combining verified delivery, location-based attribution, and outcome-driven KPIs, digital transit advertising can be optimized with the same rigor as digital channels—while capturing value that online-only metrics routinely miss.
AI-powered digital transit campaigns with AI Digital
AI Digital applies AI-native infrastructure to make digital transit campaigns smarter, more efficient, and fully measurable at scale. Instead of treating transit as static inventory, campaigns are built on three interconnected systems—Smart Supply, Open Garden, and Elevate—that align planning, activation, and optimization with real-world movement.
Smart Supply is the foundation. It focuses on inventory quality over raw volume, selecting transit screens based on real audience density, dwell time, route repetition, and contextual relevance. Rather than buying every available screen, digital media buying platform prioritizes placements that deliver predictable frequency and sustained attention, reducing wasted impressions and improving CPM efficiency—often by 20–40% compared to broad, untargeted buys.
Open Garden ensures campaigns operate in a transparent, interoperable ecosystem. Transit inventory is activated programmatically and connected to location data, measurement partners, and downstream channels without locking advertisers into closed platforms. This allows brands to plan digital transit alongside CTV, mobile, and retail media, while maintaining visibility into delivery, pricing, and performance signals. The result is cross-channel consistency without sacrificing control.
Elevate is the optimization layer. Powered by AI-driven analysis, Elevate continuously evaluatesexposure patterns, movement data, and outcome signals—such as visitation lift or route-level performance—to refine delivery in real time. Budgets can be shifted toward higher-performing routes, time windows, or neighborhoods, improving results while campaigns are live rather than after they end. In practice, this leads to stronger lift, tighter frequency control, and faster learning cycles.
Together, Smart Supply, Open Garden, and Elevate turn digital transit advertising into a dynamic performance system—one that plans with intelligence, executes with transparency, and optimizes based on real-world behavior. This is how AI Digital helps brands move beyond exposure and unlock measurable impact in the flow of everyday urban life.
Conclusion: Why digital transit belongs in modern media strategies
Digital transit belongs in modern media strategies because it solves a problem most channels now struggle with: how to reach real people, in the real world, with measurable impact—at scale. It captures attention in environments defined by routine and repetition, uses location and movement data instead of guesswork, and delivers outcomes that go beyond impressions. In an era of signal loss, rising CPMs, and fragmented attention, digital transit offers something increasingly rare: predictable exposure, contextual relevance, and accountable measurement.
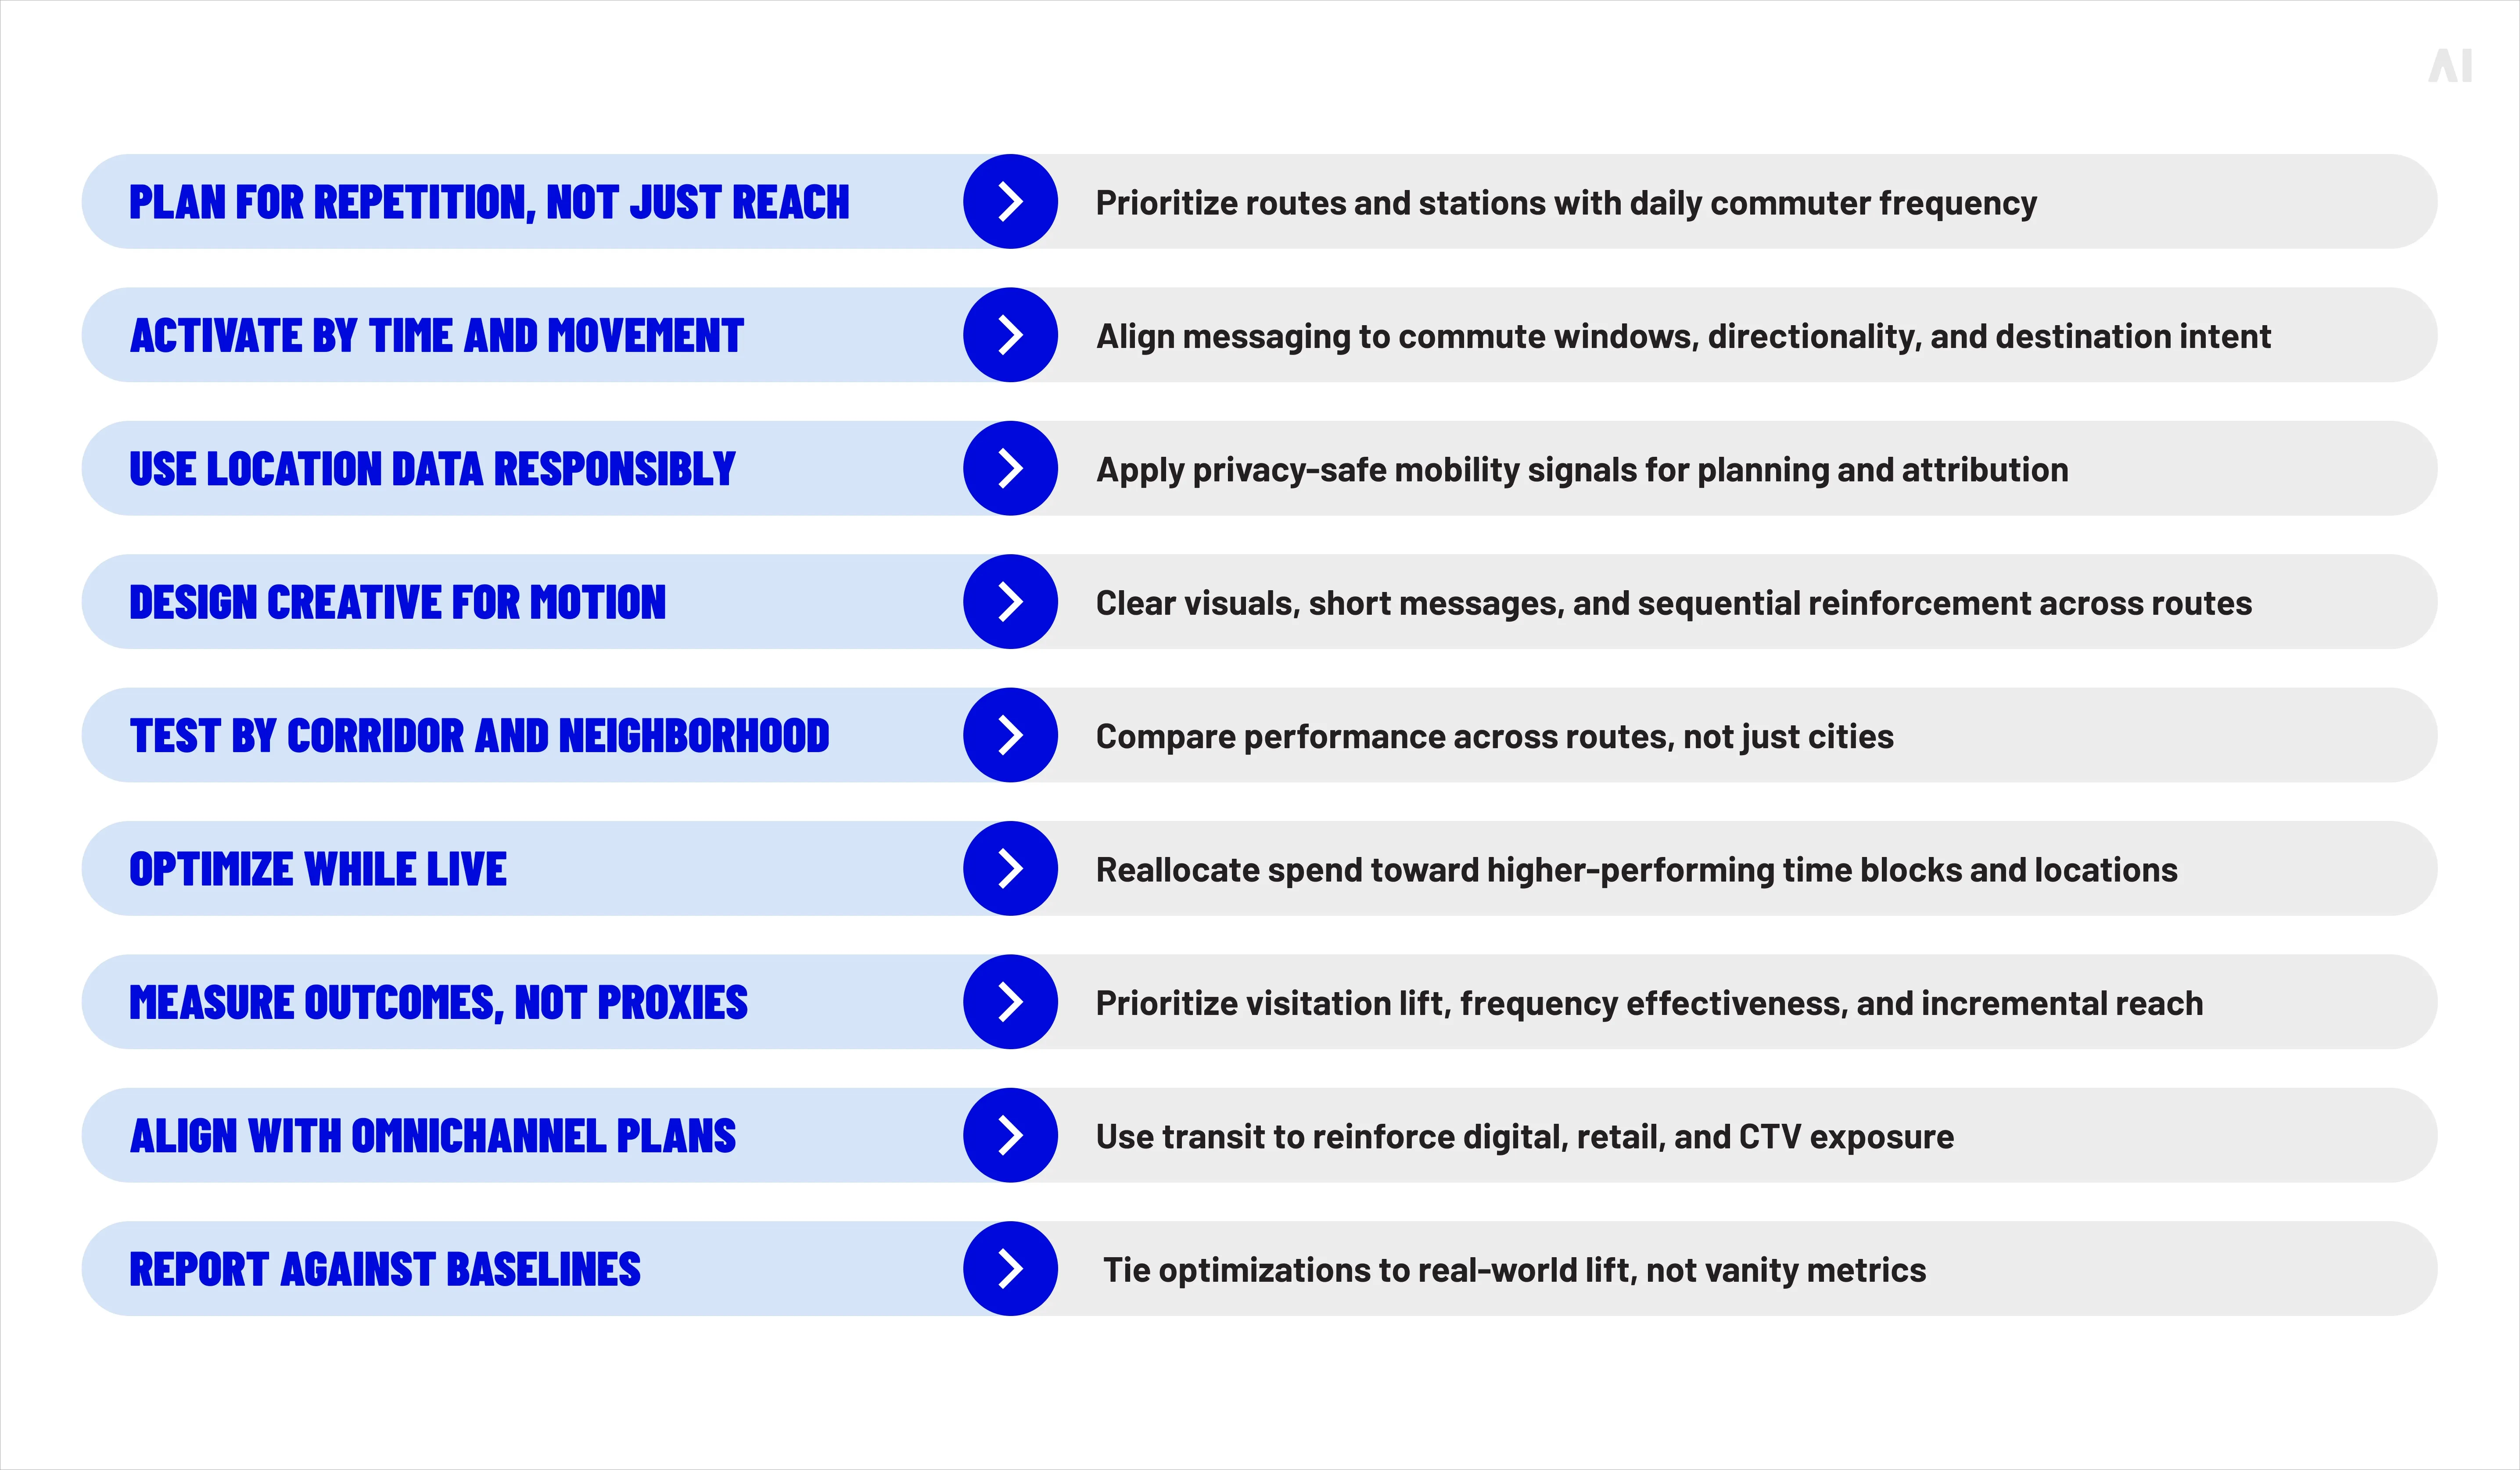
If you’re looking for a practical framework, here’s a transit-focused checklist teams can actually use:
Adopt these practices, and digital transit stops being “out-of-home.” It becomes a data-driven media layer that earns attention, reinforces memory, and delivers measurable growth where people actually live their lives.
If you want help building or optimizing a digital transit strategy, AI Digital supports brands through Smart Supply, Open Garden, and Elevate—combining quality inventory, transparent activation, and AI-driven optimization to align transit media with your business goals. Get in touch to design a transit plan that works in motion, not just on paper.
Blind spot
Key issues
Business impact
AI Digital solution
Lack of transparency in AI models
• Platforms own AI models and train on proprietary data • Brands have little visibility into decision-making • "Walled gardens" restrict data access
• Inefficient ad spend • Limited strategic control • Eroded consumer trust • Potential budget mismanagement
Open Garden framework providing: • Complete transparency • DSP-agnostic execution • Cross-platform data & insights
Optimizing ads vs. optimizing impact
• AI excels at short-term metrics but may struggle with brand building • Consumers can detect AI-generated content • Efficiency might come at cost of authenticity
• Short-term gains at expense of brand health • Potential loss of authentic connection • Reduced effectiveness in storytelling
Smart Supply offering: • Human oversight of AI recommendations • Custom KPI alignment beyond clicks • Brand-safe inventory verification
The illusion of personalization
• Segment optimization rebranded as personalization • First-party data infrastructure challenges • Personalization vs. surveillance concerns
• Potential mismatch between promise and reality • Privacy concerns affecting consumer trust • Cost barriers for smaller businesses
Elevate platform features: • Real-time AI + human intelligence • First-party data activation • Ethical personalization strategies
AI-Driven efficiency vs. decision-making
• AI shifting from tool to decision-maker • Black box optimization like Google Performance Max • Human oversight limitations
• Strategic control loss • Difficulty questioning AI outputs • Inability to measure granular impact • Potential brand damage from mistakes
Managed Service with: • Human strategists overseeing AI • Custom KPI optimization • Complete campaign transparency
Fig. 1. Summary of AI blind spots in advertising
Dimension
Walled garden advantage
Walled garden limitation
Strategic impact
Audience access
Massive, engaged user bases
Limited visibility beyond platform
Reach without understanding
Data control
Sophisticated targeting tools
Data remains siloed within platform
Fragmented customer view
Measurement
Detailed in-platform metrics
Inconsistent cross-platform standards
Difficult performance comparison
Intelligence
Platform-specific insights
Limited data portability
Restricted strategic learning
Optimization
Powerful automated tools
Black-box algorithms
Reduced marketer control
Fig. 2. Strategic trade-offs in walled garden advertising.
Core issue
Platform priority
Walled garden limitation
Real-world example
Attribution opacity
Claiming maximum credit for conversions
Limited visibility into true conversion paths
Meta and TikTok's conflicting attribution models after iOS privacy updates
Data restrictions
Maintaining proprietary data control
Inability to combine platform data with other sources
Amazon DSP's limitations on detailed performance data exports
Cross-channel blindspots
Keeping advertisers within ecosystem
Fragmented view of customer journey
YouTube/DV360 campaigns lacking integration with non-Google platforms
Black box algorithms
Optimizing for platform revenue
Reduced control over campaign execution
Self-serve platforms using opaque ML models with little advertiser input
Performance reporting
Presenting platform in best light
Discrepancies between platform-reported and independently measured results
Consistently higher performance metrics in platform reports vs. third-party measurement
Fig. 1. The Walled garden misalignment: Platform interests vs. advertiser needs.
Key dimension
Challenge
Strategic imperative
ROAS volatility
Softer returns across digital channels
Shift from soft KPIs to measurable revenue impact
Media planning
Static plans no longer effective
Develop agile, modular approaches adaptable to changing conditions
Brand/performance
Traditional division dissolving
Create full-funnel strategies balancing long-term equity with short-term conversion
Capability
Key features
Benefits
Performance data
Elevate forecasting tool
• Vertical-specific insights • Historical data from past economic turbulence • "Cascade planning" functionality • Real-time adaptation
• Provides agility to adjust campaign strategy based on performance • Shows which media channels work best to drive efficient and effective performance • Confident budget reallocation • Reduces reaction time to market shifts
• Dataset from 10,000+ campaigns • Cuts response time from weeks to minutes
• Reaches people most likely to buy • Avoids wasted impressions and budgets on poor-performing placements • Context-aligned messaging
• 25+ billion bid requests analyzed daily • 18% improvement in working media efficiency • 26% increase in engagement during recessions
Full-funnel accountability
• Links awareness campaigns to lower funnel outcomes • Tests if ads actually drive new business • Measures brand perception changes • "Ask Elevate" AI Chat Assistant
• Upper-funnel to outcome connection • Sentiment shift tracking • Personalized messaging • Helps balance immediate sales vs. long-term brand building
• Natural language data queries • True business impact measurement
Open Garden approach
• Cross-platform and channel planning • Not locked into specific platforms • Unified cross-platform reach • Shows exactly where money is spent
• Reduces complexity across channels • Performance-based ad placement • Rapid budget reallocation • Eliminates platform-specific commitments and provides platform-based optimization and agility
• Coverage across all inventory sources • Provides full visibility into spending • Avoids the inability to pivot across platform as you’re not in a singular platform
Fig. 1. How AI Digital helps during economic uncertainty.
Trend
What it means for marketers
Supply & demand lines are blurring
Platforms from Google (P-Max) to Microsoft are merging optimization and inventory in one opaque box. Expect more bundled “best available” media where the algorithm, not the trader, decides channel and publisher mix.
Walled gardens get taller
Microsoft’s O&O set now spans Bing, Xbox, Outlook, Edge and LinkedIn, which just launched revenue-sharing video programs to lure creators and ad dollars. (Business Insider)
Retail & commerce media shape strategy
Microsoft’s Curate lets retailers and data owners package first-party segments, an echo of Amazon’s and Walmart’s approaches. Agencies must master seller-defined audiences as well as buyer-side tactics.
AI oversight becomes critical
Closed AI bidding means fewer levers for traders. Independent verification, incrementality testing and commercial guardrails rise in importance.
Fig. 1. Platform trends and their implications.
Metric
Connected TV (CTV)
Linear TV
Video Completion Rate
94.5%
70%
Purchase Rate After Ad
23%
12%
Ad Attention Rate
57% (prefer CTV ads)
54.5%
Viewer Reach (U.S.)
85% of households
228 million viewers
Retail Media Trends 2025
Access Complete consumer behaviour analyses and competitor benchmarks.
Identify and categorize audience groups based on behaviors, preferences, and characteristics
Michaels Stores: Implemented a genAI platform that increased email personalization from 20% to 95%, leading to a 41% boost in SMS click through rates and a 25% increase in engagement.
Estée Lauder: Partnered with Google Cloud to leverage genAI technologies for real-time consumer feedback monitoring and analyzing consumer sentiment across various channels.
High
Medium
Automated ad campaigns
Automate ad creation, placement, and optimization across various platforms
Showmax: Partnered with AI firms toautomate ad creation and testing, reducing production time by 70% while streamlining their quality assurance process.
Headway: Employed AI tools for ad creation and optimization, boosting performance by 40% and reaching 3.3 billion impressions while incorporating AI-generated content in 20% of their paid campaigns.
High
High
Brand sentiment tracking
Monitor and analyze public opinion about a brand across multiple channels in real time
L’Oréal: Analyzed millions of online comments, images, and videos to identify potential product innovation opportunities, effectively tracking brand sentiment and consumer trends.
Kellogg Company: Used AI to scan trending recipes featuring cereal, leveraging this data to launch targeted social campaigns that capitalize on positive brand sentiment and culinary trends.
High
Low
Campaign strategy optimization
Analyze data to predict optimal campaign approaches, channels, and timing
DoorDash: Leveraged Google’s AI-powered Demand Gen tool, which boosted its conversion rate by 15 times and improved cost per action efficiency by 50% compared with previous campaigns.
Kitsch: Employed Meta’s Advantage+ shopping campaigns with AI-powered tools to optimize campaigns, identifying and delivering top-performing ads to high-value consumers.
High
High
Content strategy
Generate content ideas, predict performance, and optimize distribution strategies
JPMorgan Chase: Collaborated with Persado to develop LLMs for marketing copy, achieving up to 450% higher clickthrough rates compared with human-written ads in pilot tests.
Hotel Chocolat: Employed genAI for concept development and production of its Velvetiser TV ad, which earned the highest-ever System1 score for adomestic appliance commercial.
High
High
Personalization strategy development
Create tailored messaging and experiences for consumers at scale
Stitch Fix: Uses genAI to help stylists interpret customer feedback and provide product recommendations, effectively personalizing shopping experiences.
Instacart: Uses genAI to offer customers personalized recipes, mealplanning ideas, and shopping lists based on individual preferences and habits.
Medium
Medium
Share article
Url copied to clipboard
No items found.
Subscribe to our Newsletter
THANK YOU FOR YOUR SUBSCRIPTION
Oops! Something went wrong while submitting the form.
Questions? We have answers
How does transit advertising differ from traditional out-of-home (OOH) media?
Transit advertising is designed around movement and repetition, not one-off exposure. Traditional OOH often prioritizes broad visibility in fixed locations, while digital transit operates inside daily commuter routines, where the same audiences encounter messages multiple times per week. This built-in frequency, combined with digital screens and data-driven delivery, makes transit more predictable, more contextual, and easier to measure than classic OOH formats.
How can digital transit enhance a campaign?
Digital transit enhances campaigns by extending reach into high-attention, real-world environments that digital channels can’t fully capture. It reinforces messaging through repeated exposure, aligns creative with time, location, and movement, and improves overall effectiveness when paired with mobile, CTV, and retail media. Many campaigns use transit to amplify awareness while supporting measurable outcomes like store visits or local lift.
Who is the ideal audience for transit advertising?
Transit advertising is especially effective for urban and suburban commuters, including working professionals, students, and frequent city travelers. Because transit networks often reach 60–90% of the active population in dense metro areas, they provide broad access to economically active audiences with predictable daily patterns. It’s particularly strong for retail, QSR, entertainment, mobility, and local services.
Can transit advertising be targeted to specific neighborhoods or routes?
Yes. Modern digital transit campaigns can be planned around specific neighborhoods, corridors, stations, or routes, allowing brands to control where and how often messages appear. This route-based planning enables hyper-local relevance, supports neighborhood-level testing, and pairs well with addressable geofencing for follow-up measurement and attribution.
What role does AI play in optimizing transit campaigns?
AI helps optimize transit campaigns by analyzing exposure patterns, mobility data, and performance signals in real time. It identifies which routes, time windows, and locations drive stronger outcomes, then reallocates budget and delivery accordingly. This allows campaigns to improve while live, rather than relying solely on post-campaign analysis.
How do transit campaigns complement digital marketing efforts?
Transit campaigns complement digital marketing by reinforcing messages outside of personal screens and increasing overall frequency without increasing online fatigue. They work alongside mobile, CTV, and retail media to create omnichannel continuity, strengthening recall and improving the effectiveness of downstream digital touchpoints.
What metrics should marketers track to evaluate transit advertising success?
Marketers should track metrics that reflect real-world impact, not just exposure. Key indicators include verified impressions, effective frequency, dwell time, visitation lift, incremental reach, and cost per visit. When combined with proper baselines and control groups, these metrics provide a clearer picture of how transit advertising contributes to business outcomes.
Have other questions?
If you have more questions, contact us so we can help.

.svg)
.svg)


OOH%20Metrics%20Explained_%20How%20to%20Measure%20and%20Improve%20Campaign%20Performance%20(1).webp)

%20and%20How%20Does%20It%20Work.webp)