Why TV audience measurement is more complex than ever


Every television plan, buy, and post-campaign report rests on an estimate of who watched. TV audience measurement supplies that estimate, and for decades it came from one place: a recruited panel of households whose viewing was projected onto the population.
Television audience measurement now draws on panels, smart-TV data, set-top-box logs, and streaming platforms' own records, with the blend varying from one provider to the next. That evolution has bought marketers scale and granularity they never had, and it has also produced a market in which two credible providers can report different audiences for the same program without either being wrong.
This article explains how the pieces fit together, why streaming and shared screens make individual viewers harder to count, and what to check before setting one provider's number beside another's.
TL;DR: key takeaways
The short version, for readers who need the argument before the detail:
- Modern TV measurement combines several data sources, typically a representative panel plus one or more large-scale viewing datasets, rather than relying on a single feed.
- Big datasets add scale, not identity. Smart-TV and set-top-box data observe devices and households; turning that into people requires additional methodology.
- Panels still anchor person-level representation, supplying the demographics, household composition, and calibration that device data cannot.
- Streaming multiplies fragmentation and duplication. The same person appears in several platforms' counts, and unique reach depends on resolving that overlap.
- Every audience estimate should be read against its methodology, universe, and reported unit. A household rating, a device count, and a person-level impression are different measurements, not interchangeable ones.
Each of these points gets its own section below.
What is TV audience measurement?
TV audience measurement is the process of estimating who watches television content or advertising, how many people or households are reached, how often that viewing or exposure occurs, and how audiences distribute across programs, channels, platforms, and devices. The output is an estimate, produced by a defined method, of behavior that no single system observes in full.
What counts as "television" inside that definition depends on the measurement system. Modern services can include live linear viewing, time-shifted playback, video on demand, connected TV (CTV) apps, and streaming services, though coverage differs by provider and by product. Some systems measure only what happens on a television screen; others extend to mobile and desktop.
💡 Measuring CTV in particular comes with its own signal types and gaps, covered in AI Digital's guide to CTV measurement.
Audience measurement describes exposure and viewership. It does not, by itself, attribute sales, model incrementality, or prove that a campaign moved a business outcome. Those are downstream disciplines that consume audience data rather than produce it, and this article keeps them at the edge of the frame.
How TV audience measurement works today
No universal data source sits underneath modern TV measurement. Different providers assemble different combinations of a representative panel with larger device-level, return-path, automatic content recognition (ACR), first-party, or other viewing datasets, trading person-level representation against scale and granularity. The mechanics of each feed are less important to a marketer than the role it plays, so the table below summarizes what each source actually observes.
Representative audience panels
Audience measurement panels recruit households, install metering equipment or software, and record who in the home is watching what. Because the panel is built to mirror the population on age, gender, ethnicity, geography, income, and household size, its viewing can be weighted and projected to produce estimates for the country, a region, or a demographic group. The panel is the only source in the system that observes individual people directly, which is why it supplies person-level measurement, demographic composition, and the calibration that other datasets borrow.
Panel quality depends on methodology rather than headcount. A large panel that under-represents Spanish-dominant households or over-represents early adopters will project a distorted picture no matter how many homes it contains. Recruitment method, compliance, meter accuracy, and the weighting scheme decide how well the sample stands in for the whole.
ACR, return-path, and other large-scale viewing data
Large-scale viewing data arrives from two main sources.
- ACR data comes from smart TVs that recognize the content on screen by matching audio or video fingerprints against a reference library.
- Return-path data comes from cable and satellite set-top boxes that log tuning events back to the operator.
Both produce far more records than any panel, often across tens of millions of devices, and both can report tuning with second-level precision.
Neither knows who is in the room. ACR sees that a screen displayed a program; return-path data sees that a box was tuned to a channel, which can be true while the television is off. Coverage is uneven as well: ACR depends on which manufacturers participate and which owners have opted in, and return-path data excludes the growing population of streaming-only homes. Treating device counts as viewer counts is the single most common error in reading this data. These sources observe devices and households, and they produce person-level estimates only when a methodology, usually one anchored in a panel, converts them.
Hybrid measurement: combining panels and big data
Hybrid audience measurement exists to reconcile the two. The panel contributes representativeness and person-level detail; the large datasets contribute scale and stability, especially for programs and demographics too small for a panel to read reliably. In practice the panel calibrates the big data, assigning likely viewers to devices, correcting for coverage gaps, and projecting the combined result onto independent universe estimates.
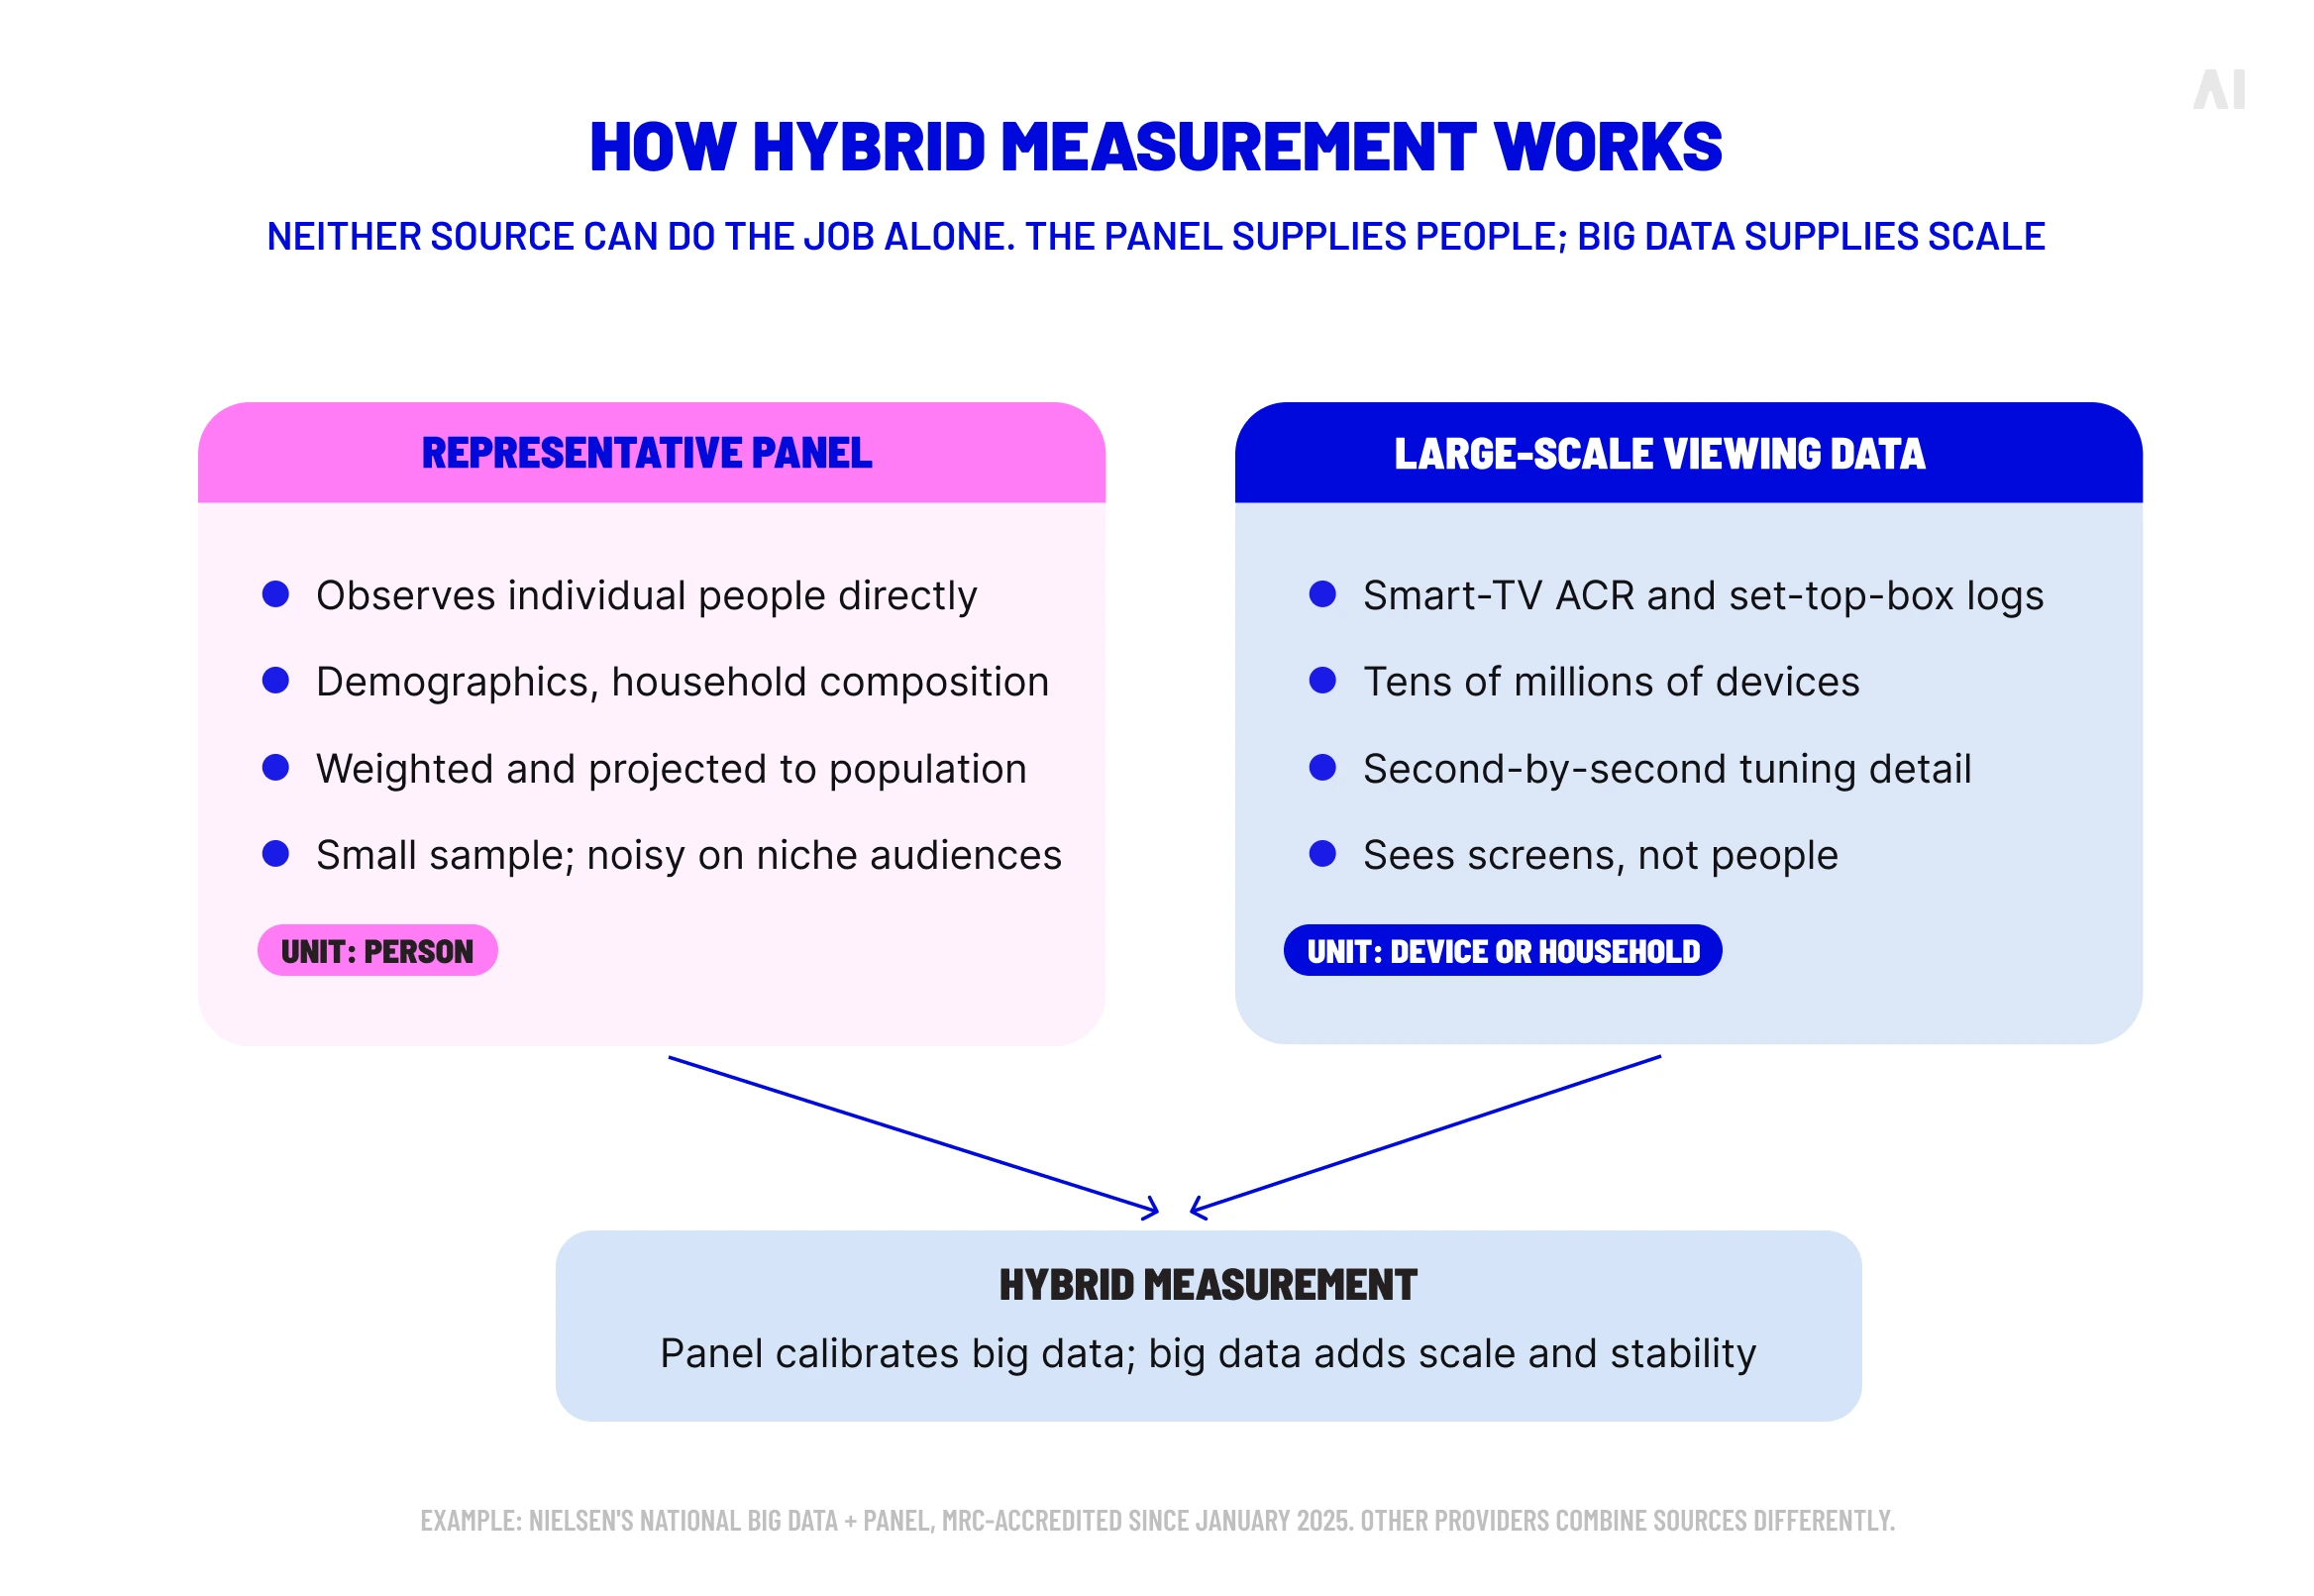
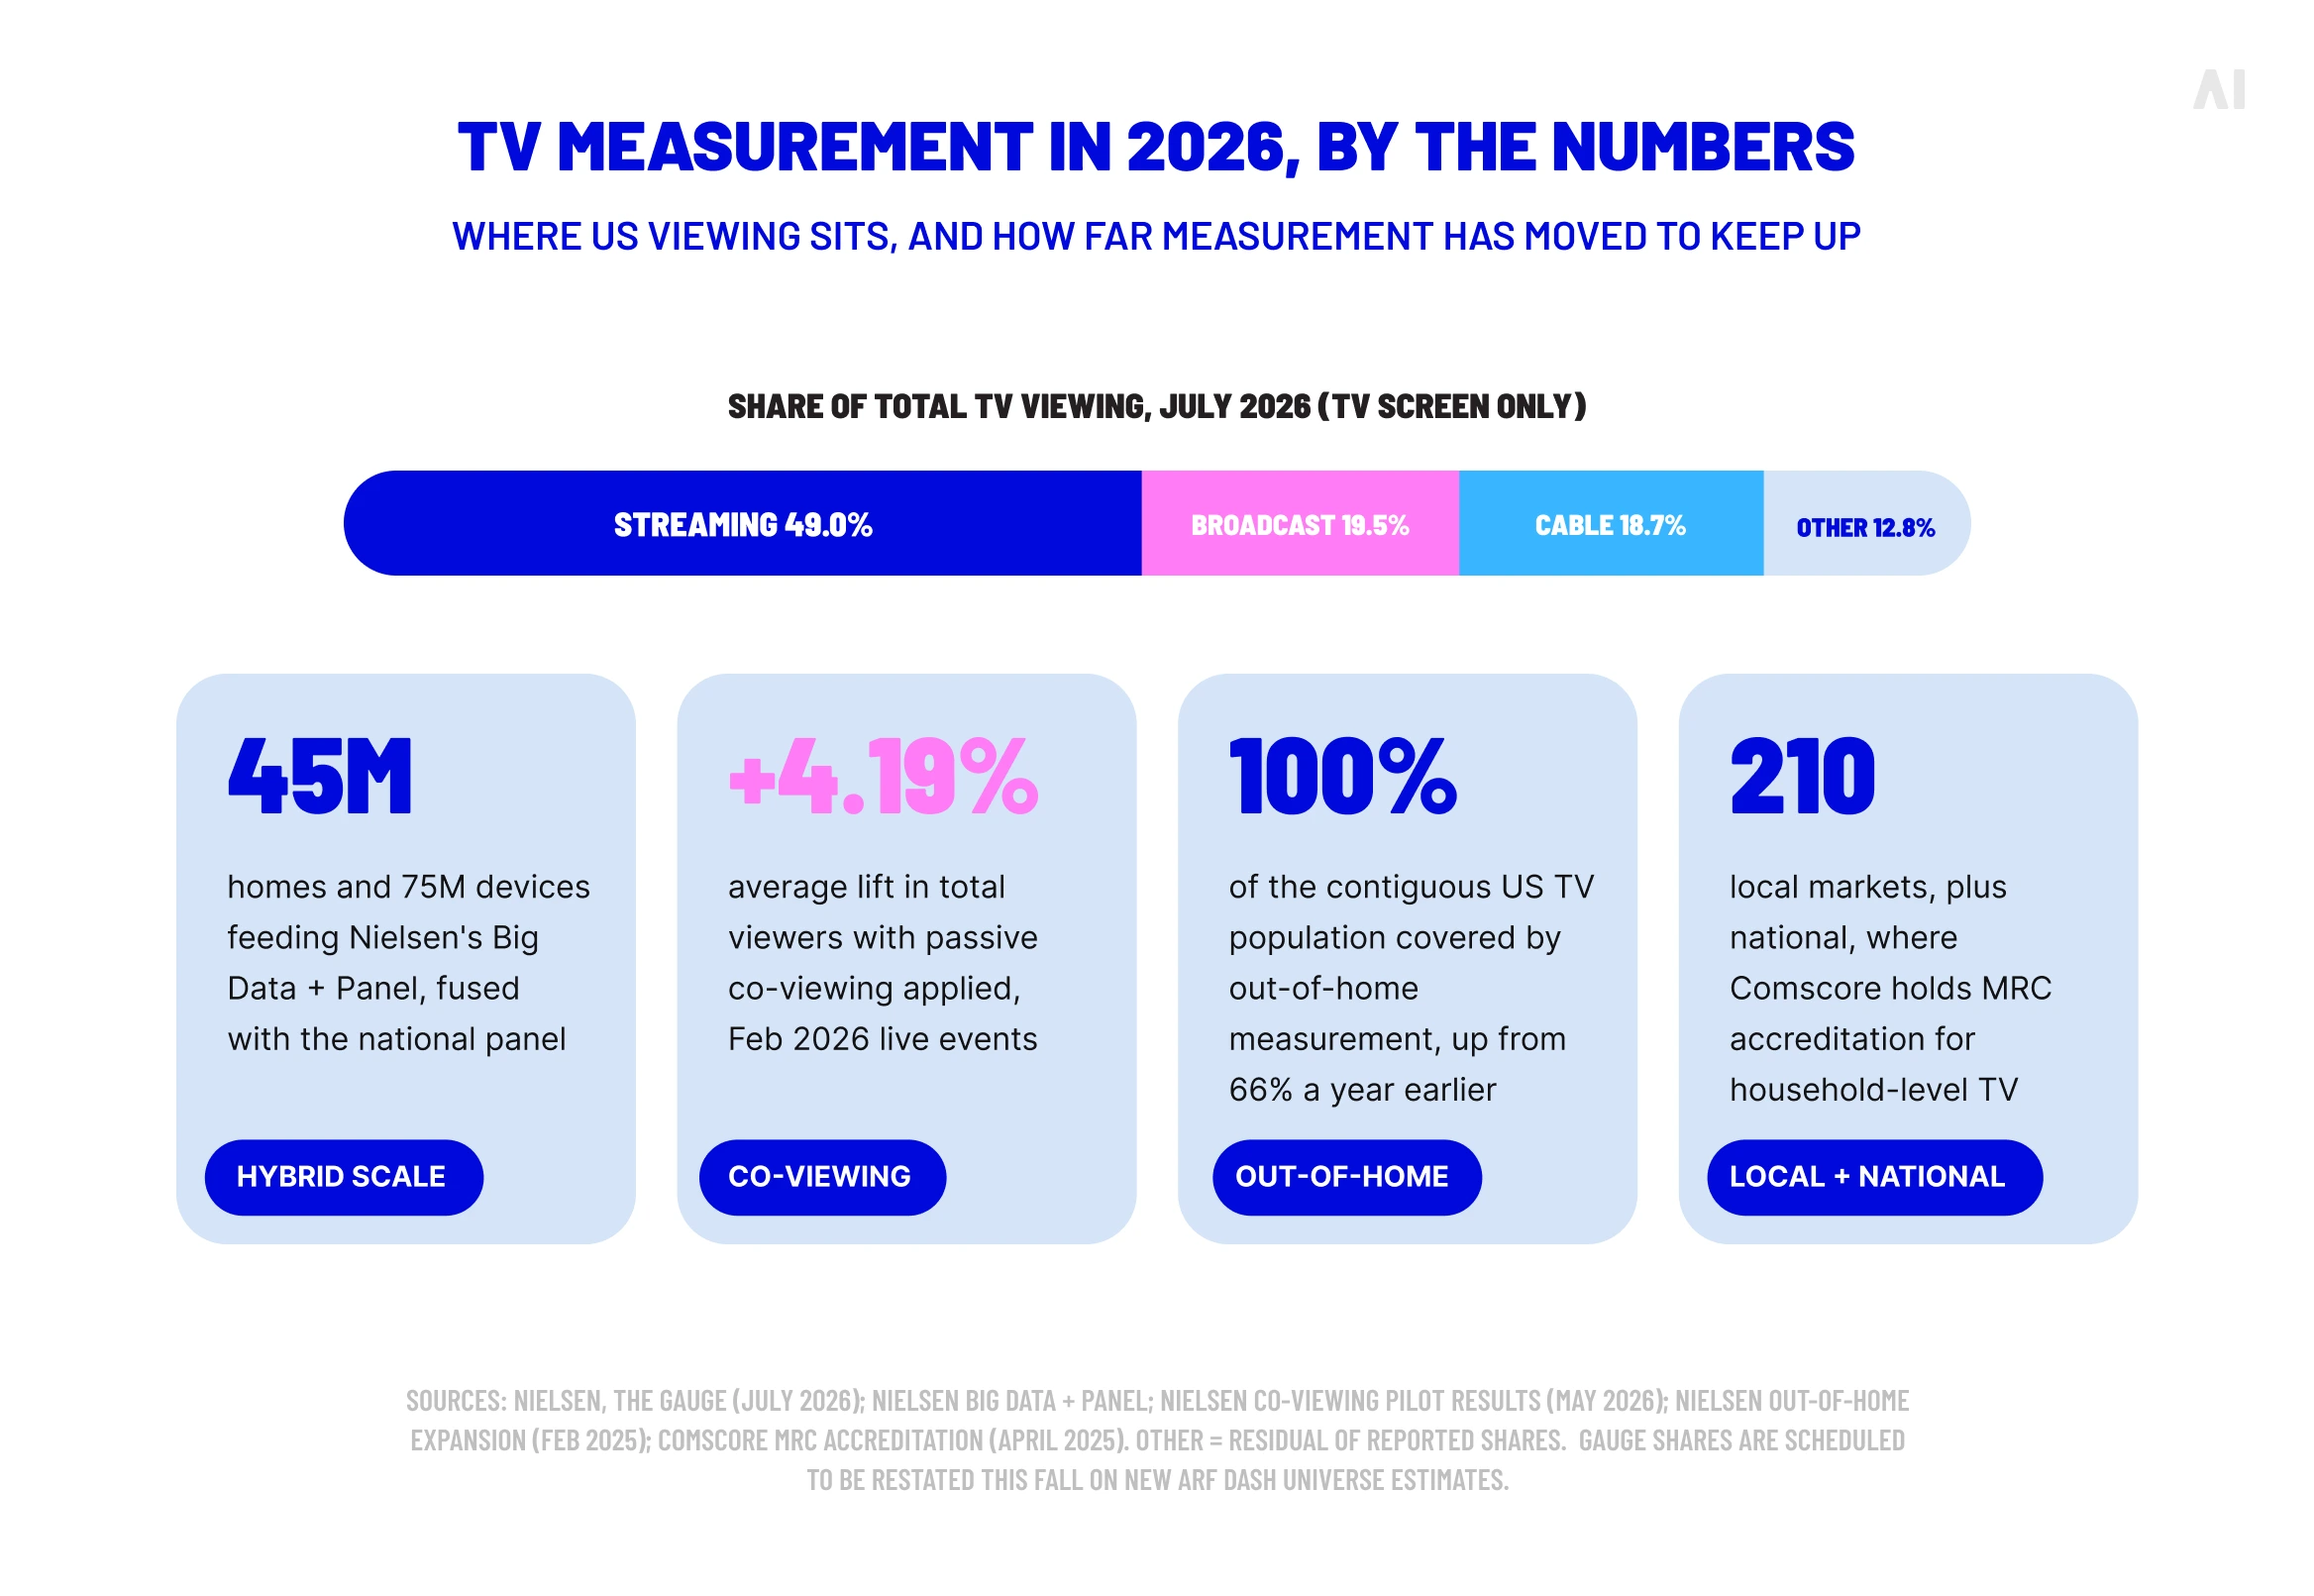
Nielsen's National Big Data + Panel service is the most visible example in the US market, though not the only model. The Media Rating Council (MRC), the industry's audit body, has accredited the service since January 2025 and reaffirmed that status in May 2026 after Nielsen addressed concerns about demographic assignment, weighting, and representation of underrepresented segments, with further methodology changes scheduled for August 31, 2026. The service draws on smart-TV and set-top-box data from roughly 45 million households and 75 million devices, fused with the national panel.
Comscore takes a different route, building household-level national and local measurement on device tuning data, while VideoAmp and iSpot build on their own combinations of smart-TV and set-top-box data. Each is a legitimate design choice with different consequences for the numbers.
⚡ Big data tells you how many screens were on. Only a methodology, anchored somewhere in a representative panel, can tell you how many people were watching.
Why TV audience measurement is more complex than ever
Complexity in television measurement is structural rather than a side effect of having more gadgets. Four changes account for most of it: viewing has fragmented across environments that do not share data; a screen no longer maps to a person; the same viewer now appears in several datasets at once; and the market has moved from one currency to several, each with its own definitions.
Viewing is fragmented across linear TV and streaming
Audiences move through broadcast, cable, subscription and ad-supported streaming, CTV apps, and on-demand libraries in the course of a single evening. Nielsen's July 2026 report of The Gauge put streaming at 49.0% of total TV usage, with broadcast at 19.5% and cable at 18.7%. Those shares describe viewing through a television screen; mobile and desktop streaming fall outside the report entirely.
Each environment exposes different signals. A broadcaster's linear feed is measured by panel and return-path data; a streaming service holds its own playback logs and decides how much to share; a CTV app may pass ad impressions to a verification vendor but not content viewing to a ratings provider.
Definitions diverge too. Under Nielsen's Gauge methodology, linear channels watched through apps like YouTube TV credit to broadcast or cable rather than streaming, a viewing qualifier that changes the headline split without changing anyone's behavior. The mechanics of how streaming platforms track their own audiences deserve their own treatment, and this article keeps them brief.
A screen, household, and viewer are not the same thing
A television that is on may represent one attentive person, four family members, or an empty room. Measurement systems work with a ladder of units, and each rung requires a different method to reach:
- Device: a smart TV or set-top box logging activity.
- Household: the home the device sits in, often inferred from an address or subscriber record.
- Account: a streaming subscription, which may be shared across homes.
- Profile: a named user within an account, which may be shared across people.
- Person: an individual viewer with a known age and gender.
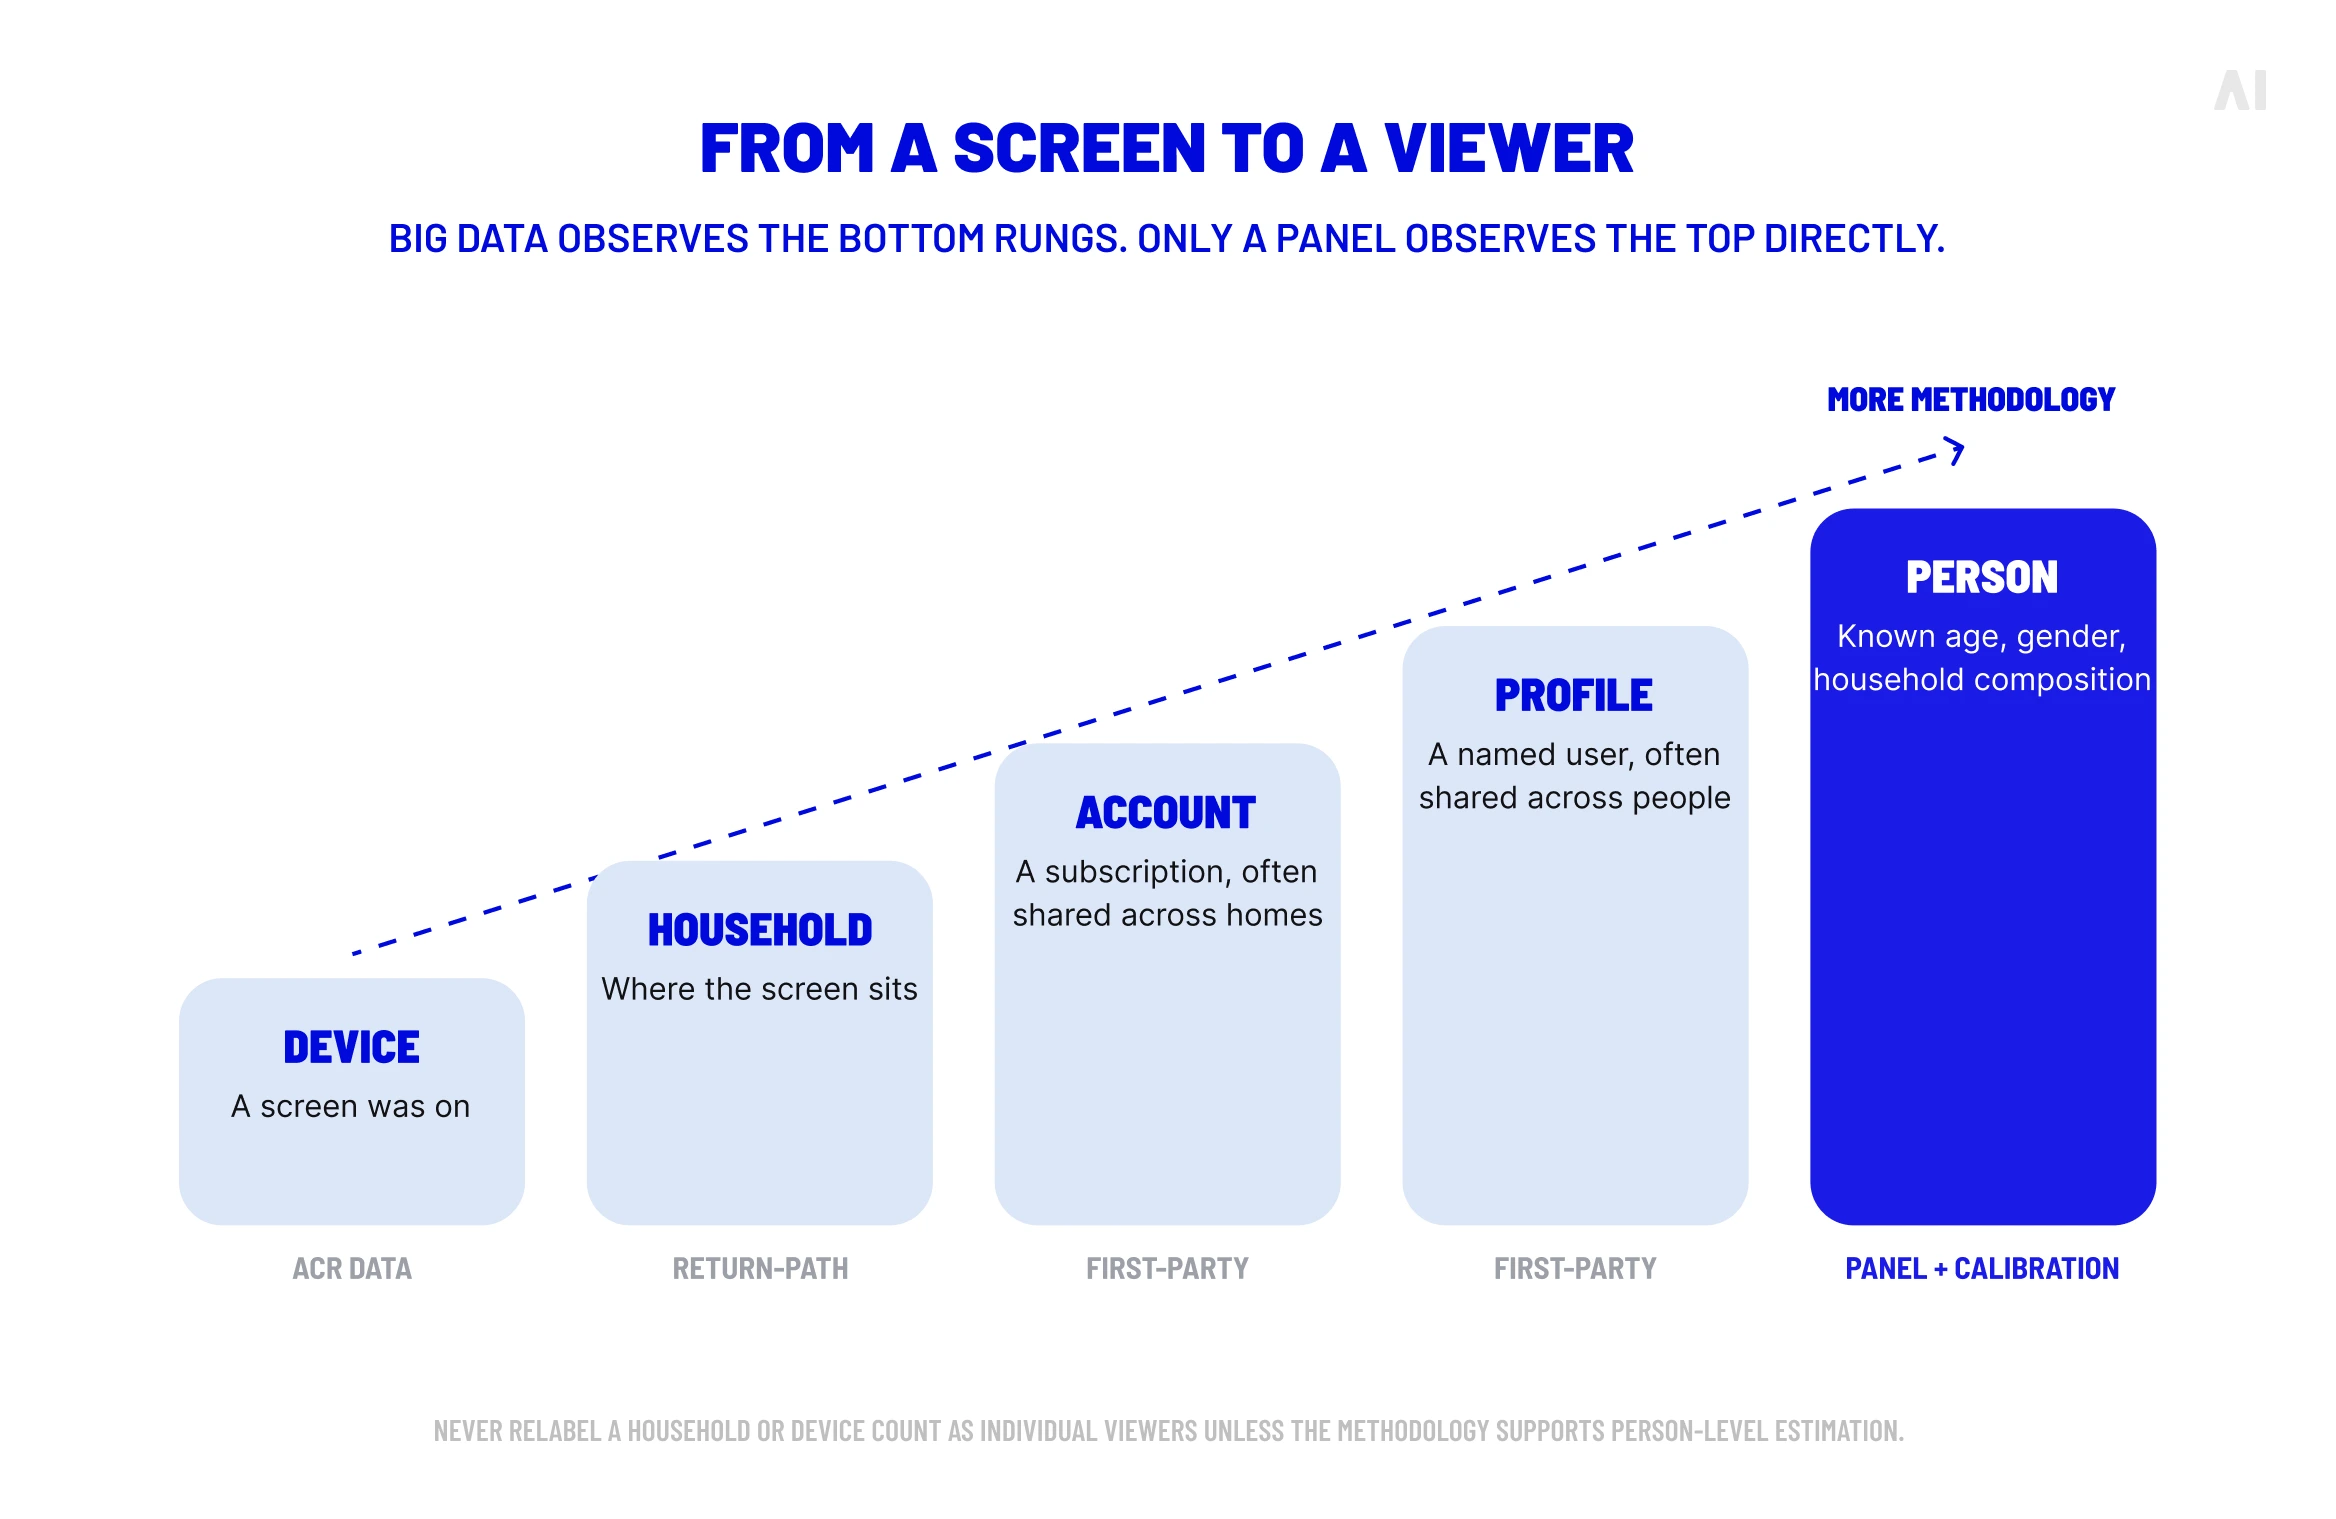
Device data lives on the first rung. Moving to the fifth requires co-viewing estimation, the process of working out how many people share a screen and who they are. Panels do this directly, because panelists log in or are detected passively. Big data systems borrow the panel's co-viewing rates, apply household composition, or use calibration models to assign viewers to a device.
The margin is not trivial: Nielsen's 2026 co-viewing pilot, which used wrist-worn wearables to detect panelists passively during live events, reported an average lift of 4.19% in total viewers across February's marquee telecasts, and the enhancement entered its currency measurement on August 31. That is one provider's approach; others estimate co-viewing differently, and no method observes every viewer in every room.
The rule for marketers is simple to state and easy to break: never relabel a household or device count as individual viewers unless the methodology behind it supports person-level estimation.
Cross-platform reach requires deduplication
The same person watches a game on broadcast, catches highlights in a streaming app, and sees the sponsor's spot in both. Each platform reports an audience. Add the two figures and the viewer is counted twice. Audience deduplication resolves that overlap so that unique reach reflects distinct people or households rather than the sum of platform reports.
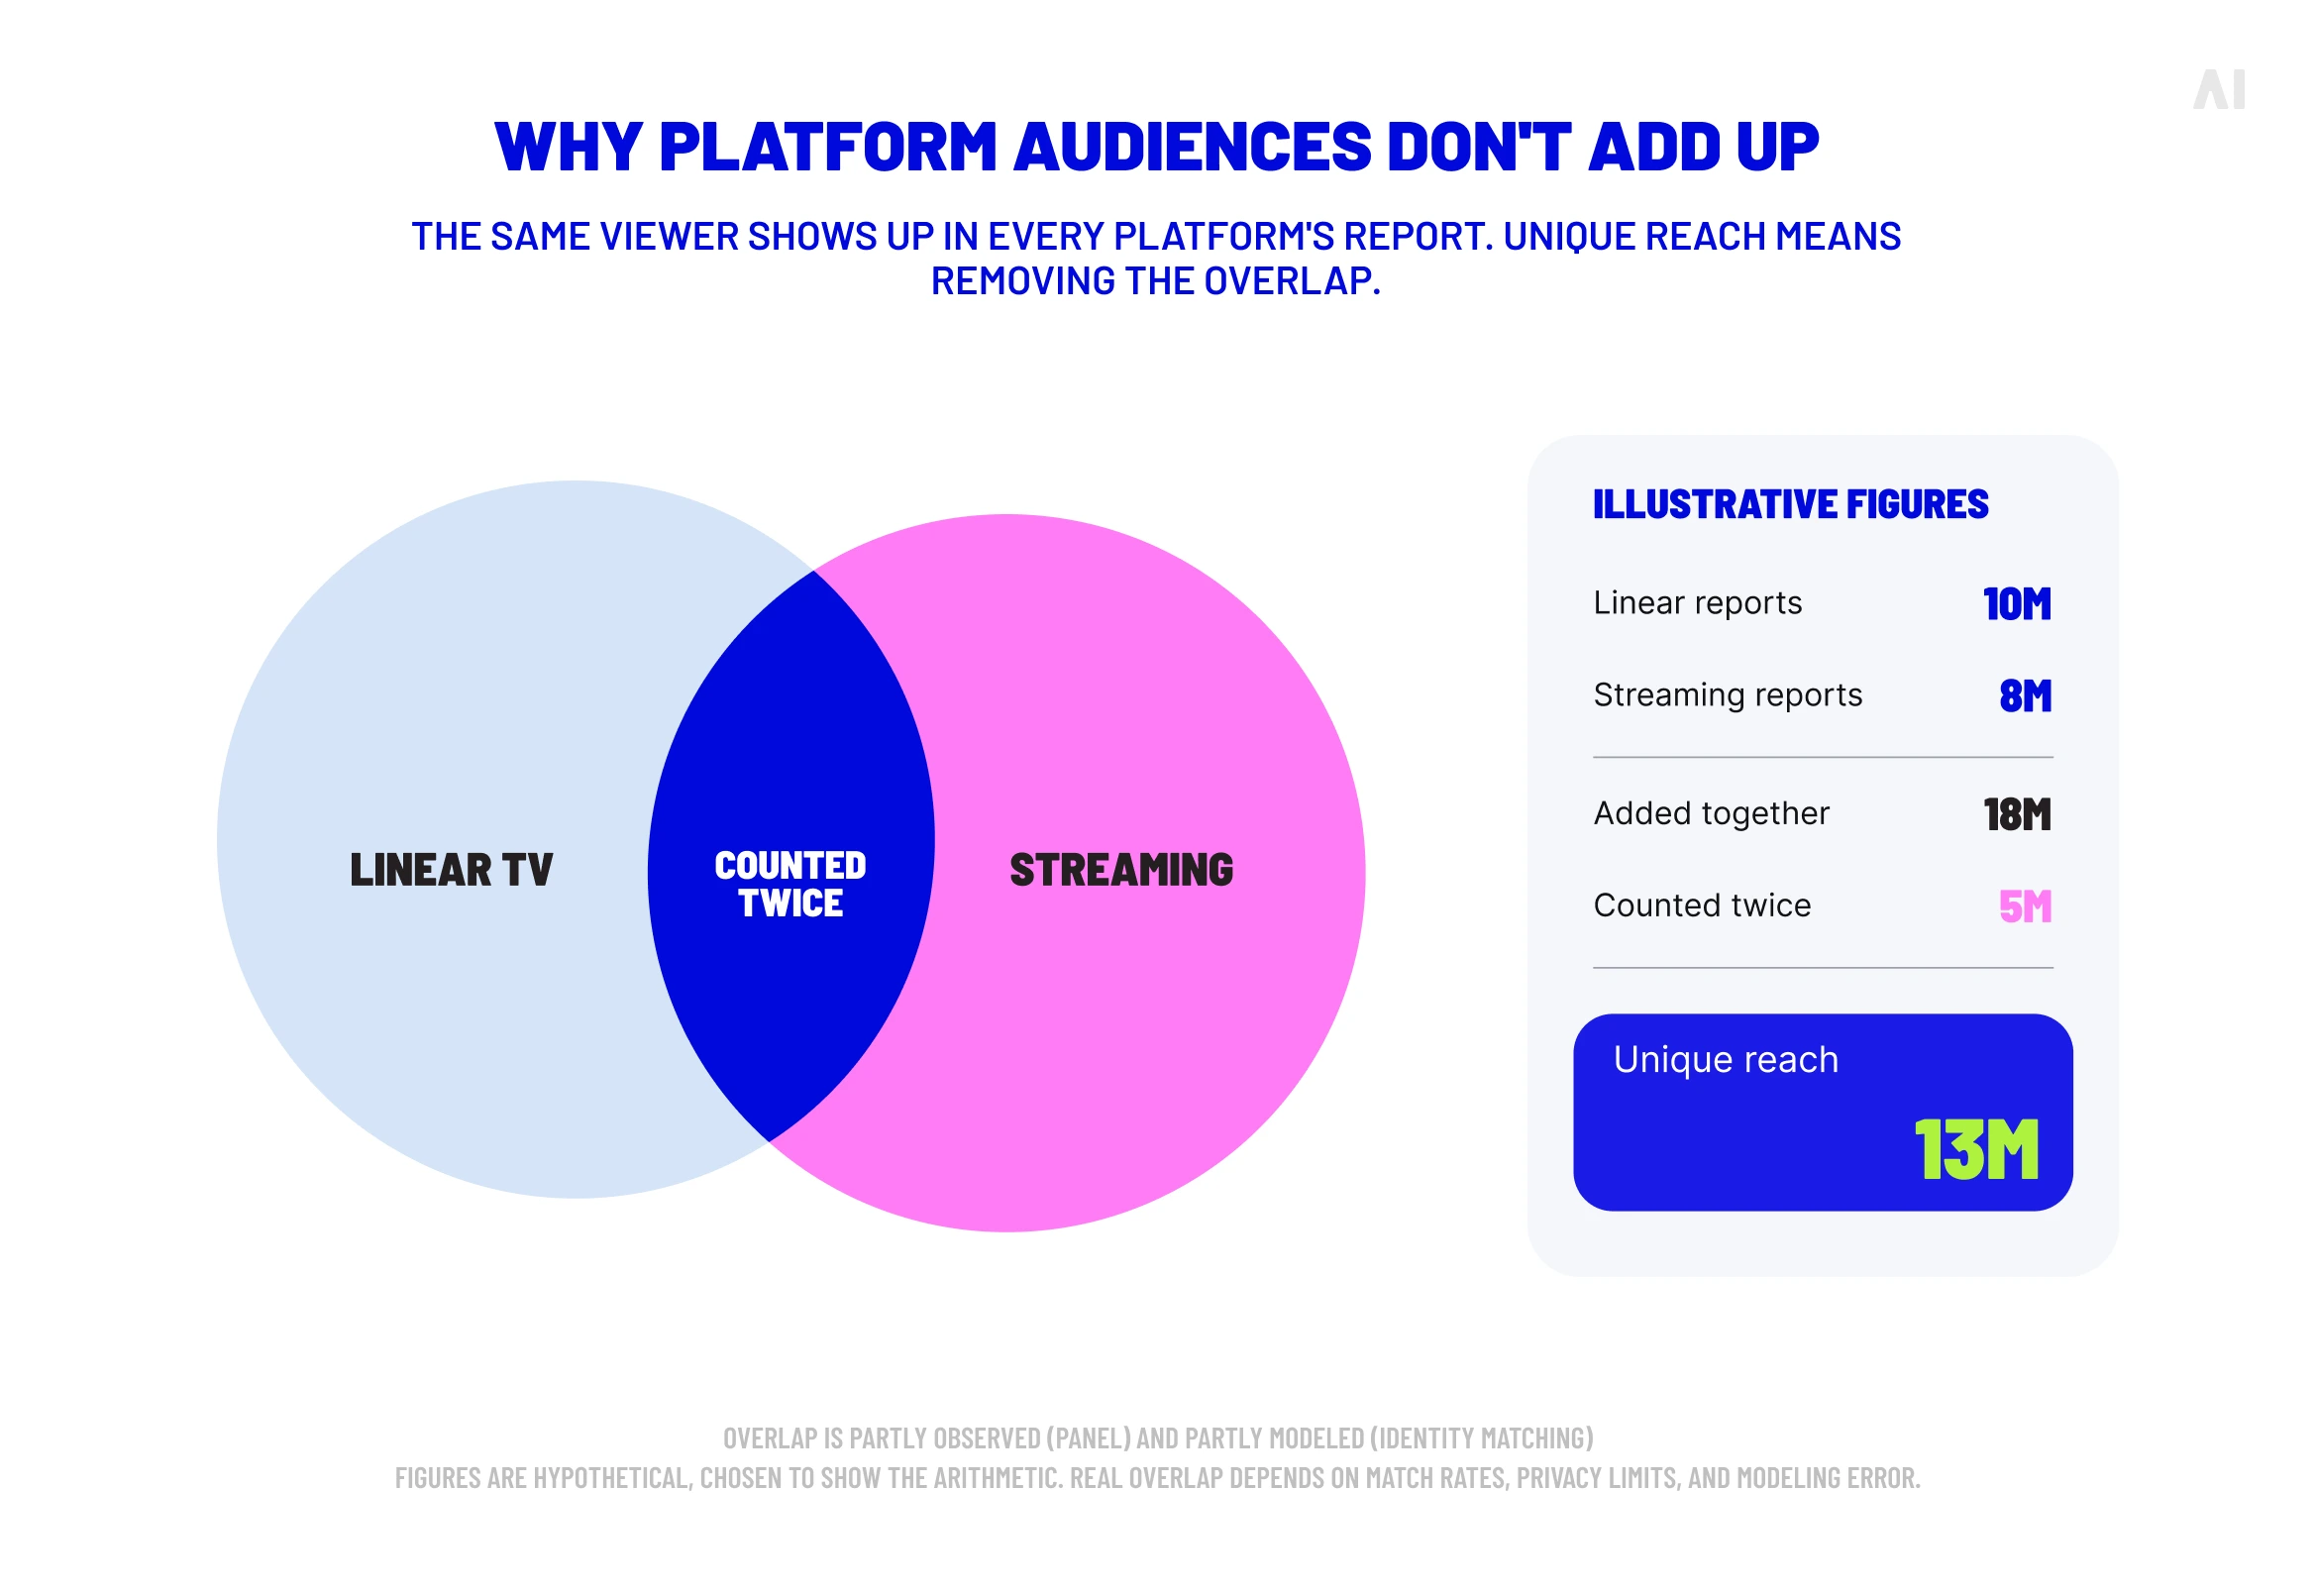
Deduplication combines observed and modeled information. Within a panel, overlap is observed directly. Across big datasets, it relies on identity resolution: matching devices, accounts, and households through hashed identifiers, IP addresses, or third-party graphs, with probabilistic models filling the gaps. The result is an estimate of unique reach, and a good one, but it should never be described as perfect individual identification. Match rates vary, privacy rules constrain what can be linked, and modeled overlap carries its own error.
⚡ Adding platform audiences together does not give you reach. It gives you exposures with the duplicates still in.
More providers, currencies, and definitions complicate comparison
The US market now runs on several TV measurement currencies. A currency, in this context, is an agreed measurement basis that buyers and sellers use to transact media, and the word should not be stretched to cover every analytics dataset. Three concepts sit close together here and deserve separating:
- Methodology is how a provider produces its estimates.
- Accreditation is an independent audit confirming that a provider does what it says it does; in the US that role belongs to the MRC.
- Currency status is market adoption, meaning buyers and sellers agree to transact on the numbers.
The three do not travel together. In July 2026, VideoAmp and Nielsen One both withdrew from the MRC accreditation process, yet VideoAmp remains a certified transactable currency under the US Joint Industry Committee (JIC), which certifies providers on two-year terms with mid-term audits and lists Comscore and iSpot alongside it. Comscore holds MRC accreditation for household-level TV measurement across national and all 210 local markets. Different badges, different scopes, different units.
Behind the badges sit the choices that move numbers:
- Universe: which population the provider projects to, and where that estimate comes from
- Panel: how large and how representative it is
- Big data coverage: which ACR brands and MVPDs feed the dataset
- Viewing qualifiers: what counts as a qualifying view
- Weighting: how the sample is balanced and scaled
- Co-viewing: how viewers per screen are estimated
- Identity: which approach links devices and accounts to people
- Reporting window: which period the estimate covers
Two providers can execute two sound methodologies and land on different audiences for the same telecast.
💡 The same logic applies when comparing a walled garden's self-reported reach with an independent cross-platform figure, a tension explored in AI Digital's piece on walled gardens versus the open internet.
The TV audience metrics marketers need to interpret carefully
The vocabulary of TV ratings predates streaming, and most of the terms survive with their meanings intact but their denominators in flux. The table below lists the core audience metrics and the question to ask of each before quoting it.
Ratings, share, and average audience
A rating expresses audience as a share of a universe; share expresses it as a proportion of people or homes using television at that moment; average audience gives the mean across a program or daypart. All three depend on a denominator, and that denominator is itself an estimate.
In January 2026 the MRC accredited the ARF DASH TV Universe Study, describing universe estimates as industry infrastructure essential for calibrating viewership data and projecting audiences. Providers adopting new universe estimates will see their ratings move even when viewing does not, which is one reason a rating from one source and a rating from another cannot be read side by side without knowing what each divides by. Formulas differ by market and provider; when a definition is quoted, it should carry its source.
Reach and frequency
Audience reach counts unique households or people exposed at least once; impressions count every exposure, repeats included. Audience frequency is the ratio between them, and it is only as reliable as the deduplication that produced the reach figure. A campaign reported by three platforms will show three reach numbers that overlap and three frequency numbers that understate the true load on any household reached by all of them. Household frequency and person frequency also diverge, because a spot seen once by a household of four registers as four person-level exposures.
💡 Managing that load across screens is the subject of AI Digital's guide to frequency capping.
Audience composition and demographics
Composition reporting describes who is represented within measured viewing: the age, gender, ethnicity, and income profile of the audience. Where the numbers come from decides how much weight they can bear. Panel demographics are observed. Big data demographics are assigned, either by matching a device or household to first-party or third-party records, by calibrating against the panel, or by modeling. A smart TV does not know the age of the person on the sofa, and any demographic attached to ACR viewing has traveled through one of those methods to get there.
How to compare TV audience numbers across providers
Comparing headline audiences before comparing methodologies is how planning decisions go wrong. The checklist below turns the questions raised in this article into a sequence to run before any two reports are placed side by side.
Run the checks in order:
- Confirm the unit and universe first; if they differ, stop and reconcile before reading further.
- Map platform and device coverage against the campaign's actual footprint.
- Note where each provider models rather than observes, and treat those figures as estimates with wider bounds.
- Align qualifiers, windows, and geography.
- Only then compare headline audiences, and document the residual differences rather than forcing a one-to-one match.
Datasets built on materially different universes or methods should be compared for direction and magnitude, not reconciled to the decimal.
What TV audience measurement can, and cannot, tell advertisers
Audience measurement answers exposure questions: who watched, how many households or people were reached, how often they were exposed, and how the audience was composed. Those are the inputs a planner needs to price inventory, set frequency goals, and judge whether a buy delivered what was promised.
It does not answer causal questions. A high rating does not prove that television produced a sale, a lift in brand consideration, or a store visit. Establishing cause requires different tools: attribution links exposures to outcomes at the individual or household level; incrementality testing compares exposed and unexposed groups to isolate the effect of media; marketing mix modeling estimates the contribution of each channel from aggregate data over time. Each consumes audience measurement as an input and adds a layer of inference on top.
💡 AI Digital's guide to unified marketing measurement explains how those layers fit together.
The point for this article is narrower: audience figures describe delivery, and delivery is where their authority ends.
⚡ A rating tells you the message arrived. It does not tell you what the message did.
How AI Digital helps connect TV and cross-channel measurement
Television audience data rarely reaches a marketer alone. It lands beside impressions from a dozen DSPs, search and social reports, and whatever the streaming platforms choose to share, each in its own format and on its own unit. Elevate, AI Digital's marketing intelligence platform, is built for that reconciliation. Its Advanced Reporting capability centralizes core metrics across 12 or more integrated DSPs, search, and social into automated dashboards, so that TV delivery figures sit in the same view as the rest of the plan rather than in a separate spreadsheet. Path to Conversion maps cross-screen journeys and touchpoints ahead of a conversion, and Marketing Mix Modeling ingests top-funnel data, television included, to estimate cross-channel influence and inform budget allocation.
Elevate is not a ratings currency, and it does not measure who is watching a television. It takes the audience estimates produced by established measurement systems and the performance data produced by media platforms, and gives marketers one place to interpret them together. The distinction is deliberate: the platforms that count viewers and the platform that connects those counts to campaign performance do different jobs, and marketers need both.
Make TV audience numbers comparable before acting on them
Modern TV audience measurement is more capable than the panel-only era ever was, and also easier to misread. Every figure now carries a methodology, a universe, a unit, and a degree of modeling, and none of those travel with the number when it is pasted into a deck. Read them back in before comparing sources, setting guarantees, or reallocating budget. Insist on methodological transparency from providers, hold definitions constant across reports, and treat a precise-looking audience figure as one estimate among several rather than the final word. Marketers who want help building cross-channel reporting that respects those distinctions can talk to AI Digital's team.