OTT audience measurement: how streaming audiences are tracked


Every stream start, ad impression, and session timestamp adds to a growing pile of data, and that abundance is exactly what makes OTT audience measurement deceptive. An impression records that a device rendered an ad. Reach claims to describe households or people. The distance between those two statements is where measurement happens, and it is filled with panels, identity graphs, co-viewing factors, and modeled estimates that most reports never show.
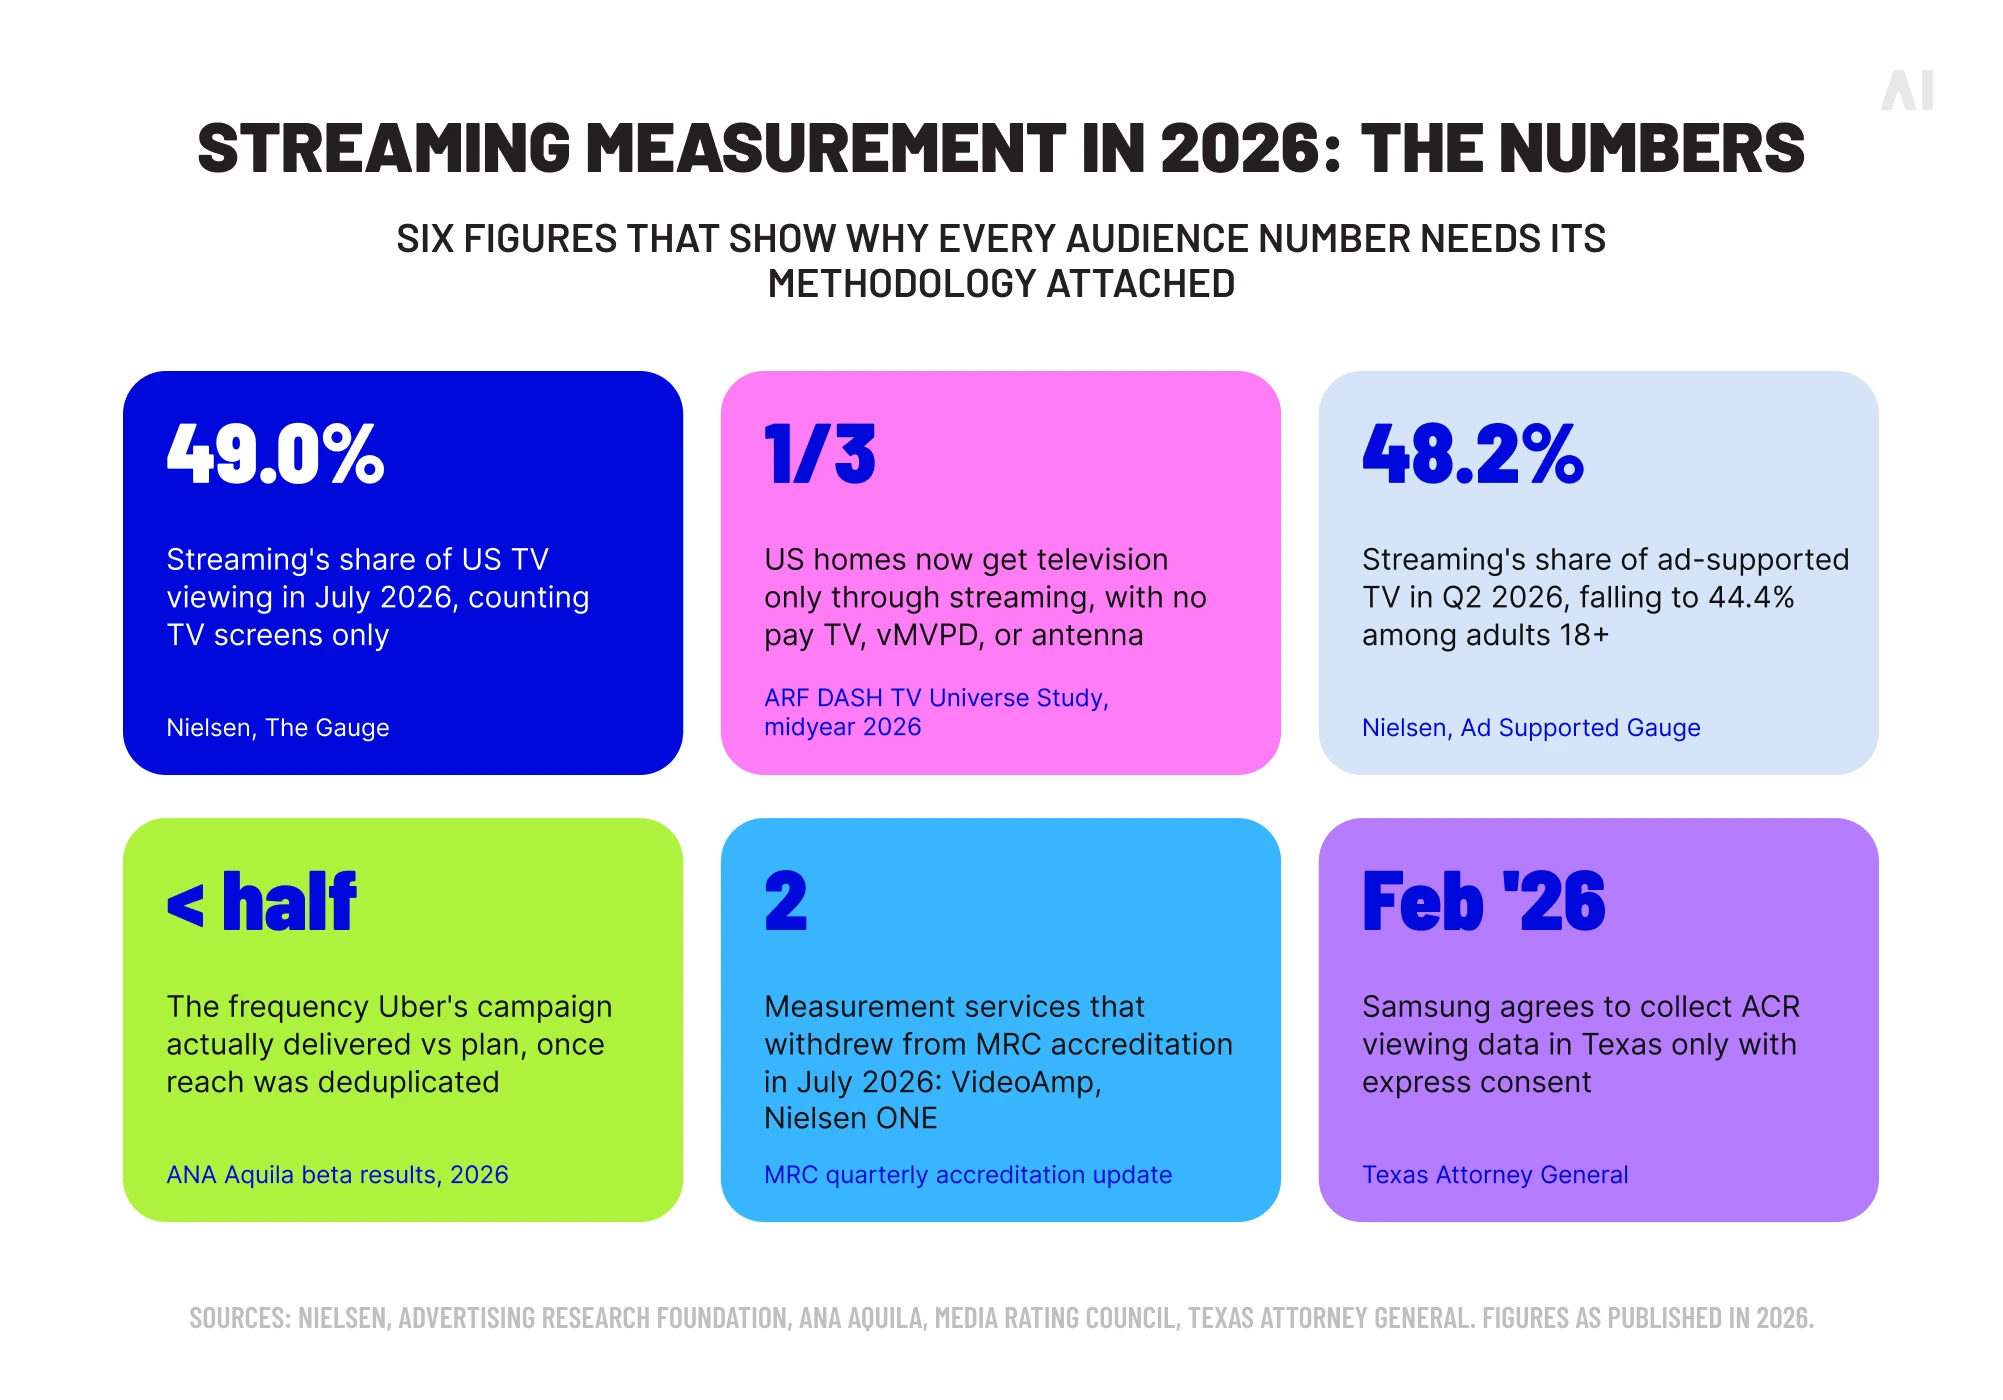
The stakes have risen as viewing spreads across streaming apps, smart TVs, streaming sticks, phones, and the accounts and profiles layered on top of them. Streaming accounted for 49.0% of US TV viewing in July 2026, and even that figure carries two footnotes: it counts viewing through television screens only, leaving phones and laptops out of the denominator (and Nielsen states that the report does not yet reflect the universe-estimate changes it made to its currency ratings this year). A headline share depends on what was counted, how, and against what universe.
This article explains how streaming audiences are tracked, why credible providers report different numbers for the same campaign, and what to ask before comparing any two reports.
TL;DR: key takeaways
If you read nothing else, these are the principles that govern every number in a streaming audience report.
- OTT audience measurement combines several types of data, including streaming and ad-delivery logs, smart-TV ACR data, set-top-box data, representative panels, first-party platform data, and identity graphs. No single source covers everything.
- A device-level signal does not identify a person. Impressions, sessions, accounts, and profiles describe activity on a screen or in an app, and converting them into viewers requires modeling.
- Panels and large-scale datasets do different jobs. Panels supply demographics and person-level calibration; big data supplies scale and granularity. Modern measurement blends the two.
- Co-viewing and cross-platform duplication are the two forces that most distort person-level estimates, and providers handle them differently.
- Read the methodology before comparing results. Two reports labeled "unique reach" can rest on different units, universes, windows, and identity rules.
Each of these points gets its own treatment below.
What is OTT audience measurement?
OTT audience measurement is the process of estimating who watched streaming content or advertising, how many unique households or people were reached, how often they were exposed, and how that viewing was distributed across audiences and devices. It answers exposure and viewership questions, and it stops short of explaining what the exposure caused.
A quick vocabulary note helps here, because the industry uses two overlapping terms.
- OTT refers to video delivered over the internet to any device, including phones, tablets, laptops, and televisions.
- CTV refers specifically to viewing on connected television devices, whether through a smart TV's operating system, a streaming stick, a console, or a set-top box.
CTV audience measurement is therefore a large and important subset of the broader streaming audience measurement problem, but the two are not interchangeable. A campaign bought across streaming TV advertising environments may reach the same household on a living-room screen in the evening and a phone the next morning, and only the first of those is a CTV impression.
The universe itself is moving underneath all of this. The Advertising Research Foundation's DASH study, which the Media Rating Council accredited in January 2026 as an independent standard for TV universe estimation, found in its midyear 2026 release that nearly a third of US homes now receive television only through streaming, with no pay-TV, vMVPD, or antenna connection at all. When the base population changes that quickly, every share and reach figure built on top of it changes too.
Attribution, conversion tracking, subscriber retention, and technical stream quality all sit outside this definition. Streaming businesses and advertisers rely on all of them, but they answer different questions with different data.
How OTT audiences are tracked
There is no universal OTT measurement stack. Each platform and each measurement provider assembles its own combination of viewing signals, panels, account data, device data, and identity methods. That combination determines what the resulting audience numbers can and cannot claim. The table below summarizes the main ingredients before each is examined in turn.
Each of these sources sees a different slice of viewing, and each reports in a different unit.
Streaming, player, and ad-delivery data
Streaming services, apps, video players, and advertising systems record events as they happen: a stream begins, a session runs for a certain duration, an ad impression fires at a timestamp against a piece of content on a particular device type. Server-side ad insertion and app-level logging make this data plentiful, and it forms the base layer for almost every streaming audience report.
The limitation is built into what the data is. A recorded impression is evidence that a device or player rendered an ad, and nothing more. It does not say whether one person was watching, whether four were, or whether the television was playing to an empty room. It also cannot recognize that the same household appeared an hour earlier through a different app on a different device. Impression logs describe delivery, and delivery is the starting point of audience measurement rather than the end of it.
Smart-TV ACR and other large-scale device data
Automatic Content Recognition, or ACR data, comes from software inside many smart TVs that periodically fingerprints whatever is on screen, matches it against a reference library, and records which content or advertising was displayed, regardless of whether the source was a built-in app, a streaming stick, a cable box, or a game console over HDMI. Set-top-box return-path data plays a similar role for pay-TV homes, and both are used in broader television and cross-platform measurement. Nielsen's currency, for example, draws on return-path data from set-top boxes, ACR data from certain smart-TV brands, streaming data, and its national panel, according to the MRC's March 2026 description of the service.
Three caveats keep ACR in proportion.
- Coverage varies by manufacturer, by the consent a viewer gave during setup, by the app in use, and by the measurement environment, so no two ACR footprints are alike.
- ACR observes a television, which is mapped to a household, and it says nothing directly about the people in front of it.
- And ACR is one input among several rather than a prerequisite; plenty of streaming measurement runs on app logs, panels, and platform data without it.
Panels and first-party streaming data
Panels and platform data are often described as competitors, but they solve different problems. A representative panel recruits households, records who lives there, and captures person-level viewing with known demographics. That is the only way to observe directly that a 34-year-old woman and a 9-year-old child watched the same ad together. What panels cannot do is scale to the long tail of streaming apps, devices, and content.
First-party streaming data is the inverse. A streaming service knows every account, profile, subscription tier, title, and ad exposure inside its own walls, at full census scale. What it does not know is who is holding the remote. A household that shares one login across four profiles may be one viewer or six, and the platform's logs cannot tell the difference. DASH exists precisely because device and account sharing breaks the assumption that one account equals one person.
Hybrid measurement combines the two.
- Nielsen's Big Data + Panel service, which the MRC accredited in January 2025 as the first MRC-accredited national TV service to blend big data with a panel, uses the panel to calibrate and project the device data.
- Comscore takes a big-data-first route and holds MRC accreditation for its household-level national and local TV ratings, including age and gender "households with" metrics, alongside full certification from the US Joint Industry Committee that extends to persons-based demographics.
In both cases the accreditation language is specific about which metrics and which units are covered.
Identity resolution and cross-device matching
Identity resolution is the set of methods used to connect viewing activity across screens, apps, and devices so that the same household or person is not counted several times. The raw material includes logged-in accounts, device identifiers, IP addresses, household graphs, first-party CRM data, partner data, and modeled connections.
The key distinction is between deterministic and probabilistic matching.
- A deterministic match links two events through a shared, verified identifier, such as the same authenticated account on a TV app and a phone app.
- A probabilistic match infers that two devices probably belong to the same household because they share a network, a location pattern, or behavioral signals.
Both are legitimate, and both are limited. Deterministic coverage is partial because most viewing is not authenticated in a way that spans platforms. Probabilistic links are estimates with error bars. Neither method proves that the same individual generated every matched event; at best they establish that the same household did.
ANA's Aquila service illustrates a modern architecture. It maps impression-level data from participating platforms onto a common identity layer calibrated against a Kantar Media panel, then produces deduplicated reach and frequency across channels. The identity layer is a model, the panel is the anchor, and the output is an estimate.
Co-viewing and person-level estimates
Television screens create a problem that phones do not. One device may represent one viewer, several viewers, or nobody actively watching, and a device log cannot distinguish among those cases. Co-viewing estimation is how measurement providers bridge the gap between a household-level signal and a person-level count.
The methods vary.
- Nielsen launched a co-viewing pilot during Super Bowl LX in February 2026 using wearable meters on panelists, and was explicit that pilot results were not currency; the enhancement was folded into its currency methodology for the 2026–27 season alongside revised universe estimates and household demographic modeling.
- Google estimates co-viewing on YouTube CTV through a combination of its own connected-TV panel and census-level surveys, then applies the result inside a reach model that varies by day, time, country, and demographics.
- Other providers apply panel-derived co-viewing factors by genre, daypart, and household composition.
Whatever the technique, the output is a modeled estimate rather than a directly observed count. A report that says "12 million viewers" should be able to show the household or device base it started from and the co-viewing method it applied to get there. Where a methodology has no supported route to person-level estimates, household, device, account, or profile counts should stay labeled as exactly that.
⚡ Streaming logs count screens with great precision. Counting the people in front of them is modeling, and every audience number inherits the assumptions of that model.
The OTT audience metrics marketers should understand
The OTT audience metrics that describe exposure and viewership form a short list, and each carries an interpretation caveat that is easy to lose in a dashboard. The table below sets them side by side.
The three groups below add the context that a table cannot.
Reach and unique audience
Audience reach estimates how many unique households, devices, accounts, or people were exposed to content or advertising within a defined period. The single most useful habit in reading a reach number is to find the unit. A platform reporting households reached is describing a different quantity from a provider reporting persons 18–49 reached, and a DSP reporting unique devices is describing a third. Treating any of these as "unique viewers" when the underlying methodology only supports devices or households inflates the audience and invalidates any comparison with a report that did the modeling properly.
Frequency and deduplicated reach
Audience frequency describes how many times the reached unit was exposed, either as an average or, more usefully, as a distribution showing how many households saw the ad once, three times, or fifteen times. Frequency is where audience deduplication earns its keep, because the same household routinely appears across several apps, publishers, devices, and campaigns, and a report that cannot recognize it will overstate reach and understate frequency at the same time.
Total reach counts everyone exposed across a set of channels; incremental reach isolates what one channel added beyond the rest. Both depend on the identity framework available to the provider, which is why deduplicated cross-platform figures differ so much between sources. Aquila's early beta work with Uber showed the pattern in practice: the brand's campaign was reaching a wider audience than planned at under half the intended frequency, a finding that only surfaces once exposures are deduplicated across platforms.
Viewership, watch time, and audience composition
Viewing duration, average audience, total watch time, and demographic composition add texture that raw impression counts lack, and they show whether the audience actually stayed with the content or the ad. Streaming viewership figures are also the metrics most prone to definitional drift. Content ratings, ad measurement, and platform analytics each define a "view" and a "minute" differently, and a share figure changes with its denominator. Nielsen's own reporting demonstrates this. In its Q2 2026 Ad Supported Gauge, streaming held 48.2% of ad-supported TV among Persons 2+ and 44.4% among Persons 18+, a 3.8-point gap produced entirely by narrowing the audience base, with no change in what anyone watched. Neither number is wrong. They answer different questions.
Platform-reported vs. independent OTT audience measurement
Every streaming platform reports its own audience figures, and those reports have real advantages. They are complete within the platform, fast, and built on log-level data that no outside party can match for granularity. A service knows every impression it delivered and every profile that received one.
The limitations appear at the platform's edge. First-party reporting cannot deduplicate against other platforms, cannot validate its own co-viewing assumptions independently, and defines its metrics on its own terms. Two platforms reporting "unique reach" may be using different identity systems, different measurement windows, and different audience universes, and nothing about the shared label guarantees a shared method. Independent and cross-platform CTV measurement exists to supply the comparison layer that platforms cannot.
"Independent" needs careful reading, though. Cross-platform measurement almost always incorporates publisher, platform, panel, or device data; independence describes who governs the methodology and validates the output, not the absence of platform-supplied inputs. Aquila is a clear example: it ingests impression-level data from Meta, YouTube, and linear TV in its first phase, with Amazon, TikTok, and iHeartRadio due in the second half of 2026, uses Comscore for linear and Samba TV for streaming data, and calibrates everything against a panel it controls. The platforms contribute data; the ANA subsidiary owns the method.
Accreditation and certification signal which methods have been audited, and they are worth checking rather than assuming. The MRC audits methodology against published standards; the JIC evaluates whether a currency is ready for transactions. Those statuses move. In July 2026, VideoAmp and Nielsen ONE both withdrew from the MRC accreditation process, while Comscore, iSpot, and Nielsen's Big Data + Panel currency hold accreditations of differing scope. A provider's status on the day a campaign is measured is the relevant fact, and it belongs in the report.
⚡ A metric label tells you what a provider intended to measure. Only the methodology tells you what it actually counted.
Why OTT audience numbers can differ
Two credible providers can measure the same campaign and report different reach, frequency, and composition without either being wrong. The differences trace to a handful of methodological choices.
Different data sources, coverage, and audience universes
Panel composition, device coverage, participating publishers, streaming-service integrations, geography, measurement windows, and data availability all change the population a provider actually observes or projects to. Universe estimates alone can move a headline figure. Nielsen adopted DASH-based universe estimates into its currency in early 2026, then deferred the corresponding Gauge recalibration to the fall after client pushback over the expected one-time reset in the linear-versus-streaming split.Nielsen's own Q2 2026 release carried the caution that reports not yet migrated to DASH-based estimates "will have different results" from its production data. Same viewing, same provider, different universe, different share.
Different identity, deduplication, and co-viewing methods
Providers also define the basic units differently. What counts as a household, a person, a device, a unique viewer, a duplicate exposure, or a co-viewer is a set of rules, and each rule produces a different reach and frequency from identical impression logs. Nielsen's methodology update for the 2026–27 season revised its household demographic assignment model, its integrated panel and big-data weighting, and its co-viewing approach all at once, which shows how many moving parts sit between a device signal and a demographic audience even within a single accredited service. Across providers, the variation multiplies.
Privacy, consent, and missing signals
Consent requirements, restricted identifiers, platform data controls, and incomplete interoperability all reduce the share of viewing any provider can see. The clearest recent example concerns ACR. After the Texas Attorney General sued five smart-TV manufacturers in December 2025 over ACR consent practices, Samsung agreed in February 2026 to halt ACR data collection from Texas consumers without express consent and to redesign its disclosure screens. Consent-dependent coverage means the ACR footprint can differ by state, by brand, and by firmware version, and any provider relying on it inherits those gaps.
Walled gardens add a second layer. The largest streaming platforms control how much impression-level data leaves their environments, and the terms differ between the walled gardens and the open internet. A "cookieless" or privacy-preserving measurement method does not, on its own, restore complete person-level visibility or remove the obligation to honor consent; it changes which signals are available and how they may be combined. Privacy and data-use rules are platform- and jurisdiction-specific, and they should be verified for each market a campaign runs in.
What OTT audience measurement can and cannot tell advertisers
Audience measurement answers exposure and viewership questions: who was reached, how often, on which screens, and in which environments. Those answers are essential for planning, frequency management, and evaluating whether a buy delivered the audience it promised. They do not, by themselves, establish that the advertising caused a sale, a sign-up, a lift in awareness, or any other business outcome.
Three neighboring disciplines pick up where audience measurement stops.
- Attribution connects exposure records to downstream outcomes, assigning credit along the path.
- Incrementality estimates the additional outcomes that advertising caused, usually through holdouts or geo experiments that isolate the effect from what would have happened anyway.
- Marketing mix modeling works at the aggregate level, relating spend across channels to outcomes over time.
Each of these depends on sound audience measurement as an input, and none replaces it.
How to evaluate OTT audience measurement data
A platform or provider report becomes far more useful once a few questions have been asked of it. The checklist below covers the ones that most often explain a discrepancy.
Once the answers are in hand, the most reliable practice is to document material methodology differences and report numbers side by side with their caveats, rather than forcing incompatible platform figures into one direct comparison. A reconciled number that hides its assumptions is less useful than two honest ones.
⚡ The most precise-looking audience figure is often the one with the most undocumented assumptions behind it.
How AI Digital helps connect streaming measurement data
Audience measurement providers produce the currency-grade estimates; the work of relating those estimates to the rest of a campaign happens in the reporting layer. AI Digital's Elevate, a marketing intelligence platform, supports that workflow by centralizing core metrics across more than a dozen integrated DSPs, search, and social in one reporting environment, so that streaming delivery data can be read alongside every other channel a campaign runs in. Its Path to Conversion capability maps cross-screen journeys and touchpoints ahead of a conversion, and its marketing mix modeling relates cross-channel investment to outcomes at the aggregate level.
Elevate is a reporting and intelligence layer rather than a television audience currency. It does not independently determine how many people sat in front of a television, identify individual OTT viewers deterministically, or stand in for specialized audience-measurement providers. What it does is connect their outputs with delivery, performance, and outcome data so that a streaming line item can be evaluated with the same rigor as the rest of the plan.
Build a clearer view of streaming audiences
OTT measurement becomes more precise when marketers understand four things about every number they receive: what each data source actually observes, which audience unit is being reported, where modeling enters the calculation, and how duplication and co-viewing are handled. Methodological transparency and consistent definitions do more for decision quality than any single apparently exact audience figure presented without context. To discuss how streaming measurement fits into a cross-channel reporting workflow, get in touch with AI Digital.