Marketing ROI optimization: how to increase campaign profitability


Almost every marketing team can calculate return on investment. Far fewer can improve it deliberately, repeatedly, and in a way that survives contact with a CFO. Marketing ROI optimization is the difference between the two—the ongoing work of finding where money leaks out of a media plan and redirecting it toward the activity that genuinely moves the business.
TL;DR
The short version, for anyone who wants the argument before the detail:
- Calculating ROI is not optimizing it. Reporting tells you what a campaign returned; optimization tells you where the next dollar should go instead.
- Find the leaks first. Walled garden overclaim, low-quality inventory, uncoordinated frequency and disconnected reporting drain return before any tactic is applied.
- Validate before you scale. Incrementality testing establishes which spend causes outcomes and which merely accompanies them. Platform-reported performance cannot answer that question.
- Reallocate rather than cut. Reduction lowers cost and revenue together; moving money toward validated impact lowers only one of them.
- Media and creative quality decide what your budget buys. Both are optimization levers, and both are routinely treated as fixed inputs.
- Pair business metrics with campaign metrics. Weekly numbers tell you what to adjust; lifetime value, margin and retention tell you whether the adjustments were worth making.
- Benchmark against yourself. There is no credible universal "good" marketing ROI—margin, lifetime value and business objective set the threshold.
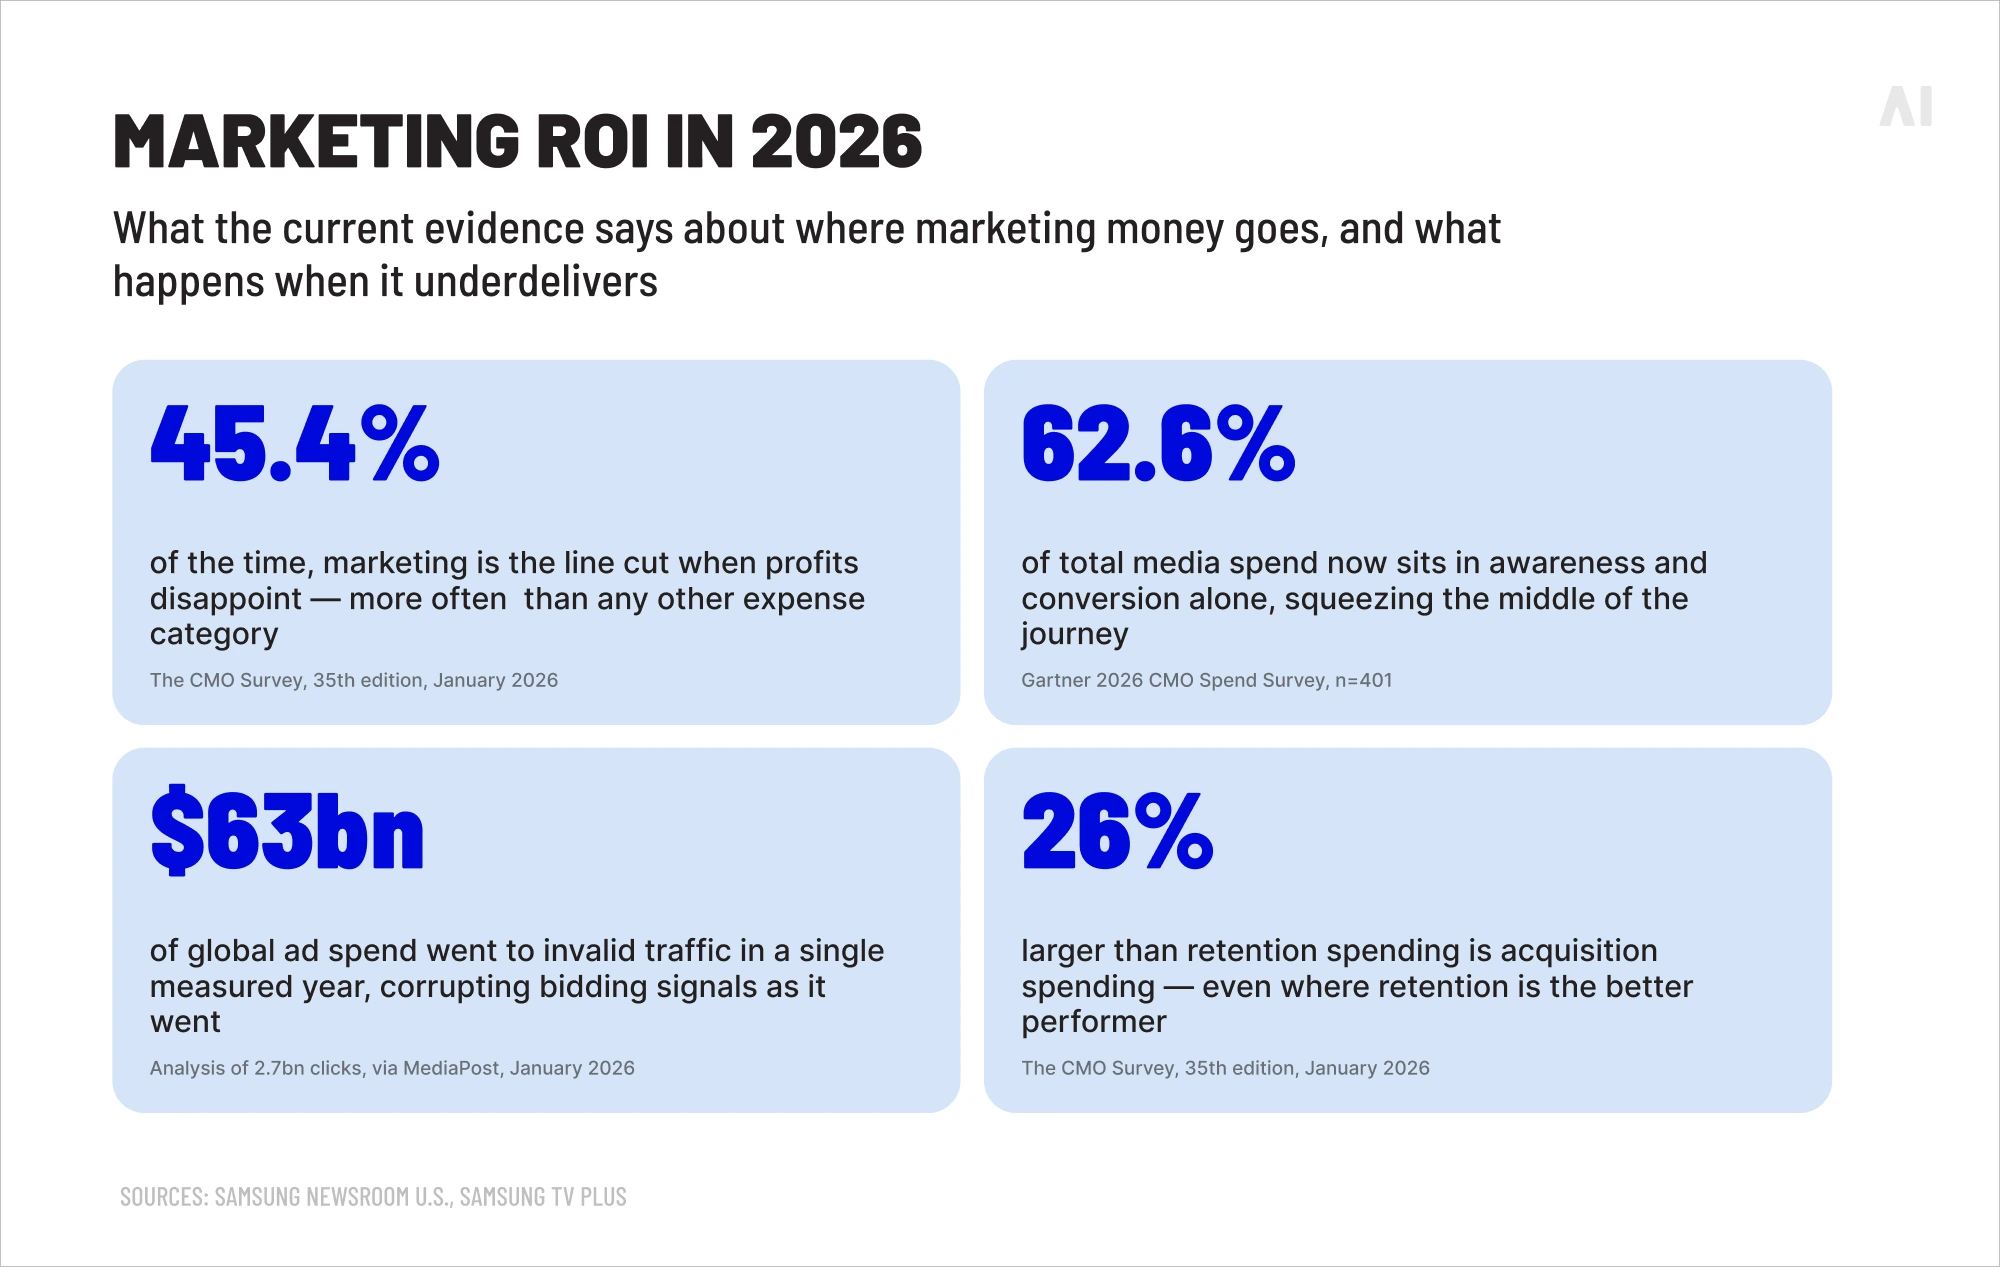
There is a well-evidenced penalty for leaving that work undone. According to The CMO Survey, the 35th edition of which was fielded in January 2026 among 308 US marketing leaders, 53.1% of company executives respond to disappointing profits by cutting expenses rather than investing in growth—up from 46% a year earlier. When that happens, marketing is the line cut 45.4% of the time, more often than any other category. The alternative to optimizing your budget is watching someone else reduce it.
What follows covers where marketing ROI is lost, how to build a framework for deciding where to act, and six practical ways to increase marketing ROI.
💡 If you need the underlying arithmetic first, start with How to Calculate Marketing ROI (Formula + Examples) and come back.
What is marketing ROI optimization?
Marketing ROI optimization is the continuous process of improving marketing profitability—not the act of calculating a return once a campaign has finished. Calculation produces a number; optimization produces a decision.
Anyone working out how to improve ROI in digital marketing runs into that distinction fast, and its consequences are practical rather than semantic.
- Calculate quarterly and you learn in April that something went wrong in February, by which point the money has gone.
- Optimize and you are running a standing cycle: measure, find the weakest-performing spend, check whether the alternative is genuinely better, move the money, measure again.
None of that works without three things in place—
- measurement trustworthy enough to act on, which means independent of the platforms being graded;
- testing routine enough that reallocation rests on evidence rather than instinct; and
- investment decisions tied to profit, retention and lifetime value rather than to campaign metrics that can improve while the business stands still.
ROI optimization vs ROI measurement
Measurement looks backward. It reconciles what was spent against what was returned, and it answers a question that has already been settled by events.
Optimization, by contrast, treats last quarter's performance data as an input to next quarter's allocation and asks something more useful: given what we now know, where should the next dollar go?
- Reporting ROI tells you a campaign delivered 3:1.
- Optimizing ROI tells you the same money placed elsewhere would have delivered 4:1, and hands you the evidence to argue for the move.
You can usually tell which mode a team is in by watching it at planning time.
- Measurement-only teams turn up to defend a budget.
- Optimizing teams turn up with a redistribution already argued and evidenced, which is a considerably stronger place to be standing.
What is a good marketing ROI?
There is no universal benchmark, and any article offering one should be treated with suspicion.
- A 3:1 return might be excellent for a business running 60% gross margins and disastrous for one running 12%.
- A subscription company with high lifetime value can rationally accept a first-purchase return below 1:1, because the payback arrives in months two through thirty.
- A mature brand defending share in a saturated category faces a different marginal-return curve than a challenger buying its first awareness at scale, which is why digital marketing ROI has to be read against context rather than a table.
Evaluate your own return against five things instead of an industry average:
- Gross margin—the return required to generate profit, not just revenue
- Customer lifetime value—whether the return compounds after the first transaction
- Acquisition cost trajectory—whether efficiency is improving or decaying as you scale
- Business objective—profitability, acquisition, retention, or share growth demand different thresholds
- Market maturity—the cost of incremental reach rises steeply once penetration is high
Published "average ROI by industry" tables mostly aggregate self-reported figures across businesses with incompatible economics. As conversation openers they are fine. As decision inputs they are close to worthless, and the honest benchmark remains your own performance last quarter.
Where marketing ROI is lost
Before optimization can add anything, it helps to know what is already draining away. Bad campaigns account for less of the damage than most teams assume. The larger drain comes from structural conditions that make good campaigns look better or worse than they really are, in ways invisible from inside a platform dashboard.
Four of those conditions do most of the harm, each with its own cause, symptom and remedy, and each detectable only through independent marketing measurement—because none of them appears in the reporting of the platform responsible for it.
{{mroio-1}}
Walled garden bias
Advertising platforms measure their own contribution, using their own methodology, on their own data. They are not lying. They are marking their own homework, and the grading is generous by design.
Follow a single customer through the plan. She sees a video ad, then a social ad, then a retargeted display unit, then searches for the brand—and every platform involved counts the sale, because each counts any conversion its ad touched inside a lookback window it sets for itself. Four platforms, four claimed conversions, one purchase. Sum the reported returns across a media plan and the total will always overshoot the revenue the business recorded, often by a wide margin.
Two expensive things follow. Budget drifts toward whichever platform reports most aggressively rather than whichever contributes most, and genuinely incremental work—particularly upper-funnel activity whose effect surfaces later and elsewhere—looks feeble by comparison and gets defunded.
⚡ Sum the returns your platforms report and you will always exceed the revenue your business booked. The overclaim is not a rounding error—it is a budget allocation instruction.
What fixes this is measurement with no commercial stake in the answer, which is the argument behind alternatives to walled garden advertising. Closed platforms are not the problem in themselves. Accepting a performance grade from the party being graded is.
Poor media quality
A campaign can hit every delivery target and still buy almost nothing of value. Impressions were served, viewability was respectable, the dashboard is green—and the business saw no lift.
Averages conceal this, because quality problems cluster rather than spread. The 21st edition of the IAS Media Quality Report, published in July 2026 and built on more than 300 billion daily digital interactions, found that mobile web display accounts for roughly 45% of measured open-web impressions but produces around 72% of made-for-advertising impressions and 55% of brand suitability failures. Non-optimized connected TV inventory ran 9.1% invalid traffic.
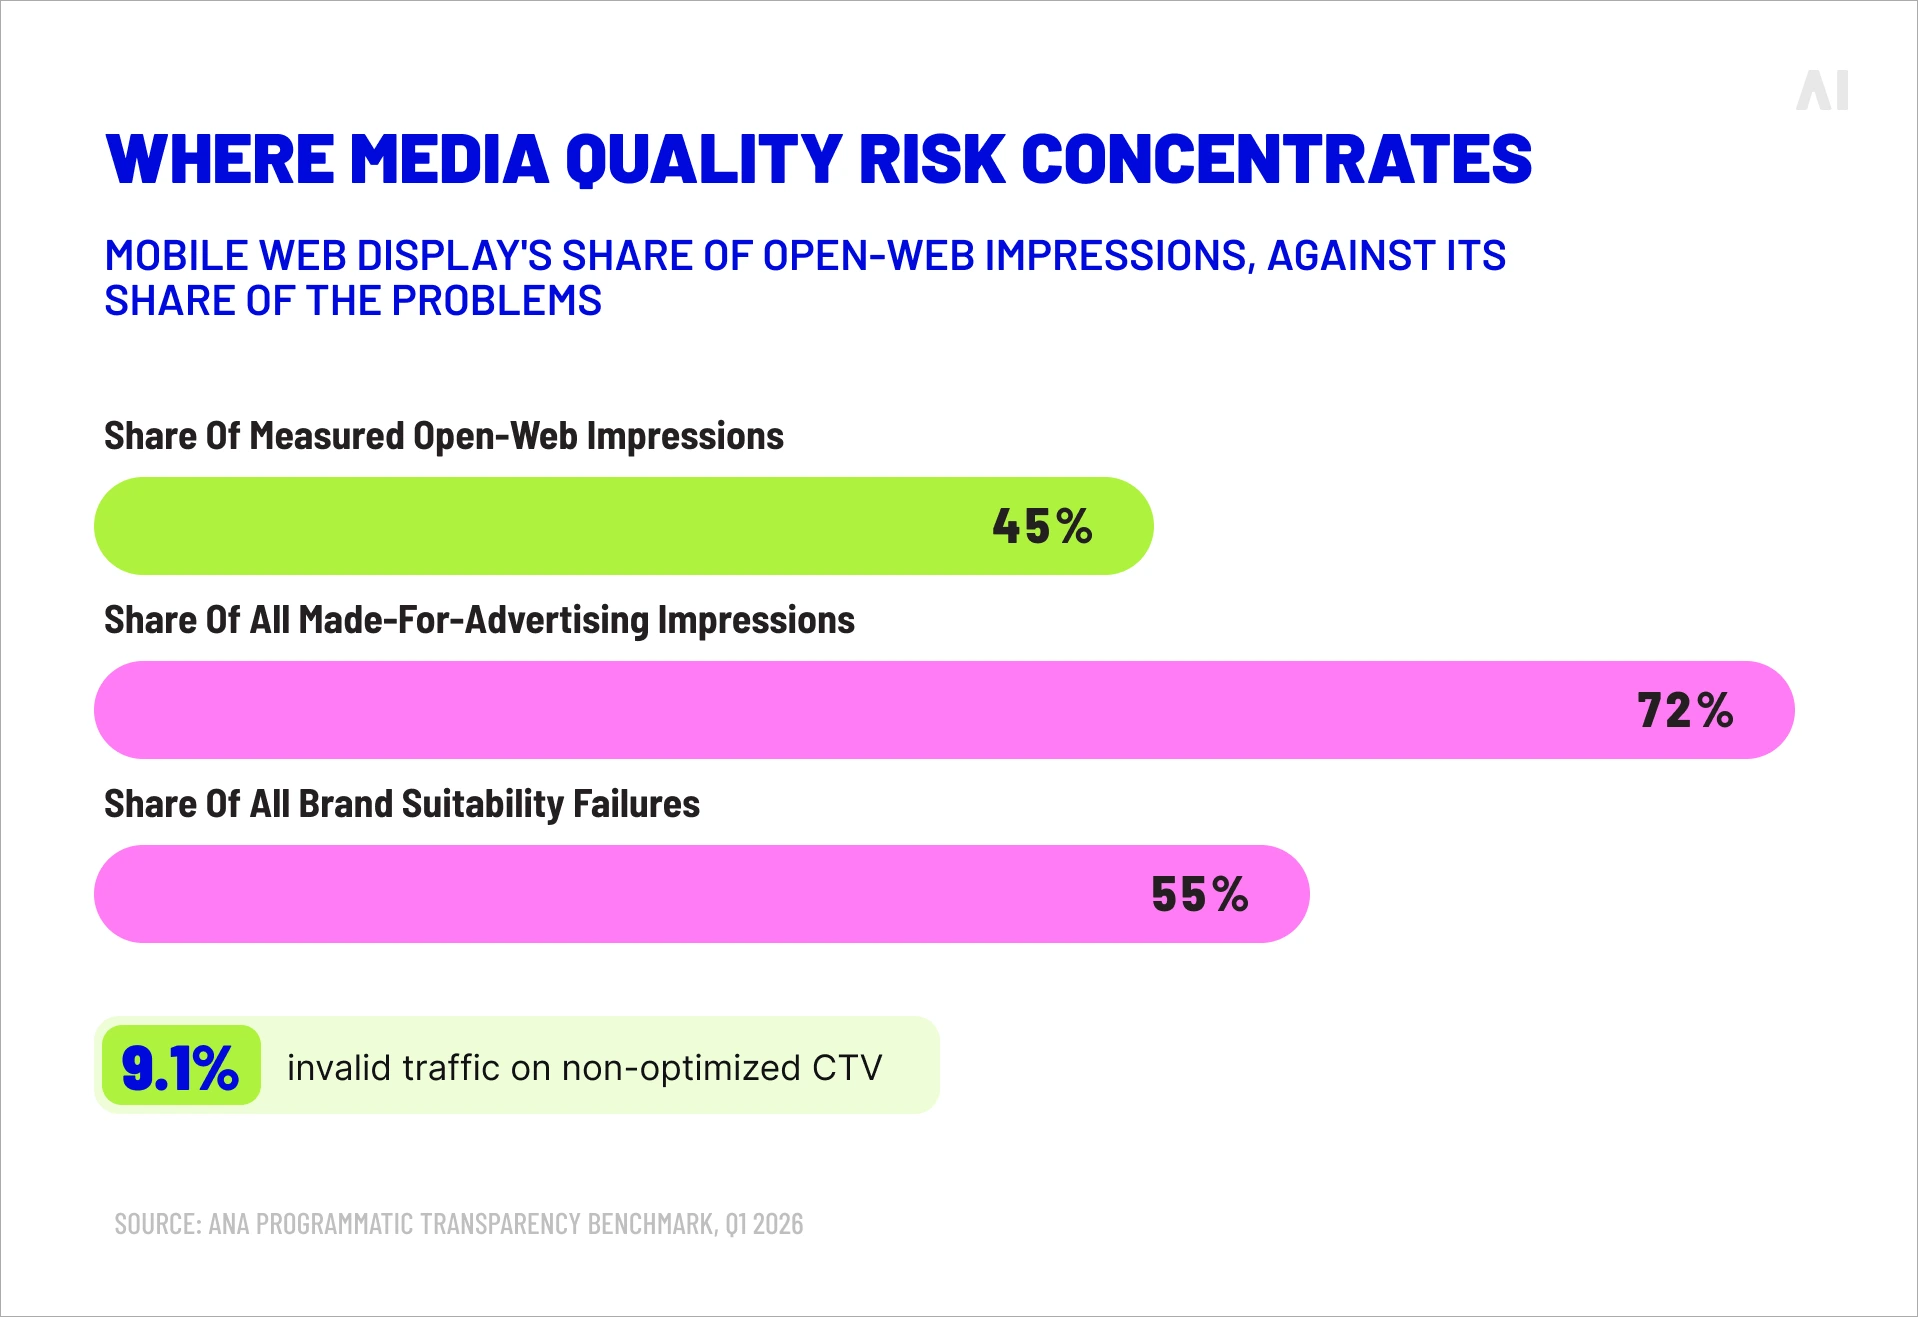
Behind those numbers sit made-for-advertising sites built to arbitrage cheap traffic into ad revenue, stacking slots around content nobody went looking for; supply paths long enough that intermediaries take a margin at every hop; and placements where the impression is technically valid and nobody registers it.
How do you spot the pattern? Watch for a persistent gap between campaign metrics and business metrics. Delivery holds up, engagement looks acceptable, revenue refuses to respond. When that repeats across several flights, the inventory is usually the culprit rather than the creative or the audience. Supply path optimization is the discipline that addresses it—covered as an execution question later in this article.
Audience overlap
Frequency capping works within a platform. It does not work between platforms, because no platform can see the exposures its competitors delivered.
Picture three channels, each applying a sensible cap of four impressions per user per week. Anyone sitting in all three audiences takes twelve. Each platform's report shows disciplined frequency management; the customer experiences saturation; the advertiser pays three times over for one relationship.
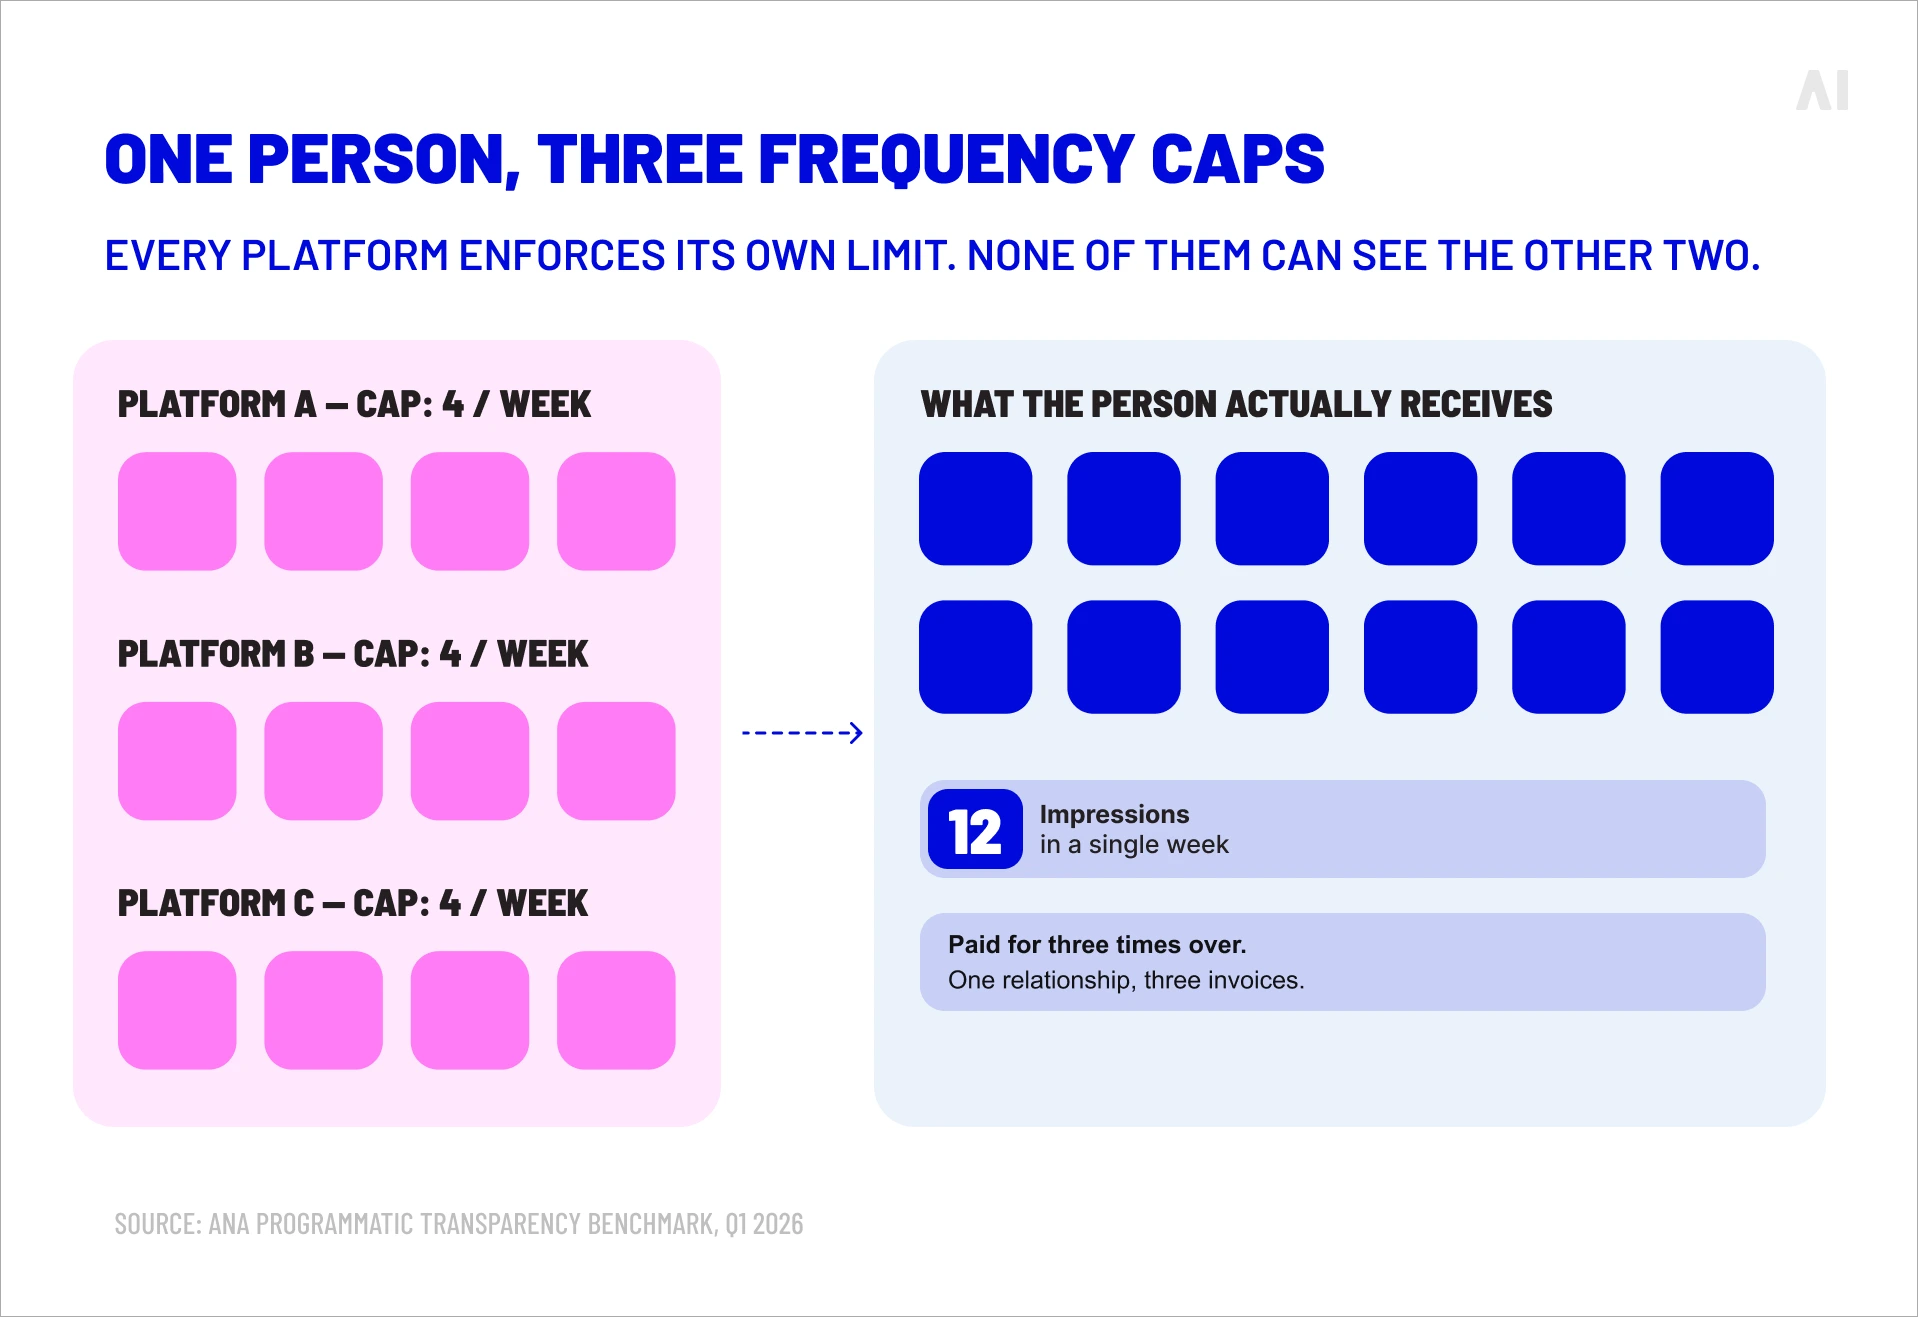
The cost of that climbs with the budget, since the incremental audience thins while the duplicated core stays exactly where it was. Cost per incremental customer rises even as cost per impression holds steady—easy to misread as market exhaustion when the real cause is a coordination failure. Only deduplicated reach and frequency analysis across the whole plan separates useful repetition from paid-for redundancy.
Cross-channel blind spots
Isolated reporting erases the customer journey. Left behind is a set of partial accounts that will not reconcile, and a budget allocated to whichever touchpoint happened to sit closest to the conversion.
At portfolio level that bias carries a measurable cost. Gartner's 2026 CMO Spend Survey, conducted between January and March 2026 among 401 marketing leaders, found that awareness and conversion together now absorb 62.6% of total media spend. Gartner's Ewan McIntyre cautioned that CMOs should guard against letting AI steer budget toward the stages of the journey that are easiest to tune, while under-investing in the touchpoints that build long-term customer value.
Correcting it takes unified measurement, which in practice means a deliberate combination rather than one tool claiming omniscience: cross-channel attribution for the journey, incrementality testing for causal proof, and modeling for the allocation horizons no tracking window reaches.
Build your marketing ROI optimization strategy
Start with campaigns and optimization goes wrong early. Teams cut bids, pause the underperformers, rewrite headlines—and improve metrics that were never attached to profit in the first place.
The decision framework comes first. Before anything gets adjusted, four questions want answers:
- what business outcome are we buying,
- how will we know whether we bought it,
- which opportunity offers the largest improvement for the effort, and
- what will we measure to confirm it worked.
Working through those in order avoids the most common failure in this discipline, which is optimizing efficiently toward the wrong objective.
💡 AI Digital has written at length on the challenges of measuring marketing effectiveness and on building a marketing measurement framework that can support these decisions.
{{mroio-2}}
Align optimization with business goals
Campaign metrics are a means to business outcomes, and optimization that never travels from one to the other produces beautifully efficient campaigns bolted to a stagnant P&L.
Priorities are moving. The IAB 2026 Outlook Study, based on responses from more than 200 US brands and agency buyers, found that customer acquisition remains the leading objective at 54% but has fallen ten points year over year, while focus on driving repeat purchases has climbed to 25%—close to double the 13% recorded in 2024. Rising acquisition costs and maturing first-party data are pushing advertisers toward outcomes that compound.
Where the objective lands changes what optimization should chase. Aim at retention and cost per acquisition becomes a poor guide while lifetime value becomes a reliable one. Aim at margin and cutting revenue can be the right call, provided cost falls faster. Set the objective first and let the metrics follow.
Validate business impact
Before increasing investment in anything, establish that it produces incremental value—customers, revenue or profit that would not have arrived anyway.
Incrementality testing answers that question by comparison rather than correlation. A holdout group is withheld from exposure; the difference in outcome between exposed and unexposed populations is the lift the advertising actually caused. Geo-based designs apply the same logic at market level, which suits channels where individual-level splitting is impractical.
Incrementality testing in marketing works best as a decision gate rather than a tactic—its job is to earn a campaign the right to scale, not to tune one already running.
- Channels that pass deserve more budget with confidence.
- Channels that fail deserve less, however flattering their own reporting looks, and branded search is very often where that argument first turns uncomfortable.
Plan budget allocation strategically
Incrementality testing answers questions about specific channels over specific windows. It cannot answer the annual planning question: given a fixed total, how should money be distributed across everything?
Marketing mix modeling (MMM) exists for exactly that question. By analyzing aggregated historical performance against spend, pricing, seasonality and external conditions, it estimates each channel's contribution to business outcomes and models what happens at different investment levels. Its value lies less in the historical accounting than in the response curves—the point at which additional spend in a channel stops earning its cost.
Its natural home is the planning horizon. Models refresh quarterly at best, which makes them the wrong instrument for a Tuesday afternoon bidding decision and the right one for setting next year's envelope. Calibrating against incrementality results keeps them honest.
⚡ Validation should come before scale. A channel that cannot demonstrate incremental value has not earned more budget, however good its own reporting looks.
Prioritize optimization opportunities
Analytical capacity is finite, so ranking opportunities by potential impact is itself an optimization decision—and not every available improvement earns the attention it asks for.
A repeatable four-step loop keeps that ranking disciplined:
- Review performance against business outcomes rather than campaign metrics, at a fixed cadence
- Identify the gap between current and achievable performance, sized in revenue or margin
- Prioritize by expected impact weighed against implementation effort and time to result
- Validate the change with a test designed before implementation, not reconstructed afterward
Its virtue is that it is boring. Teams running the loop monthly accumulate a body of evidence about what genuinely improves their business, and across a year that is worth considerably more than any single clever intervention.
6 practical ways to increase ROI marketing
A framework earns nothing until somebody executes against it. To increase ROI, marketing teams need moves available this quarter rather than a model of the ideal state. The six areas below convert the strategy above into work that can start now, along with the categories of technology that support each one.
⚡ AI Digital's guide to AI in programmatic advertising covers the automation layer underpinning several of them.
1. Reallocate budget smarter
Average return is the number most reallocation decisions rest on, and it is the wrong one. What should govern the next dollar is marginal return—what that specific dollar earns at current spend levels, on a curve that flattens as saturation approaches.
In practice:
- establish incremental value by channel,
- model marginal return at current investment,
- move budget from channels near saturation toward channels still climbing, then
- re-measure, because the curve moves as you move along it.
All of which depends on having cross-channel data in one place. Analytics platforms such as Google Analytics 4, Looker Studio and Adobe Customer Journey Analytics unify reporting across owned and paid touchpoints. Sitting above that reporting layer, a marketing intelligence platform supports the decision itself.
AI Digital's Elevate is vendor- and DSP-agnostic by design, working across 12 or more DSPs to support research, planning, optimization and reporting—with modules covering media mix modeling, path to conversion and AI-assisted planning. It does not bid, serve ads or build creative; it informs the decisions that govern all three.
2. Improve audience targeting
Better targeting usually returns more than better bidding, and unlike bidding gains it compounds.
Suppression is the fastest win in most accounts: existing customers, recent converters and disqualified prospects have no business receiving prospecting budget. After that, segment by value rather than volume—a smaller audience with strong lifetime value characteristics will beat a larger one picked for reach. First-party data makes both possible; behavioral signals sharpen them.
Tools supporting this include Google Ads Audience Manager, Meta Advantage+ and Salesforce Data Cloud for customer data unification, alongside programmatic targeting approaches that extend value-based segmentation across the open internet. Personalization built on those segments raises conversion rates without raising spend.
3. Optimize conversion paths
Media optimization improves the traffic arriving at your site; conversion rate optimization improves what happens once it lands, and the second is frequently the cheaper of the two.
Raising conversion rate from 2% to 2.4% does the same work as a 20% increase in traffic, at a fraction of the cost, and the gain applies across every channel at once rather than one at a time.
Four areas produce most of the available improvement:
- Page speed, particularly on mobile, where abandonment rises sharply with load time
- Message match between the ad that generated the click and the page that receives it
- Form friction, where each additional field reduces completion
- Trust signals at the point of decision—pricing clarity, proof, return terms
Experimentation platforms including Optimizely and VWO run the tests; behavioral tools such as Hotjar identify where visitors hesitate or leave. Test one variable at a time, size the sample properly before launching, and resist calling a result early.
4. Invest in higher-quality media
Long before it becomes a brand safety question, media quality is a return question. Budget spent on inventory that never reaches an attentive person has left the campaign, whatever the delivery report says.
- Filter made-for-advertising inventory at pre-bid rather than reporting on it afterward.
- Shorten supply paths so fewer intermediaries take a margin between advertiser and publisher.
- Prioritize environments where attention runs structurally higher—premium video and connected TV beat mobile web display on most quality measures.
AI Digital's Smart Supply supports the first two directly. It is a supply selection and optimization tool rather than a media vendor, working across nine or more SSPs and inventory-agnostic across display, streaming video, CTV and streaming audio, with custom deal IDs built per inventory type and outcome. It carries no minimum spend, and deal IDs are issued within 24 hours.
The Open Garden Framework provides the surrounding architecture—DSP-agnostic activation across 15 or more DSPs, built on transparency, customization and efficiency.
5. Eliminate ad waste
Invalid traffic charges you twice—once for impressions no human saw, and again through the false signals it feeds into the systems deciding where the rest of the budget goes.
The sums involved are not marginal. Analysis of 2.7 billion clicks across six major ad platforms, eight industries and ten countries, reported by MediaPost in January 2026, put global spend lost to invalid traffic at $63 billion over the measured year. The second-order damage is arguably worse, since automated bidding trained on fraudulent conversions learns to buy more of the same.
Verification vendors including DoubleVerify, Integral Ad Science, HUMAN Security and Pixalate provide pre-bid filtering and post-campaign auditing.
💡 Connected TV deserves particular attention here, since its measurement standards are younger than display's and its fraud patterns differ—a subject covered in AI Digital's guide to CTV ad fraud.
6. Automate continuous optimization
At modern campaign scale, manual optimization stopped being possible some time ago. Automated bidding responds to auction conditions continuously, budget pacing follows demand, predictive models allocate toward forecast performance, and creative testing runs far more variants than any rotation schedule managed by hand.
AI Creative Studio covers the creative half of that automation: original assets produced through AI-native workflows with human creative oversight, one concept adapted across formats, placements and audiences, and AI-powered testing that identifies the strongest asset before launch rather than after. Adobe GenStudio occupies similar ground in production, while Google Ads Smart Bidding and Meta Advantage+ automate the media side.
A caution, though. Automation reduces manual effort without reducing the need for people who can judge whether the machine is optimizing toward anything worth having. Gartner's 2026 data bears that out: labor's share of the total marketing budget rose from 21.9% in 2025 to 24.5% in 2026, which suggests that extracting value from AI depends on skills and process rather than on the software alone.
⚡ Automation reduces manual effort. It does not reduce the need for someone who can tell whether the machine is optimizing toward anything worth having.
Increase ROI across marketing channels
Each channel offers a different opportunity, carries a different risk and poses a different measurement problem, so running one playbook across all of them wastes effort on the wrong levers.
The weighting has moved, too. Per the IAB's 2026 Outlook Study, digital video and connected TV together now hold the largest share of US ad spend at 23%, ahead of social media at 18.4%, paid search at 16.2%, digital display at 11.2% and linear television at 11.1%.
{{mroio-3}}
Connected TV rewards attention here because it combines television's environment with digital's targeting while its measurement conventions are still settling.
💡 AI Digital covers the practical side in its guides to CTV media buying and CTV advertising examples.
Right metrics to optimize marketing ROI
Two sets of numbers are needed here.
- Campaign metrics move quickly and tell you what to adjust;
- Business metrics move slowly and tell you whether the adjustments produced anything the company values.
Report only the campaign set and marketing arguments tend to collapse in front of finance—where the gap is itself measurable. The CMO Survey scores the partnership between marketing leaders and CFOs at just 4.8 on a seven-point scale for growth planning, and on building the business case for marketing spending it has moved only from 4.3 to 4.5 across four years. Leading with metrics the finance function already recognizes is the cheapest available fix.
{{mroio-4}}
Neither set works alone. Engagement and conversion rate move within days and give early warning; lifetime value and retention confirm months later whether those early signals meant anything.
💡 For a fuller treatment of the campaign side, see AI Digital's guide to digital marketing KPIs; the formulas themselves are covered in How to Calculate Marketing ROI (Formula + Examples).
Marketing ROI optimization examples
Real decisions make principles legible. Each example below opens on a documented case, then walks through the mechanics illustratively—the figures inside those walkthroughs are worked illustrations, not reported results.
💡 AI Digital's comparison of AI marketing platforms and traditional martech stacks covers the technology decisions underneath them.
SaaS
The CMO Survey surfaces a contradiction that describes most subscription businesses accurately: acquisition spending now runs 26% larger than retention spending and continues to grow, even though the same survey's performance data shows retention outperforming acquisition. Nearly half of marketers name loyalty and retention as their primary response to economic uncertainty. Their budgets say otherwise.
Correcting it begins with segmenting return by cohort quality rather than volume. Take a business acquiring 1,000 customers monthly at $400 blended CAC, which discovers that one channel delivers 30% of volume at $250 but produces customers who churn inside four months, while another delivers 15% of volume at $600 with three-year retention. Judged on CAC, the first channel wins. Judged on LTV:CAC, it destroys value. Moving budget toward the expensive channel raises reported acquisition cost and improves the business.
Ecommerce
Procter & Gamble, the world's largest advertiser, offers a public illustration of the reinvestment principle. On its second-quarter fiscal 2026 earnings call in January 2026, the company reported productivity gains of 270 basis points that were almost entirely reinvested in innovation, demand creation and commercial support rather than taken to the bottom line. Efficiency was treated as a source of funding, not as a saving.
At ecommerce scale the sequence runs the same way: recover budget from low-quality inventory and duplicated reach, then redeploy it toward higher-value shoppers and better creative rather than banking it. Say an advertiser finds 12% of programmatic spend on MFA domains, plus a further slice lost to cross-platform duplication. Reallocating that recovered budget toward value-based audiences and an expanded creative testing program raises revenue at unchanged total spend—which is what increasing marketing ROI looks like in practice.
B2B
Long cycles and multiple stakeholders make B2B the hardest environment for conventional attribution, and the easiest place to optimize toward lead volume that never converts.
Forrester's 2026 B2B Return on Integration Honors, announced in April 2026, recognized Amazon Ads, Rockwell Automation and ServiceNow for alignment across marketing, revenue, customer success and product. Among the Programs of the Year winners, IBM was recognized for moving marketing planning from activity-centric decision-making to an audience-centric go-to-market approach, realigning investment behind revenue contribution and efficiency. ServiceNow's Marc Monday described the outcome of its own partner marketing program as "clearer attribution and ROI from opportunity to revenue."
From there the mechanics follow: optimize toward qualified pipeline and closed revenue rather than form fills, measure across the full cycle rather than the reporting window, and connect marketing data to CRM outcomes so the channel producing the cheapest leads can be told apart from the one producing the best.
Marketing ROI mistakes to avoid
Each of the errors below began life as a reasonable instinct and got applied too broadly. All seven are common enough to be worth naming outright.
The seven that cost most:
- Trusting last-touch ROAS. It credits the final click and ignores everything that created the demand.
- Optimizing short-term return at the expense of growth. Harvesting existing demand looks efficient until the demand runs out.
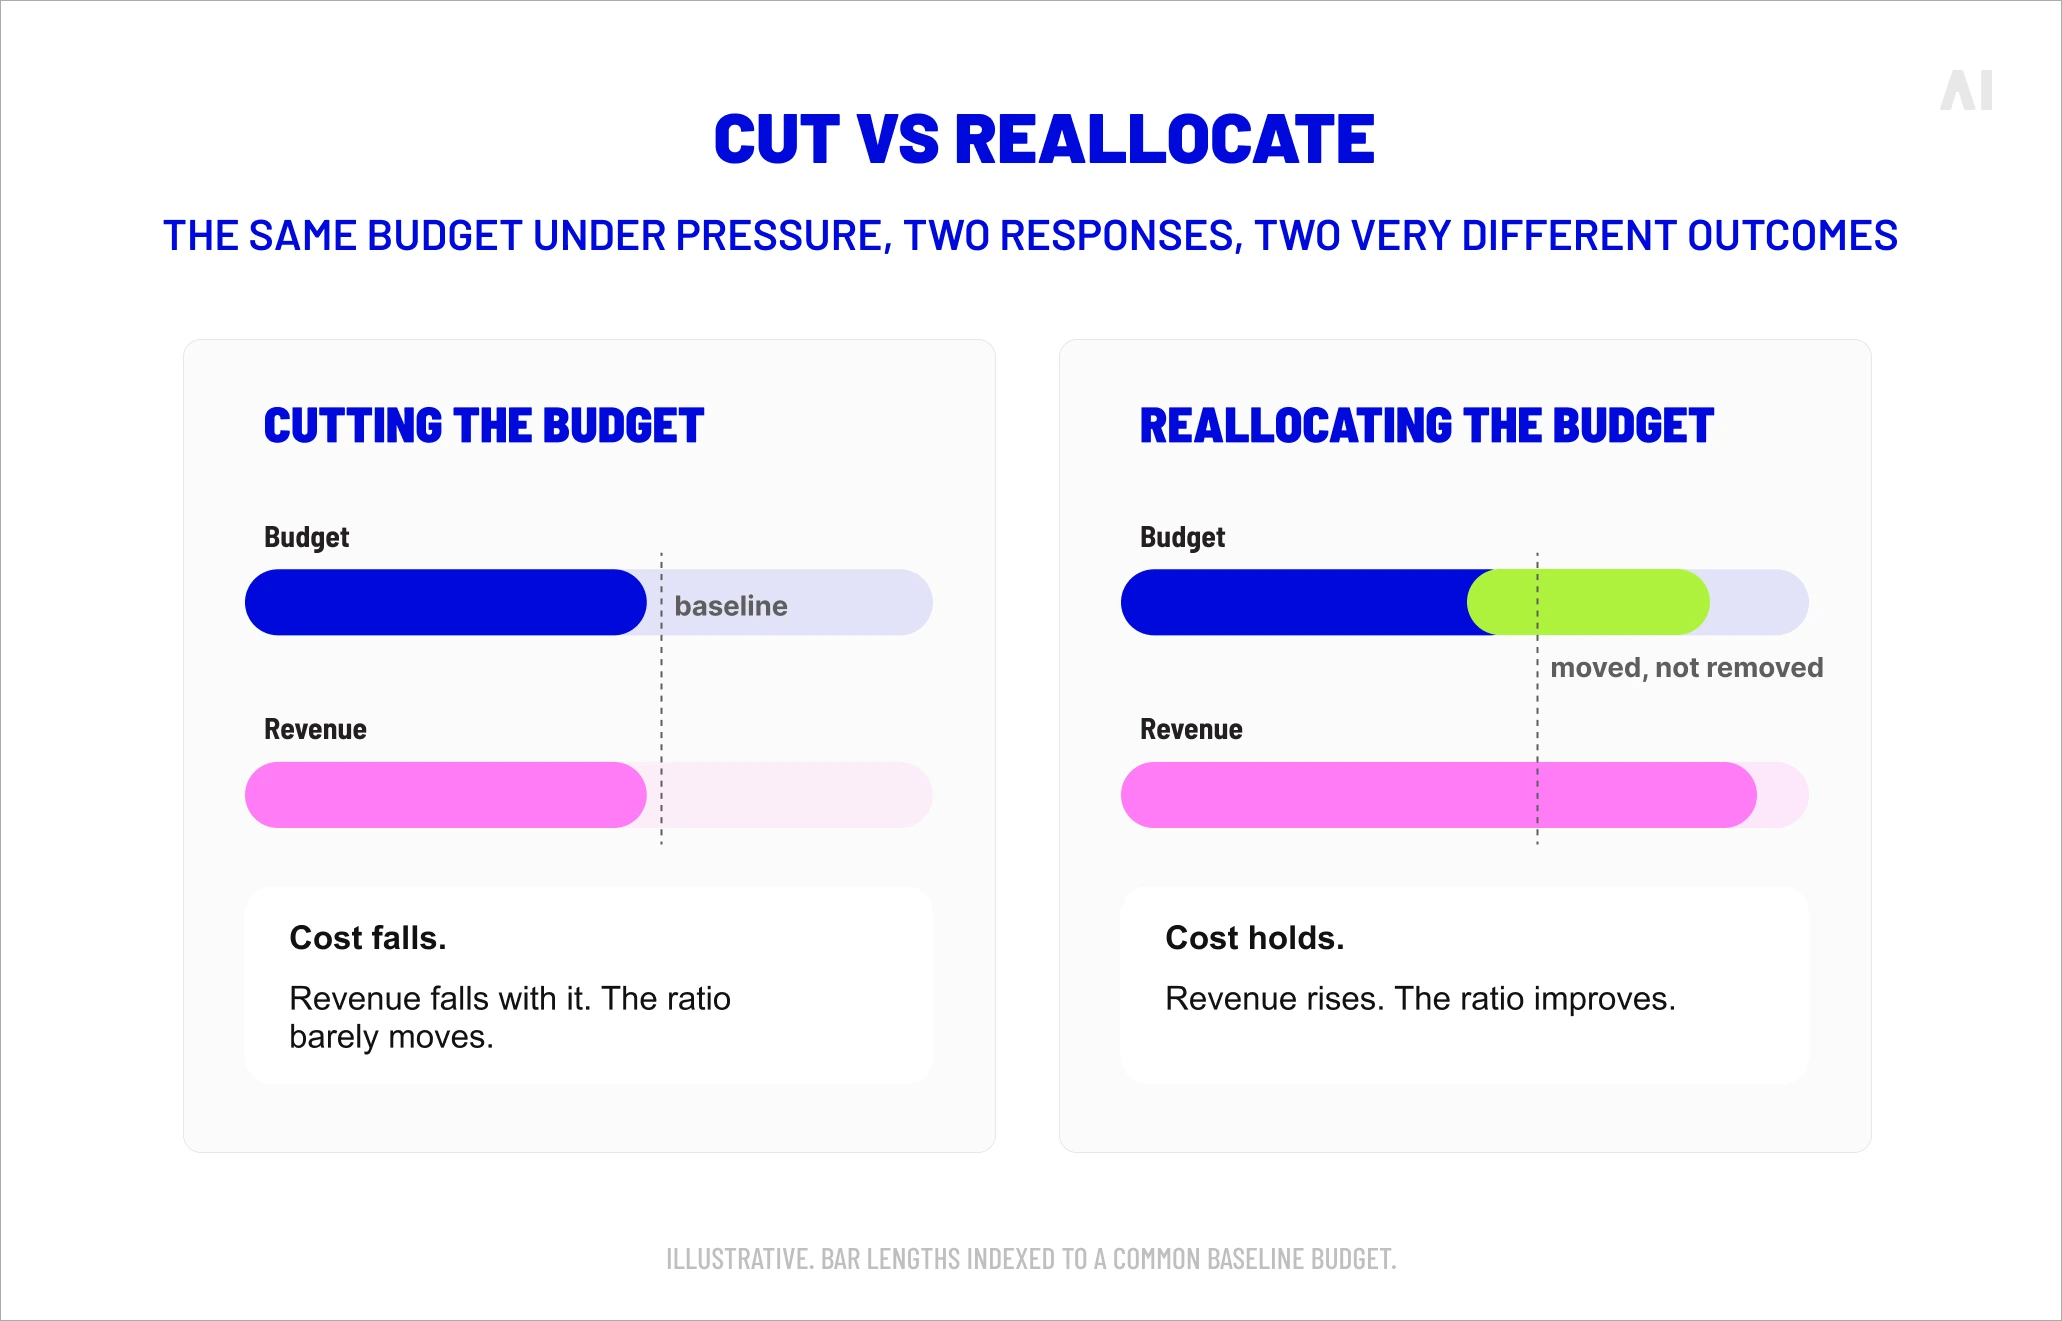
- Cutting budget instead of reallocating it. Reduction lowers cost and revenue together; reallocation lowers only one.
- Treating creative as a fixed asset. Performance decays with exposure, and creative decay is regularly misdiagnosed as audience fatigue.
- Ignoring media quality. Delivery metrics can look healthy while a meaningful share of spend reaches nobody worth reaching.
- Relying on one attribution model. Every model encodes assumptions; agreement across methods is the only real evidence.
- Making annual decisions on weekly data. Campaign reporting cannot answer allocation questions that span quarters.
Running underneath all of them is the same confusion between precision and accuracy. A dashboard reporting to two decimal places is no more truthful than a model with error bars—only more confident, and confidence is the cheapest commodity in marketing measurement.
⚡ Reduction lowers cost and revenue together. Reallocation lowers only one of them. Most budgets are cut when they should have been moved.
Achieve marketing growth through ROI optimization
No single campaign delivers sustainable growth. It comes from a standing practice: measuring independently, testing before scaling, moving budget toward validated impact, and judging the result against business outcomes rather than platform reporting.
Four principles are worth carrying out of this article, all of them simple to state and demanding to maintain.
- Find the leaks before optimizing anything.
- Validate incremental value before increasing investment.
- Improve the quality of both media and creative, since between them they determine what your budget actually buys.
- And measure across horizons long enough to catch the effects that campaign windows miss.
AI Digital works with advertisers on exactly this problem—DSP-agnostic planning and measurement through Elevate, supply selection and optimization through Smart Supply, and cross-platform activation through the Open Garden Framework. If you would like to discuss where your own return is being lost, get in touch.