Marketing Measurement Framework: Building a Scalable System for Smarter Decisions
Sarah Moss
July 1, 2026
16
minutes read
Marketing is the last major business function that still arrives at the quarterly review with three competing accounts of what just happened — one from the platforms, one from the attribution tool, and one from whichever analytical model the team currently trusts. This article sets out what a scalable marketing measurement framework looks like, how its layers fit together, and why the architecture has become operational infrastructure CMOs now depend on to forecast, allocate, and defend their work to the rest of the C-suite.
Three things have happened to marketing measurement in the past five years that, taken together, explain why the discipline now needs explicit infrastructure rather than working notes and a quarterly econometrics study. The number of channels marketers run multiplied past the point any single attribution model was built to absorb. Privacy regulation, browser changes, and the slow collapse of the third-party cookie thinned out the signal traditional tracking depended on. And the analytical methods themselves — attribution, marketing mix modeling, incrementality testing — fragmented into parallel systems that each describe a different slice of the same campaign, accurately and irreconcilably.
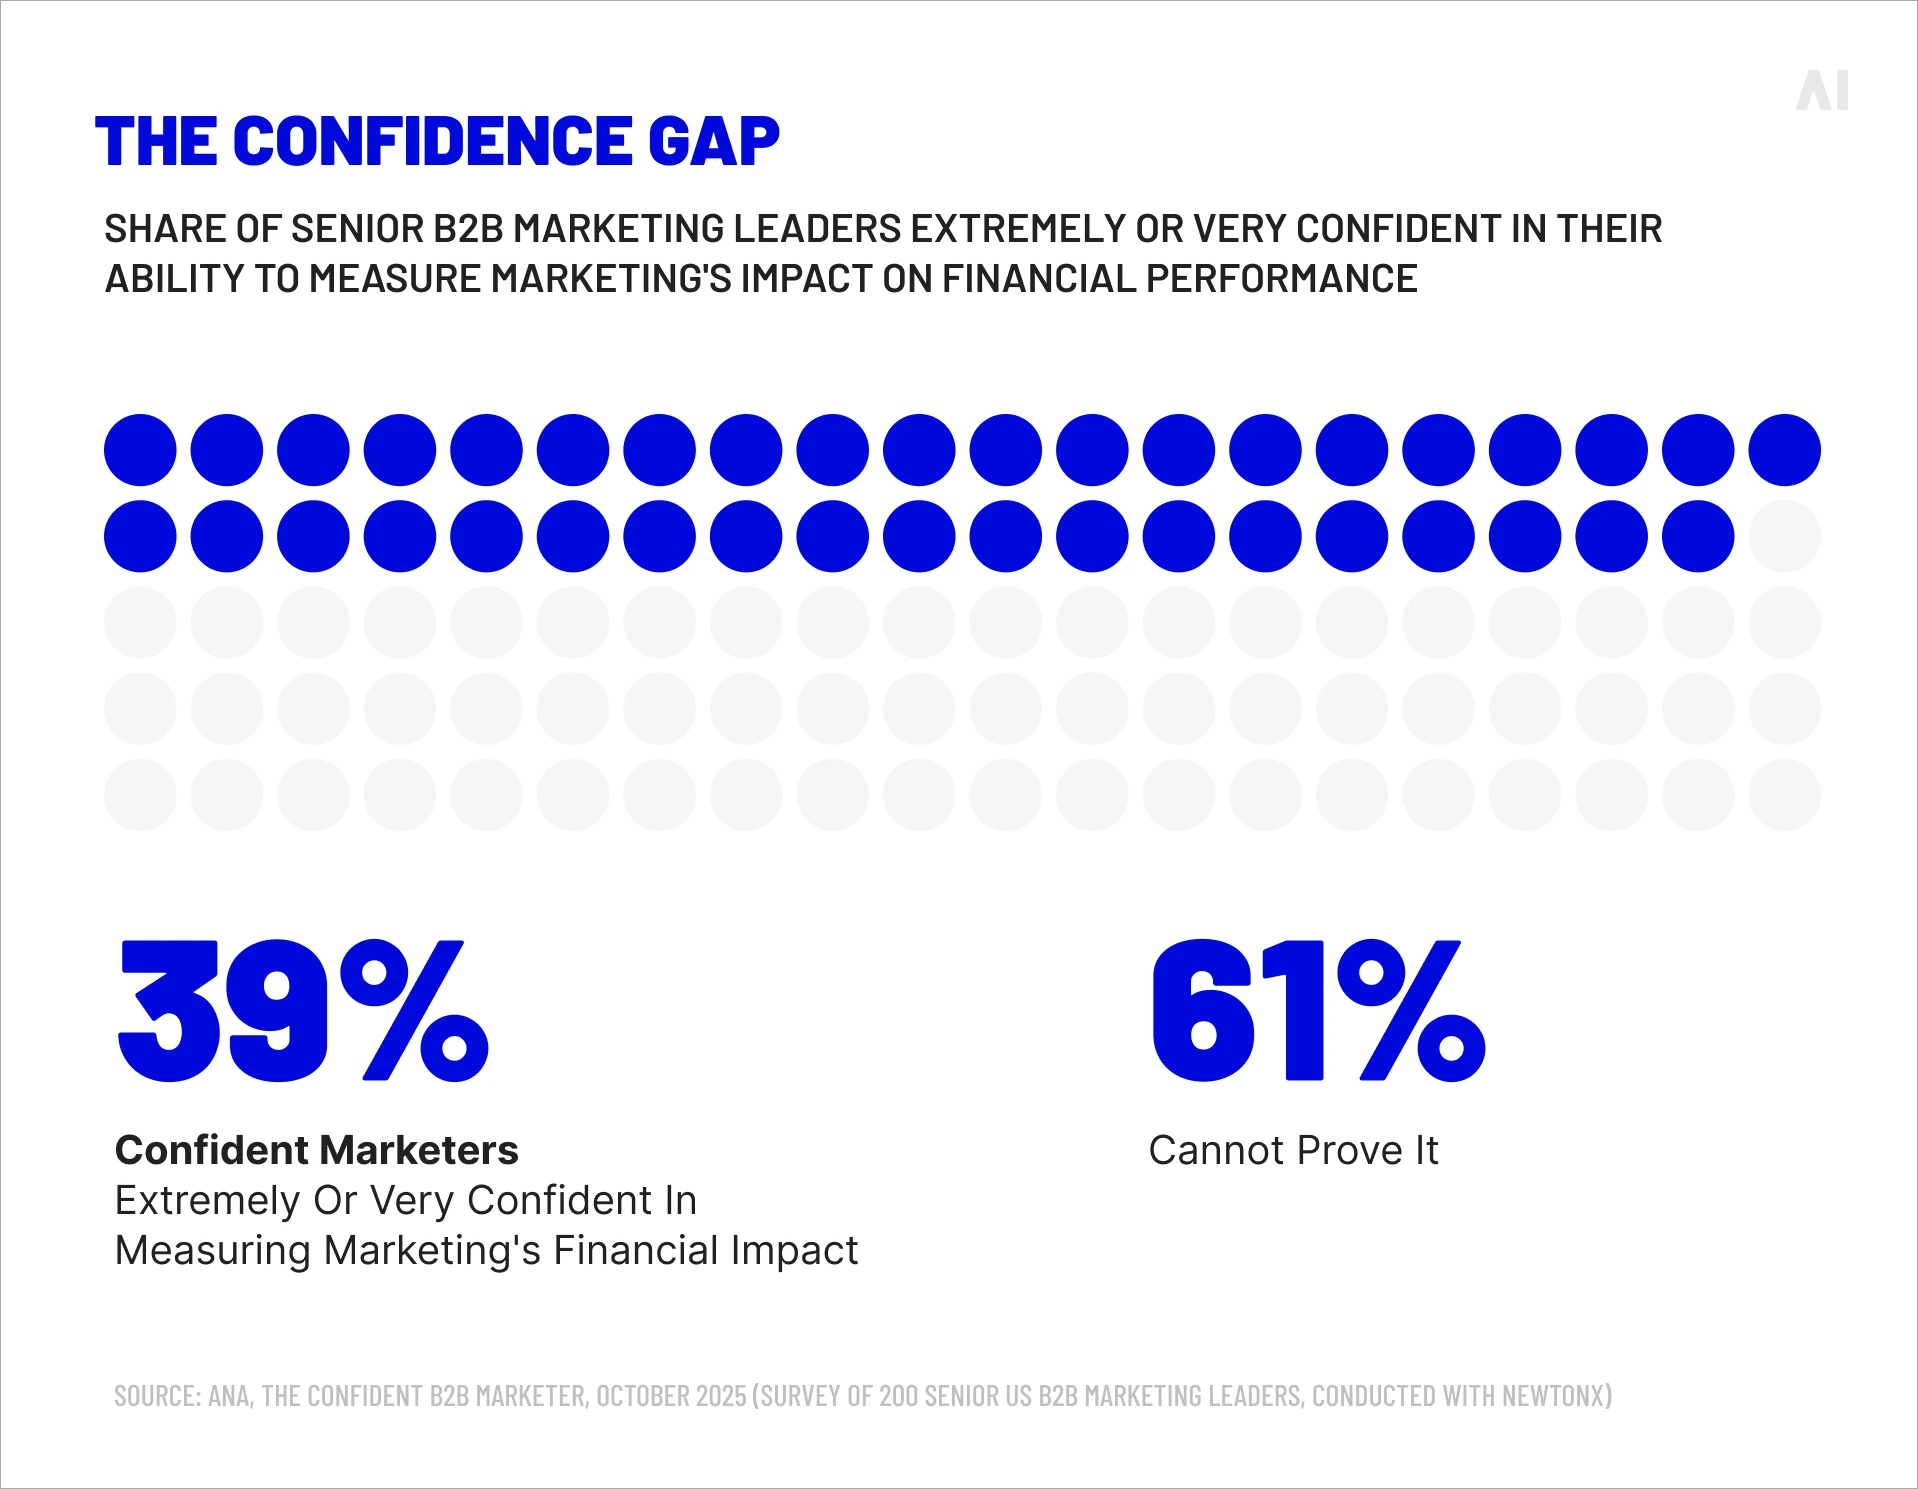
The Association of National Advertisers' Confident B2B Marketer study, released in October 2025, put a number on the cost. Only 39% of senior B2B marketing leaders qualify as "Confident Marketers" — those extremely or very confident in their ability to measure marketing's impact on financial performance. Sixty-one percent, by the study's definition, cannot prove it. The gap is a function of architecture. Most companies still run measurement across systems, models, and reporting environments that were never designed to operate as one.
A marketing measurement framework is the response and the operating structure through which a business collects performance data, applies the right analytical models, produces reporting that drives decisions, and adapts as the underlying conditions change. The companies that have built one defend their budgets and grow their share. The ones still operating without one continue to spend without a defensible read on what is working, and, increasingly, without the room to keep doing so.
Pic. The confidence gap.
What is a marketing measurement framework?
A marketing measurement framework is the operating system underneath everything a marketing team does to evaluate and improve performance. At its simplest, it is the agreed structure through which a business defines what success looks like, collects the data needed to assess it, applies models that translate raw data into business meaning, and turns the resulting insight into spending and creative decisions. It connects strategy to data to action and gives the people responsible for each step a shared language.
The difference between a framework and a stack of dashboards is governance.
A dashboard reports what happened in one platform.
A framework defines the metrics, methods, and decision rules through which platform data, business outcomes, and AI-driven analysis combine into a single view of performance.
It accommodates attribution for tactical optimization, marketing mix modeling for strategic allocation, and incrementality testing for causal validation — and it keeps each method honest by feeding the outputs of one into the calibration of another.
BCG's Six Steps to More Effective Marketing Measurement, published in June 2025, found that 46% of marketers surveyed use the full trifecta of measurement methods, but only the leading firms integrate the three so that each informs the others. Those leaders run MMMs monthly (39% of them) and use incrementality results to calibrate the models (40%). The methods are not new. The framework that makes them work together is what most companies still lack.
A scalable framework is built from layers, each depending on the one beneath it.
Reliable data sits at the bottom.
The analytical models — attribution, MMM, incrementality — turn that data into business meaning.
Reporting infrastructure makes that meaning legible to people outside the analytics team.
AI runs across the stack, accelerating the work at every stage, while governance holds the structure together as inputs, channels, and the business itself change underneath.
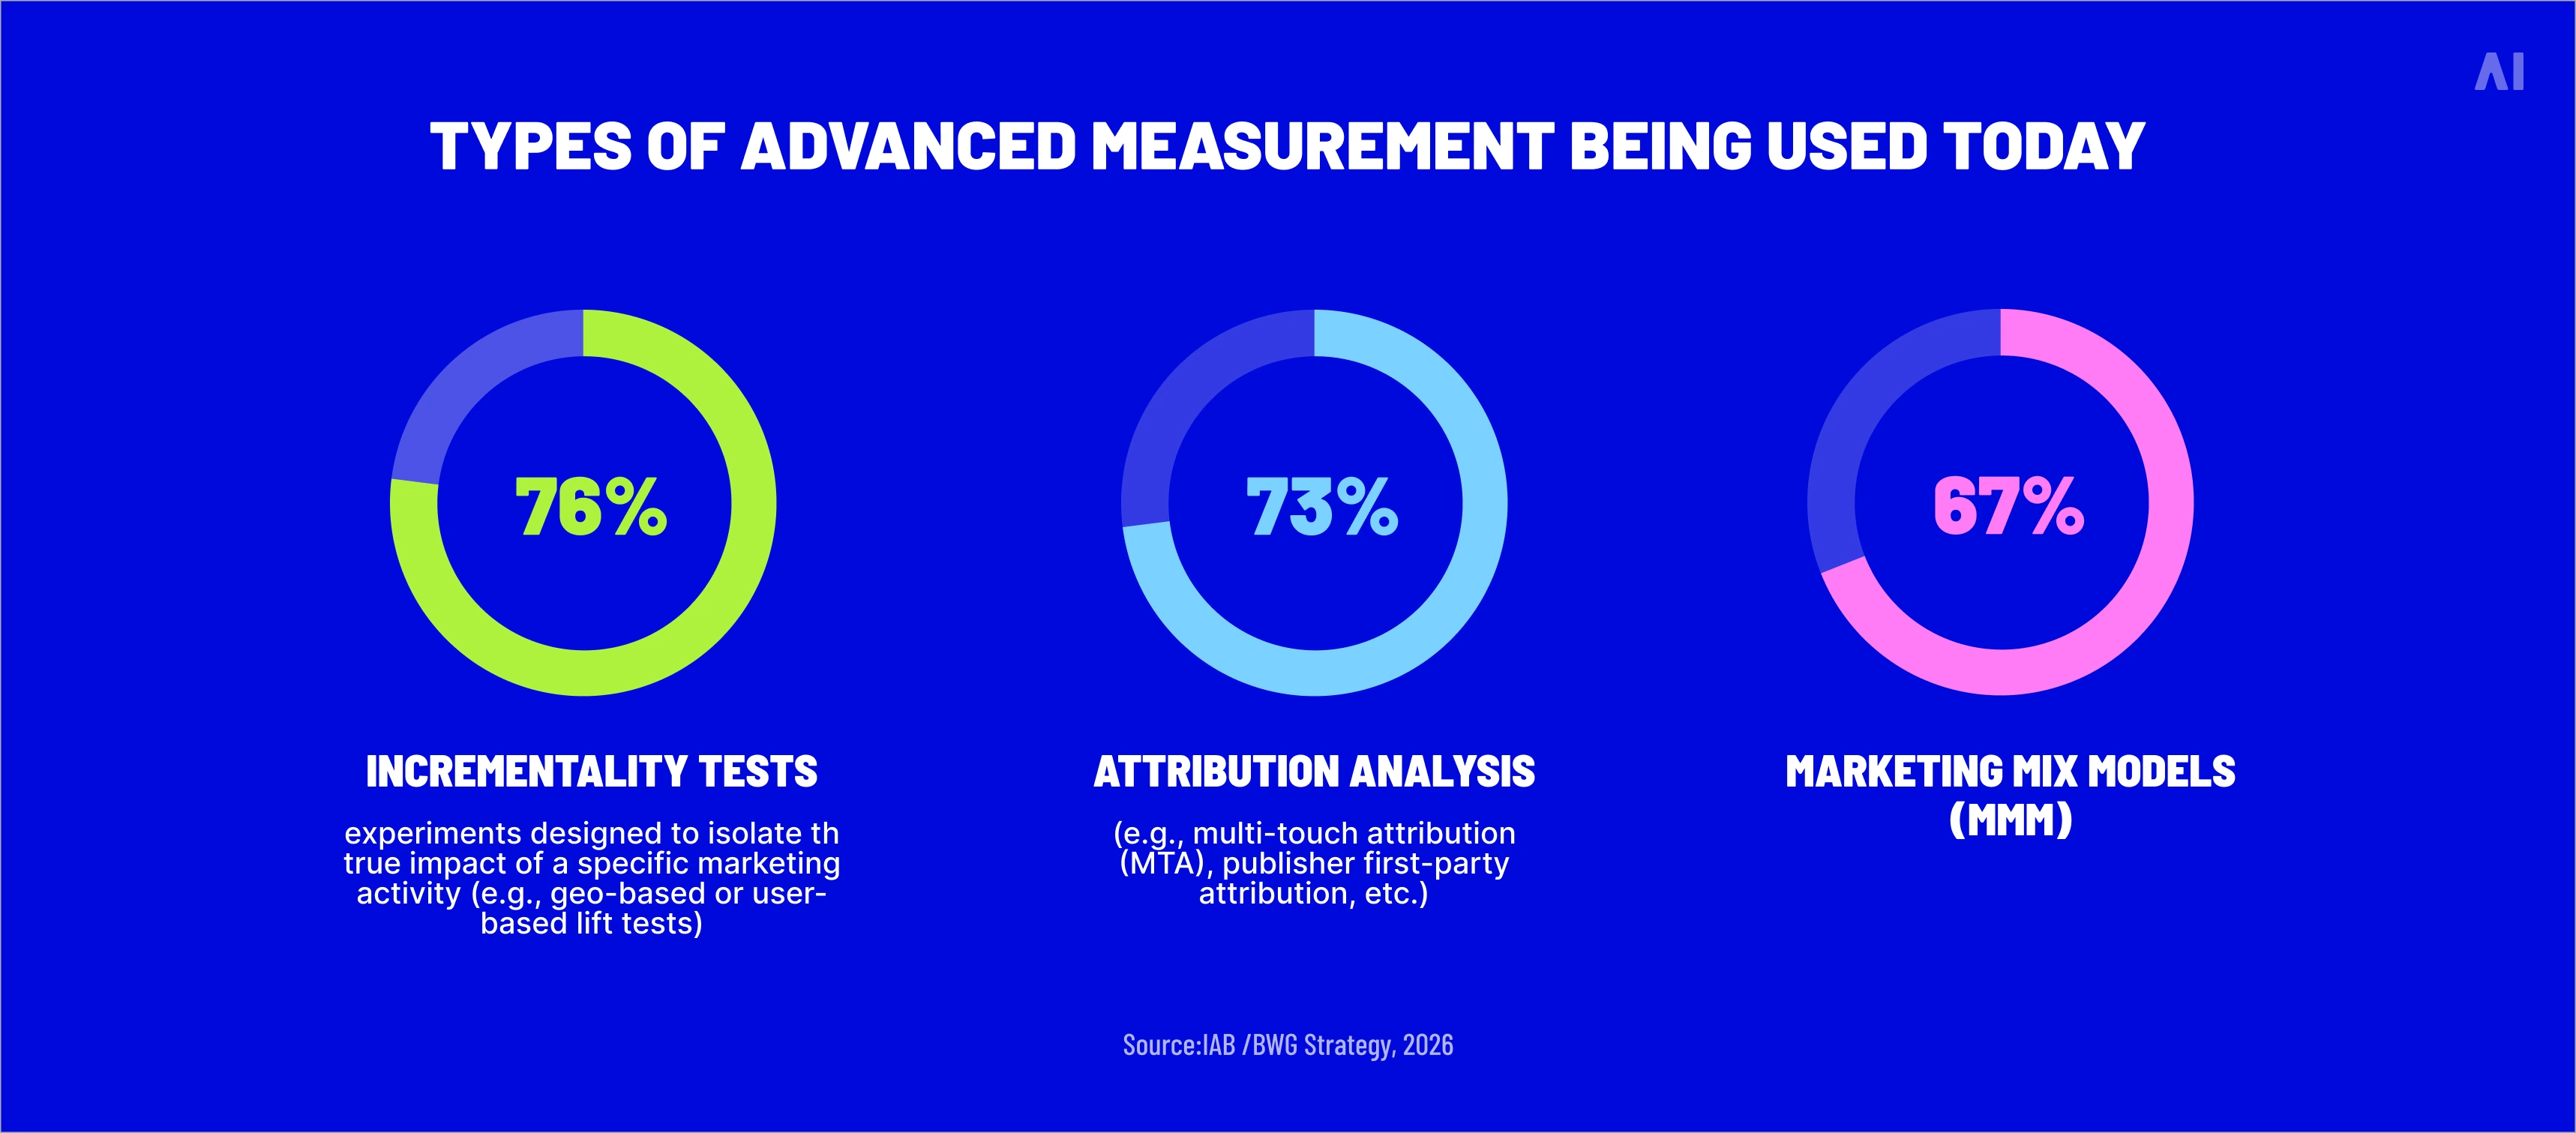
Pic. Types of advanced measurement being used today (Source)
Reliable data collection
Every measurement decision a marketing team makes is, in the end, a decision about what data to trust. Without reliable inputs, every model further up the stack inherits the noise. The collection layer covers first-party data captured through owned channels, server-side event tracking that survives browser-based blocking, identity resolution that ties anonymous behavior to known customers, and the consent infrastructure that makes the whole arrangement legally defensible.
The link between integrated data and measurement confidence is now direct and quantified. The ANA's confident-marketer cohort were nearly twice as likely to have mostly or fully integrated data systems — 65%, against 33% of less confident peers — and more than four times as likely to be ready for AI-driven automation. Unified data is no longer a back-office preference; it is the precondition for everything else the framework does.
No single model captures performance accurately on its own.
Attribution explains what happened across digital touchpoints, but it cannot prove causation.
Marketing mix modeling reads the whole media plan, including the offline activity attribution misses — but the cadence is too slow for in-flight optimization.
Incrementality testing delivers a clean causal read on a specific campaign, then goes quiet until the next experiment is set up.
Each method has known blind spots. Used together, with the outputs of one calibrating the others, they produce something closer to a defensible read on performance than any of them can manage alone.
The combinations that work best are not theoretical. As BCG's measurement leaders have shown, layering MMM for strategic planning, attribution for tactical optimization, and incrementality for causal validation is the structural pattern that separates confident measurement from anecdotal measurement. The detail of how the three fit together is covered in the Choosing the right measurement models section below.
Centralized reporting infrastructure
The reporting layer is where measurement either earns its credibility with the rest of the business or loses it. Most organizations have plenty of dashboards. What they often lack is one shared view in which marketing, sales, finance, and operations can see the same numbers, defined the same way, drawn from the same governed pipeline. Without that, every cross-functional conversation begins with an argument about whose data is right.
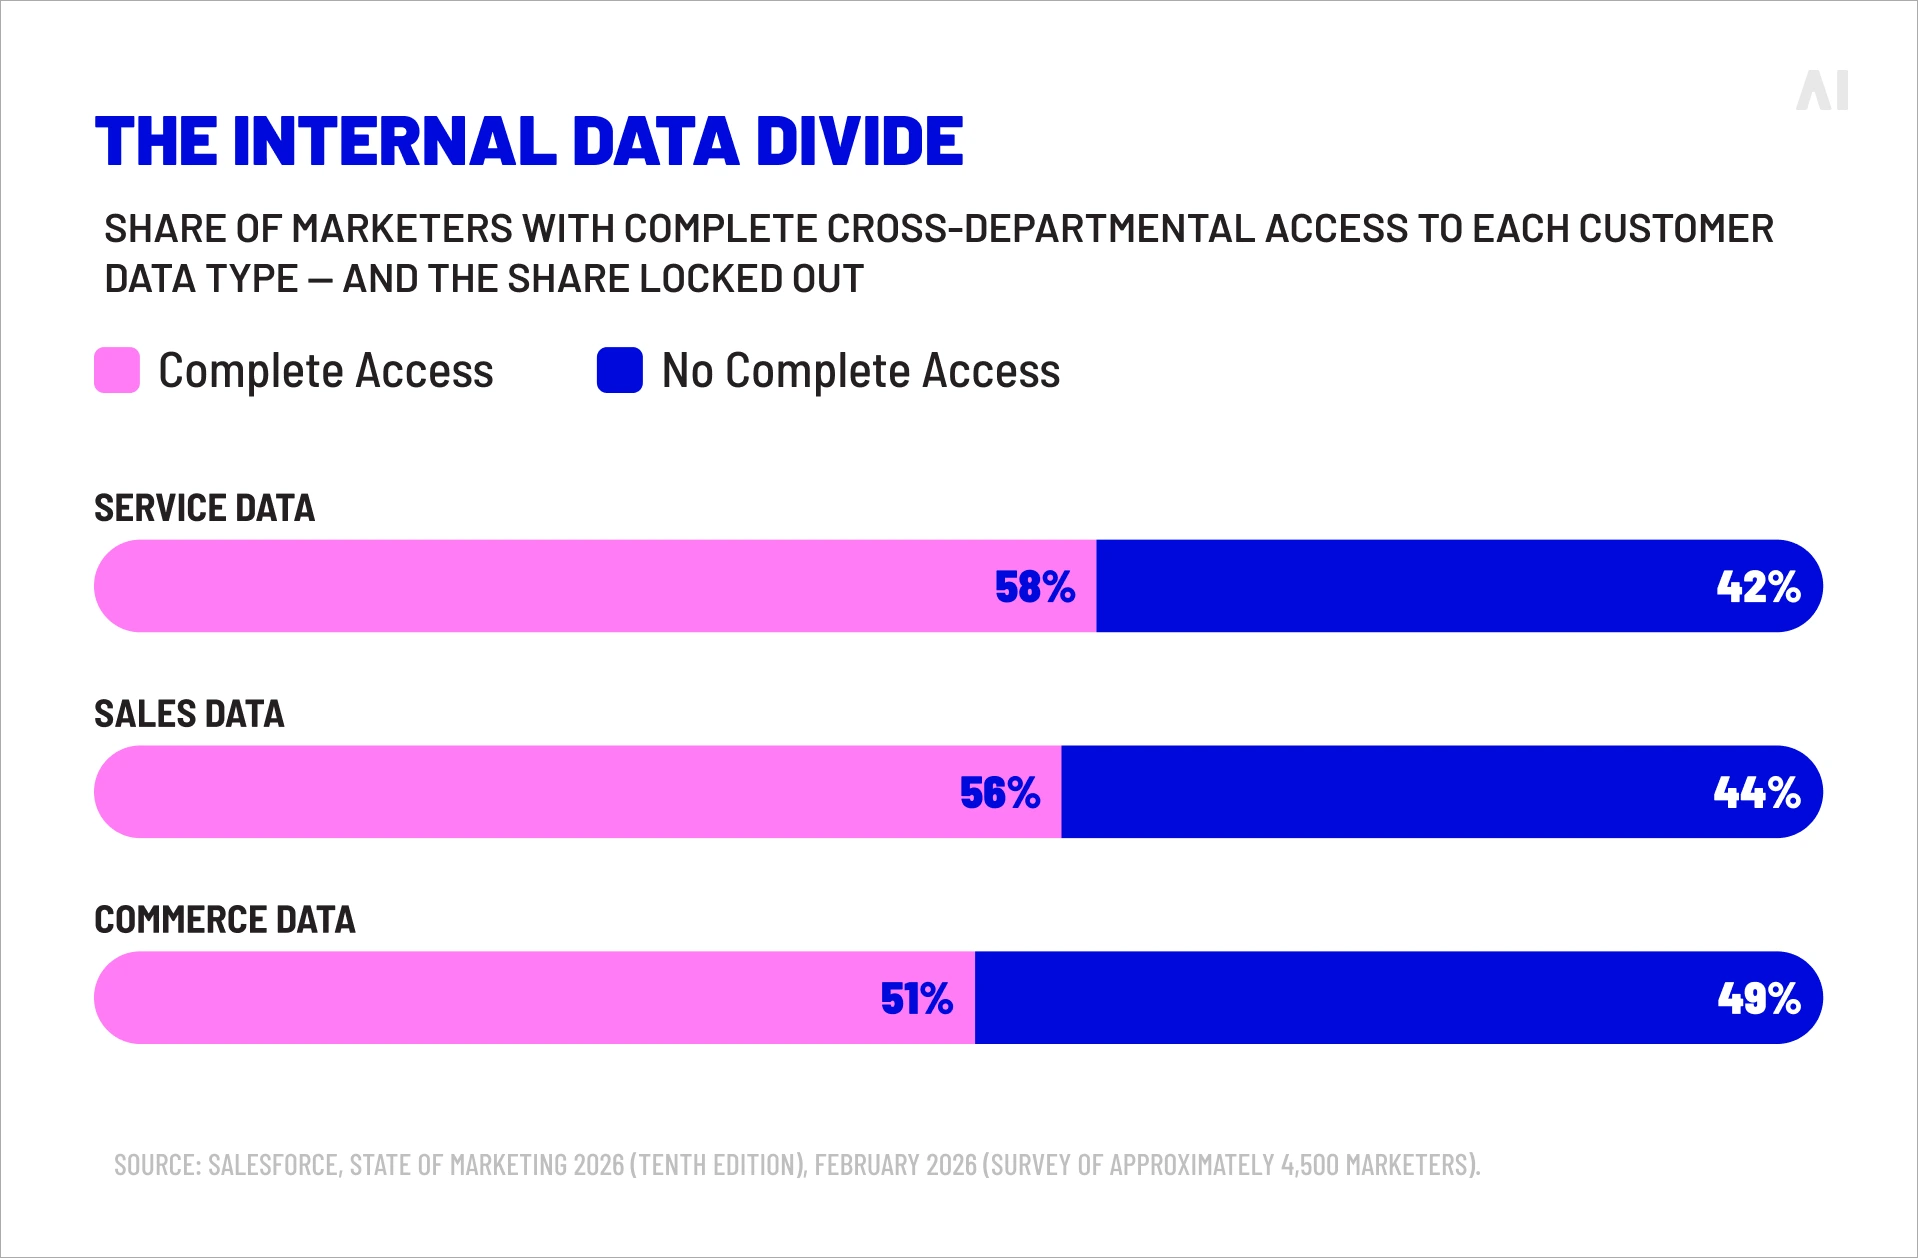
Salesforce's Tenth Edition State of Marketing report, published in February 2026, makes the cost of fragmentation specific. Only 58% of marketers have complete access to service data, 56% to sales data, and 51% to commerce data — meaning roughly half are operating with at least one major customer-data channel walled off internally. High-performing marketers, by contrast, were 2.4 times more likely to have unified data sources, and teams that had unified their data were 42% more likely to respond regularly to customers and 60% more likely to use AI agents to scale.
Pic. The internal data divide.
⚡ Cross-platform silos are the well-known problem in marketing measurement. Cross-departmental silos, sitting inside the company's own walls, are the under-recognized one, and they tend to be the harder of the two to fix.
The most consequential change in measurement over the past two years has been the move from AI as an analytical assistant to AI as the engine that runs forecasting and budget allocation directly. Modern frameworks use machine learning to detect non-linear relationships between media spend and outcomes, run thousands of scenario simulations in minutes, and produce predictive reads on where the next marginal dollar should go — work that previously sat with quarterly econometric studies and weekly planning meetings.
BCG's June 2025 measurement research found that leading marketers are twice as likely as their peers to embed AI into the core of their measurement approach, and that leaders as a group deliver up to 70% higher revenue growth than their less mature counterparts. The advantage is not in adopting AI but in using it as the operating layer of the framework rather than as a feature bolted onto an older one.
Once data is governed and models are running, the next layer is the one that decides whether insight reaches the people who can act on it in time.
AI-driven anomaly detection flags drops in performance before a weekly review surfaces them.
Automated commentary translates dashboard movements into plain-language summaries for executives.
Alerting connects pacing data to budget reallocation rules.
The point of this layer is not to eliminate analysts; it is to free them from the parts of the job that machines now do more reliably — reconciling spreadsheets, hunting for outliers, writing the same weekly status note twelve times a year.
The final layer is the one most often skipped, and the one most often missing when a framework starts to drift. Governance covers the tracking audits, naming conventions, taxonomy structures, and experimentation cadences that keep the whole system measuring the same thing month after month. Without it, definitions of "conversion" diverge by team, dashboards rot in place, and the inputs feeding the models lose their reliability one quiet decision at a time.
Signs your marketing measurement framework is breaking
A framework rarely fails in one dramatic moment. It fails by accumulation — through small inconsistencies that grow until reporting stops being trusted. A few signals tend to show up before the full picture is clear.
The first is inconsistent reporting across teams. Two analysts pull what should be the same metric and produce different numbers. Conversations get sidetracked into reconciling spreadsheets before anyone can discuss what the data means.
The second is slow decision-making. Insights arrive after the budget window has closed; mid-campaign optimization happens by intuition because the dashboard is two weeks behind.
The third is conflicting attribution. Meta says one number, the DSP says another, the CRM tells a third story, and the team has no defensible way to settle the disagreement.
The fourth is the manual reporting tax — analysts spending more time stitching data than analyzing it. The fifth is disengaged executives, who stop attending the marketing review because the data has lost its claim to inform decisions.
A scalable content marketing measurement framework, a B2B demand framework, and an enterprise-wide framework all break in roughly the same way. The discipline is structural; the symptoms are universal.
How to build a measurement framework
Building a measurement framework is a sequencing problem. Most teams trying to fix measurement start with tools — a new attribution platform, a fresh dashboard, an additional analytics hire — and find six months later that the underlying problems have not moved. The order below reflects what mature measurement teams have learned the harder way: structure first, methodology second, technology third.
1. Audit existing data sources
Every framework rebuild starts with a clear-eyed inventory of what data the business already collects, where it lives, how reliable it is, and where the gaps are. The audit usually surfaces three recurring problems.
Duplicate tracking — the same event captured by two systems and counted twice.
Decayed tags — events that stopped firing months ago and nobody noticed.
Orphaned data — fields populated by a team that has since moved on, with no documented owner.
Naming these problems and assigning ownership is what closes the gap between aspiration and capability.
2. Define business-critical KPIs
KPIs are where most frameworks slip into reporting theater. Teams measure what is easy to measure — clicks, impressions, engagement rates — and the resulting metrics describe activity rather than outcomes.
BCG's measurement research is unambiguous on the corrective: define one or two north-star KPIs that ladder directly to business outcomes (revenue, profit, customer lifetime value), and treat everything else as supporting metrics that feed those. The fewer the north-star KPIs, the more useful they tend to be.
3. Create consistent tracking standards
The work of standardization is unglamorous and decisive.
Naming conventions for campaigns, audiences, and events.
Taxonomies that hold across business units.
Defined attribution windows that everyone agrees on before the campaign goes live.
UTM parameters that follow a documented schema rather than the preferences of whoever set up the latest push.
Standards are the layer that determines whether a framework can scale without descending into archaeology.
4. Map metrics to customer journeys
Different points in the customer journey demand different metrics.
Awareness benefits from reach, brand-search lift, and brand-tracking surveys.
Consideration is read through site engagement, content consumption, and product-page behavior.
Conversion is measured by transaction volume, basket size, and purchase rate.
Retention shows up in repeat rate, churn, and customer lifetime value.
A coherent content marketing measurement framework assigns the right metric family to each journey stage, so that every channel is evaluated by what it is actually being asked to do.
5. Build decision-focused reporting
Reporting is not a record-keeping exercise. The point of a dashboard is to drive a decision — to redirect budget, kill a campaign, double down on a creative, or raise the alarm on a pacing risk. Decision-focused reporting strips out the metrics that do not influence action, surfaces the ones that do, and presents them in a format that the people responsible for the decision can read in under a minute. The clearest indicator that reporting is working is that fewer numbers, presented more clearly, drive faster moves.
Choosing the right measurement models
No single measurement model produces a complete picture of marketing performance. Each method answers a specific question well and other questions badly, and the work of building a framework is choosing the right combination for the business at hand. Most mature organizations end up using all three core methods together, with each calibrating the others.
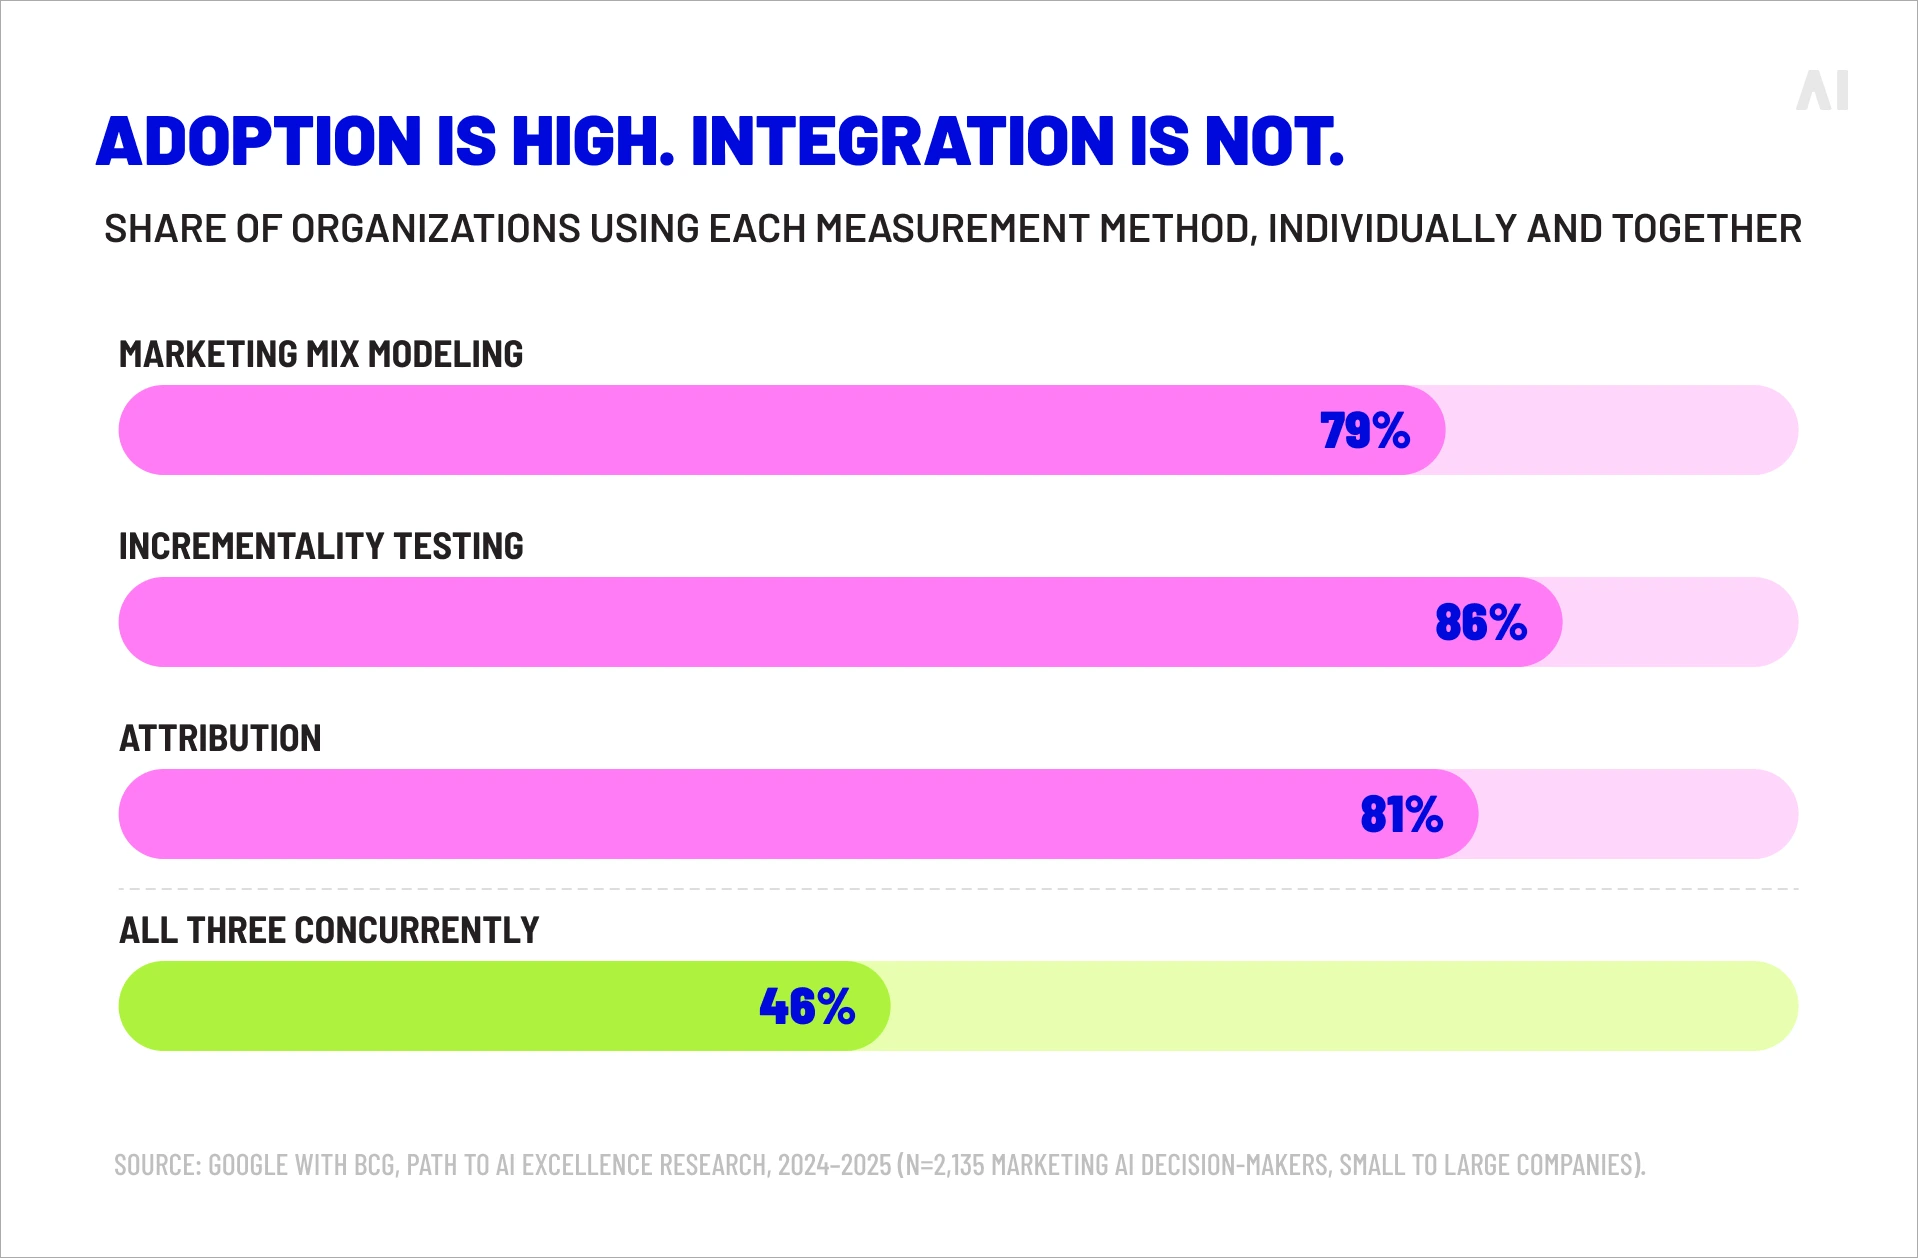
The Google–BCG Path to AI Excellence research, based on a global survey of 2,135 marketing AI decision-makers, captures the structural problem cleanly. Adoption of individual methods is high — 79% use MMM, 86% use incrementality testing, 81% use attribution — yet only 46% of organizations use all three concurrently, and only 40% completely trust the performance of their current measurement solutions. The methods exist. The integration does not.
Pic. Adoption is high. Integration is not.
"The future of marketing measurement hinges on brands' ability to merge MMM, incrementality testing and attribution — and to support that integrated framework with the power of advanced AI and clean, connected data." — Think with Google, based on the BCG/Google measurement research, 2025.
Attribution for optimization
Attribution models assign credit to the touchpoints that contribute to a conversion. Their strength is granularity: they operate at the user or session level, refresh quickly, and can support daily campaign and creative decisions. Their weakness is what they cannot see — anything that happened offline, anything that happened before the tracked window opened, and anything that contributed to demand without being directly clicked. Modern frameworks use attribution as the optimization layer, not the answer layer.
Marketing mix modeling is the strategic counterpart to tactical attribution. It uses aggregated historical data — spend, sales, pricing, competitive activity, seasonality — to estimate how each channel contributes to business outcomes across the full media plan, including offline channels and brand activity that attribution cannot capture.
Modern MMM has compressed cycle times through Bayesian methods, automated calibration, and AI-driven scenario testing, allowing models that once took quarters to refresh to update monthly.
💡 AI Digital's piece on mixed media modeling covers the methodology and its use cases.
A well-built brand measurement framework typically anchors here, because MMM is the model that can credit awareness-driving channels for the value they create — value that attribution systematically understates.
Incrementality for true impact
Incrementality testing measures the causal lift a campaign produces over what would have happened without it, by comparing exposed and unexposed groups under controlled conditions. It is the most rigorous of the three methods and the most narrowly scoped: a single test gives a clean read on a single hypothesis, and the conditions for setup are not always present. Its value in the framework is calibration.
Leading marketers — about 40% of the BCG cohort — use incrementality results to anchor MMM estimates in observed reality, producing a self-correcting system rather than three disconnected outputs.
Open measurement vs walled garden
The structural problem behind most measurement frustrations is who controls the data. In closed advertising ecosystems — the walled gardens operated by the largest platforms — the platform reports its own performance using its own definitions, its own attribution windows, and its own logic. The advertiser sees what the platform chooses to show. Cross-platform comparison becomes a translation problem, and budgets tend to migrate toward whichever environment reports the most flattering numbers.
💡 The history and operating principles of these environments are covered in AI Digital's primer on analysis of walled gardens vs open internet.
Open measurement starts from the opposite premise: that the advertiser, not the platform, defines the metrics, owns the data, and arbitrates the comparison. The result is a framework that can evaluate channels on equal terms.
Walled gardens limit visibility
Inside a walled garden, every metric is filtered through the platform's interests.
Conversions are credited generously when the credit returns budget to the platform.
Attribution windows expand or contract by design rather than by independent standard.
Cross-platform identity resolution — the basic ability to know whether the user who saw a Meta ad is the same user who later searched on Google — is structurally limited because each platform protects its own audience graph.
The data-infrastructure gap compounds the problem. Google and BCG's Path to AI Excellence survey found that 42% of companies globally still lack a CRM platform and 57% do not have a CDP — the very systems needed to unify customer data outside the platforms. Only 24% achieve a true 360-degree view of their customers. Walled gardens dominate not only because they are large; they dominate partly because so few advertisers have built the data infrastructure to operate without them.
Open measurement rebuilds visibility on the advertiser's side of the fence. It draws data from multiple platforms and third-party sources, normalizes definitions, and produces cross-channel reporting that is not contingent on any single vendor's cooperation. Identity resolution runs through the brand's own infrastructure rather than the platform's. Attribution applies the same rules across every channel. The performance picture that emerges is comparable in a way platform-reported data is not.
💡 For broader treatment of how the open internet operates outside the walled garden model, see AI Digital's pieces on the open internet and transparency in advertising.
DSP-agnostic strategies increase flexibility
A framework anchored in the advertiser's own data and metrics is, by definition, platform-agnostic. Spend can move toward the channels and platforms producing the best results without the friction of changing the measurement model. A DSP-agnostic execution layer extends that flexibility into media buying itself — the buyer chooses inventory on the basis of fit and price rather than the platform's incentives, and the framework evaluates the outcome on its own terms.
Turning measurement into business decisions with AI Digital
Measurement only delivers value at the point a business decision changes. The bridge between data and decision is where most frameworks either prove their worth or quietly stop being used. AI Digital builds that bridge through a small set of connected products designed around transparency, AI-augmented analysis, and cross-platform reach.
Connecting planning and measurement
Elevate is AI Digital's marketing intelligence platform. It unifies research, planning, optimization, and reporting in a single environment, drawing on 150 billion data points monthly and more than 10,000 audience attributes to inform every step of the campaign cycle.
Pre-campaign, Elevate generates audience segments, builds personas, and runs competitive analysis against verified data signals.
In-flight, it delivers performance reporting with forecasts, benchmarks, and AI-generated commentary, allowing teams to redirect budget against KPI movement rather than gut feel.
Post-campaign, the platform's Marketing Mix Modeling and Path to Conversion modules feed strategic budget decisions back into the next planning cycle.
The work of measurement and the work of planning become the same workflow rather than two disconnected ones.
Improving inventory quality
Smart Supply is AI Digital's supply-side curation layer. It addresses a problem that distorts measurement before any model touches the data: low-quality, fraudulent, or fee-inflated inventory entering the campaign and producing impression counts that misrepresent what really happened.
Smart Supply curates high-quality, brand-safe inventory across 9+ premium SSPs, applies supply path optimization to remove unnecessary bid hops, and ensures the data flowing into the measurement framework reflects actual delivered media value. Better inputs produce better measurement, and better measurement produces decisions that hold up under scrutiny.
Enabling transparent media decisions
Open Garden is the framework underpinning the rest of AI Digital's work. It is DSP-agnostic by design, with access to 15+ demand-side platforms and full cross-platform reporting that does not depend on any single vendor's data feed. Open Garden replaces the closed-ecosystem default with a structure in which the advertiser, not the platform, owns the comparison.
The fourth element is operational. AI Digital's managed service combines the intelligence platform, the supply layer, and the agnostic framework with human strategic oversight — campaign managers, planners, and analysts who interpret the data, calibrate the models, and convert performance signal into execution decisions.
The result is a measurement framework that scales with the business rather than against it: fewer manual reporting cycles, faster mid-flight adjustments, and reporting that the C-suite can act on without needing to translate it first.
Frameworks fail in predictable ways. The technical problems are well-documented; the organizational ones are harder to fix and more common.
The first is fragmented data ownership. Marketing owns campaign data, sales owns CRM, finance owns revenue, and product owns the in-app behavior. None of those owners are individually wrong about their data, but the absence of a shared layer means measurement runs into a wall every time it tries to connect channel performance to business outcome. BCG's research with 200 CMOs across seven countries found that only one in four companies use measurement outputs to allocate investment across all touchpoints, and fewer than half include finance or sales in the measurement process at all. Until those participants are at the table, the framework cannot do more than describe what marketing did.
"For years, marketing has fought to prove its value beyond the sales assist. The practices of confident marketers aren't just effective; they represent a new standard for earning credibility in the C-suite." — Bill Zengel, SVP, ANA B2B Marketing Practice, on the Confident B2B Marketer findings.
The second is short-term performance bias. Quarterly pressure pushes teams toward whatever metric responds fastest, which is usually a lower-funnel one. Brand-building investments, upper-funnel video, and longer-cycle B2B activity get systematically under-credited because they don't move the dashboards that matter to next week's review.
The third is dashboard sprawl — every tool in the stack producing its own view, none of them reconciling, and analysts spending their week as translators. The fourth is outdated standards that don't keep pace with how customers actually buy. The fifth is the slow erosion of trust that follows from any of the above. Once the C-suite stops believing the numbers, the framework is finished, regardless of how technically sound it might be.
A scalable marketing measurement framework is now what separates the marketing organizations that can defend their budgets from the ones that can't. The discipline is no longer optional, the methods are no longer in dispute, and the data infrastructure required to support them is no longer prohibitively expensive. What remains, in most companies, is the operational work of putting the layers in place — first-party data, governed measurement models, unified reporting, AI-augmented forecasting, and the governance that keeps the system honest as the environment changes around it. The organizations doing that work are the ones currently outgrowing their peers. The ones still measuring through the same dashboards they used five years ago are not.
AI Digital builds and operates scalable measurement frameworks for brands and agencies through three connected products:
Elevate, the marketing intelligence platform that unifies planning, optimization, and reporting;
Smart Supply, the supply-side curation layer that improves the quality of media data feeding the framework; and
Open Garden, the DSP-agnostic structure that gives advertisers transparent access to the open internet.
The combination produces a measurement environment that is rigorous enough to defend to a CFO and flexible enough to keep pace with how the business actually operates. Teams ready to evaluate their own measurement infrastructure can get in touch with AI Digital.
Blind spot
Key issues
Business impact
AI Digital solution
Lack of transparency in AI models
• Platforms own AI models and train on proprietary data • Brands have little visibility into decision-making • "Walled gardens" restrict data access
• Inefficient ad spend • Limited strategic control • Eroded consumer trust • Potential budget mismanagement
Open Garden framework providing: • Complete transparency • DSP-agnostic execution • Cross-platform data & insights
Optimizing ads vs. optimizing impact
• AI excels at short-term metrics but may struggle with brand building • Consumers can detect AI-generated content • Efficiency might come at cost of authenticity
• Short-term gains at expense of brand health • Potential loss of authentic connection • Reduced effectiveness in storytelling
Smart Supply offering: • Human oversight of AI recommendations • Custom KPI alignment beyond clicks • Brand-safe inventory verification
The illusion of personalization
• Segment optimization rebranded as personalization • First-party data infrastructure challenges • Personalization vs. surveillance concerns
• Potential mismatch between promise and reality • Privacy concerns affecting consumer trust • Cost barriers for smaller businesses
Elevate platform features: • Real-time AI + human intelligence • First-party data activation • Ethical personalization strategies
AI-Driven efficiency vs. decision-making
• AI shifting from tool to decision-maker • Black box optimization like Google Performance Max • Human oversight limitations
• Strategic control loss • Difficulty questioning AI outputs • Inability to measure granular impact • Potential brand damage from mistakes
Managed Service with: • Human strategists overseeing AI • Custom KPI optimization • Complete campaign transparency
Fig. 1. Summary of AI blind spots in advertising
Dimension
Walled garden advantage
Walled garden limitation
Strategic impact
Audience access
Massive, engaged user bases
Limited visibility beyond platform
Reach without understanding
Data control
Sophisticated targeting tools
Data remains siloed within platform
Fragmented customer view
Measurement
Detailed in-platform metrics
Inconsistent cross-platform standards
Difficult performance comparison
Intelligence
Platform-specific insights
Limited data portability
Restricted strategic learning
Optimization
Powerful automated tools
Black-box algorithms
Reduced marketer control
Fig. 2. Strategic trade-offs in walled garden advertising.
Core issue
Platform priority
Walled garden limitation
Real-world example
Attribution opacity
Claiming maximum credit for conversions
Limited visibility into true conversion paths
Meta and TikTok's conflicting attribution models after iOS privacy updates
Data restrictions
Maintaining proprietary data control
Inability to combine platform data with other sources
Amazon DSP's limitations on detailed performance data exports
Cross-channel blindspots
Keeping advertisers within ecosystem
Fragmented view of customer journey
YouTube/DV360 campaigns lacking integration with non-Google platforms
Black box algorithms
Optimizing for platform revenue
Reduced control over campaign execution
Self-serve platforms using opaque ML models with little advertiser input
Performance reporting
Presenting platform in best light
Discrepancies between platform-reported and independently measured results
Consistently higher performance metrics in platform reports vs. third-party measurement
Fig. 1. The Walled garden misalignment: Platform interests vs. advertiser needs.
Key dimension
Challenge
Strategic imperative
ROAS volatility
Softer returns across digital channels
Shift from soft KPIs to measurable revenue impact
Media planning
Static plans no longer effective
Develop agile, modular approaches adaptable to changing conditions
Brand/performance
Traditional division dissolving
Create full-funnel strategies balancing long-term equity with short-term conversion
Capability
Key features
Benefits
Performance data
Elevate forecasting tool
• Vertical-specific insights • Historical data from past economic turbulence • "Cascade planning" functionality • Real-time adaptation
• Provides agility to adjust campaign strategy based on performance • Shows which media channels work best to drive efficient and effective performance • Confident budget reallocation • Reduces reaction time to market shifts
• Dataset from 10,000+ campaigns • Cuts response time from weeks to minutes
• Reaches people most likely to buy • Avoids wasted impressions and budgets on poor-performing placements • Context-aligned messaging
• 25+ billion bid requests analyzed daily • 18% improvement in working media efficiency • 26% increase in engagement during recessions
Full-funnel accountability
• Links awareness campaigns to lower funnel outcomes • Tests if ads actually drive new business • Measures brand perception changes • "Ask Elevate" AI Chat Assistant
• Upper-funnel to outcome connection • Sentiment shift tracking • Personalized messaging • Helps balance immediate sales vs. long-term brand building
• Natural language data queries • True business impact measurement
Open Garden approach
• Cross-platform and channel planning • Not locked into specific platforms • Unified cross-platform reach • Shows exactly where money is spent
• Reduces complexity across channels • Performance-based ad placement • Rapid budget reallocation • Eliminates platform-specific commitments and provides platform-based optimization and agility
• Coverage across all inventory sources • Provides full visibility into spending • Avoids the inability to pivot across platform as you’re not in a singular platform
Fig. 1. How AI Digital helps during economic uncertainty.
Trend
What it means for marketers
Supply & demand lines are blurring
Platforms from Google (P-Max) to Microsoft are merging optimization and inventory in one opaque box. Expect more bundled “best available” media where the algorithm, not the trader, decides channel and publisher mix.
Walled gardens get taller
Microsoft’s O&O set now spans Bing, Xbox, Outlook, Edge and LinkedIn, which just launched revenue-sharing video programs to lure creators and ad dollars. (Business Insider)
Retail & commerce media shape strategy
Microsoft’s Curate lets retailers and data owners package first-party segments, an echo of Amazon’s and Walmart’s approaches. Agencies must master seller-defined audiences as well as buyer-side tactics.
AI oversight becomes critical
Closed AI bidding means fewer levers for traders. Independent verification, incrementality testing and commercial guardrails rise in importance.
Fig. 1. Platform trends and their implications.
Metric
Connected TV (CTV)
Linear TV
Video Completion Rate
94.5%
70%
Purchase Rate After Ad
23%
12%
Ad Attention Rate
57% (prefer CTV ads)
54.5%
Viewer Reach (U.S.)
85% of households
228 million viewers
Retail Media Trends 2025
Access Complete consumer behaviour analyses and competitor benchmarks.
Identify and categorize audience groups based on behaviors, preferences, and characteristics
Michaels Stores: Implemented a genAI platform that increased email personalization from 20% to 95%, leading to a 41% boost in SMS click through rates and a 25% increase in engagement.
Estée Lauder: Partnered with Google Cloud to leverage genAI technologies for real-time consumer feedback monitoring and analyzing consumer sentiment across various channels.
High
Medium
Automated ad campaigns
Automate ad creation, placement, and optimization across various platforms
Showmax: Partnered with AI firms toautomate ad creation and testing, reducing production time by 70% while streamlining their quality assurance process.
Headway: Employed AI tools for ad creation and optimization, boosting performance by 40% and reaching 3.3 billion impressions while incorporating AI-generated content in 20% of their paid campaigns.
High
High
Brand sentiment tracking
Monitor and analyze public opinion about a brand across multiple channels in real time
L’Oréal: Analyzed millions of online comments, images, and videos to identify potential product innovation opportunities, effectively tracking brand sentiment and consumer trends.
Kellogg Company: Used AI to scan trending recipes featuring cereal, leveraging this data to launch targeted social campaigns that capitalize on positive brand sentiment and culinary trends.
High
Low
Campaign strategy optimization
Analyze data to predict optimal campaign approaches, channels, and timing
DoorDash: Leveraged Google’s AI-powered Demand Gen tool, which boosted its conversion rate by 15 times and improved cost per action efficiency by 50% compared with previous campaigns.
Kitsch: Employed Meta’s Advantage+ shopping campaigns with AI-powered tools to optimize campaigns, identifying and delivering top-performing ads to high-value consumers.
High
High
Content strategy
Generate content ideas, predict performance, and optimize distribution strategies
JPMorgan Chase: Collaborated with Persado to develop LLMs for marketing copy, achieving up to 450% higher clickthrough rates compared with human-written ads in pilot tests.
Hotel Chocolat: Employed genAI for concept development and production of its Velvetiser TV ad, which earned the highest-ever System1 score for adomestic appliance commercial.
High
High
Personalization strategy development
Create tailored messaging and experiences for consumers at scale
Stitch Fix: Uses genAI to help stylists interpret customer feedback and provide product recommendations, effectively personalizing shopping experiences.
Instacart: Uses genAI to offer customers personalized recipes, mealplanning ideas, and shopping lists based on individual preferences and habits.
Medium
Medium
Share article
Url copied to clipboard
No items found.
Subscribe to our Newsletter
THANK YOU FOR YOUR SUBSCRIPTION
Oops! Something went wrong while submitting the form.
Questions? We have answers
What makes a marketing measurement framework scalable?
A scalable framework holds up as the business grows in channels, markets, and data volume without requiring a full rebuild. The architectural traits that produce scalability are unified data infrastructure, standardized metric definitions across teams, layered measurement methods that calibrate one another, AI-augmented forecasting embedded in core workflows, and ongoing governance to keep the inputs reliable. The ANA's confident-marketer cohort is 2× more likely than peers to have integrated data systems—the foundational ingredient for everything else.
How do businesses build a marketing measurement framework?
The sequencing is as important as the components themselves. Start with a data-source audit to surface gaps and redundancies. Define one or two north-star KPIs that ladder directly to business outcomes. Establish naming conventions, tracking standards, and a documented taxonomy. Map measurement metrics to each stage of the customer journey, awareness through retention. Build decision-focused reporting that produces action rather than activity. Layer attribution, MMM, and incrementality together so each calibrates the others, and embed AI into forecasting and anomaly detection where the speed advantage is greatest.
Which measurement models should businesses use together?
Most mature programs run all three core methods in combination. Attribution drives daily and weekly tactical optimization. Marketing mix modeling supports strategic budget allocation across the full plan, including offline channels. Incrementality testing produces causal reads on specific campaigns and calibrates the MMM estimates. BCG research shows that only 46% of marketers use all three concurrently, and the leaders within that group are the ones who let each method inform the others rather than running them in parallel silos.
Why is first-party data important in modern measurement frameworks?
First-party data is the only data layer the business fully controls and can build measurement on without exposure to third-party signal loss. As browser tracking restrictions, regulatory expansion, and platform-level changes erode third-party signal, first-party data becomes the basis for identity resolution, audience targeting, and outcome measurement. It is also the input AI models need to produce reliable forecasts — and the input most likely to remain available regardless of how the privacy environment continues to develop.
How do scalable frameworks improve cross-channel visibility?
A scalable framework treats all channels through a common measurement standard, with consistent definitions, attribution rules, and identity resolution. The framework draws data from multiple platforms and a brand's own systems, normalizes it, and produces a single comparable view of performance. Without that common standard, every channel comparison becomes an exercise in translating between platform-specific definitions — and budgets tend to drift toward whichever platform reports most generously rather than which one produces the most business outcome.
What role does AI play in marketing measurement frameworks?
AI sits across the framework rather than inside any one part of it. At the data layer it improves identity resolution and surfaces anomalies before they become reporting problems. Inside the models, it compresses MMM cycle times and supports Bayesian calibration against incrementality results. At the reporting layer, AI turns dashboard movements into plain-language commentary and finds patterns analysts would otherwise hunt for manually. And in forecasting, it runs scenario simulations and predictive budget allocation in something close to real time. BCG's research shows leading marketers are twice as likely to embed AI into the core of their measurement approach — and deliver up to 70% higher revenue growth as a result.
How do open measurement ecosystems improve transparency?
Open measurement places the data, the definitions, and the comparison logic on the advertiser's side rather than the platform's. The advertiser sets attribution rules that apply consistently across channels, owns the identity graph that connects user behavior across platforms, and evaluates inventory on transparent supply-path data rather than platform-reported claims. The practical effect is a framework that can compare channels on equal terms, defend budget allocation against finance-level scrutiny, and move spend toward what is actually working rather than what looks best inside any individual vendor's dashboard.
Have other questions?
If you have more questions, contact us so we can help.

.svg)
.svg)