How to Measure Incrementality in Marketing Campaigns


When a chief executive asks the marketing team what drove last quarter's growth, the honest answer is often a shrug dressed up as a report. Platforms supply confident numbers, dashboards fill with conversions, and yet the link between media spend and business outcomes stays stubbornly unclear. Forrester's 2026 research, surveying a thousand marketing professionals, found that measuring the return on marketing was their single biggest challenge, named by 33%, ahead of budget constraints at 24%. The tools have multiplied; the confidence has not kept pace.
Attribution produces this outcome by design. Platforms reward channels for being present at the moment of conversion rather than for causing it. A customer who already intended to buy clicks a retargeting ad on the way to checkout, and the platform files that sale under retargeting. Branded search captures someone who typed your name into Google, and the campaign claims the credit. Reported performance looks healthy, money keeps flowing toward whichever channel sits closest to the sale, and genuine business impact goes unmeasured. The distance between reported performance and real contribution is where wasted budget accumulates.
Incrementality measurement takes a different starting point. Rather than asking which touchpoint deserves credit, it asks a harder and more useful question: how many of these conversions would have happened anyway, with no advertising at all? Answering it changes how marketers allocate budget, defend investments to finance, and decide which campaigns deserve to scale.
This guide walks through:
- what incrementality measurement is,
- how the underlying logic works,
- how it compares with attribution and marketing mix modeling,
- the main testing methods available,
- the calculations that turn a test into a number,
- the channels where measurement is hardest,
- the mistakes that corrupt results unnoticed, and
- the framework that lets a business run incrementality testing as a routine part of media planning rather than a one-off experiment.
💡 Related read: Digital Marketing Measurement Across Channels: Why Modern Attribution Is No Longer Enough.
What is incrementality measurement in marketing?
Incrementality measurement is a method for identifying the true causal impact of a marketing campaign by isolating the conversions, revenue, or outcomes that would not have occurred without advertising exposure. It separates the results a campaign generated from the results that would have arrived regardless — the difference being the incremental contribution that actually justifies the spend.
The two approaches diverge most where it counts — on the budget.
- Attribution credits a channel whenever it appears in a converting customer's path.
- Incrementality in marketing strips that path back to a single test: show ads to one group, withhold them from a comparable group, and compare what each group does.
Whatever the exposed group does over and above the unexposed group is incremental. Everything else was going to happen anyway.
Marketers turn to incrementality testing because attributed performance and genuine business impact have drifted apart, and the drift almost always flatters the channels that are easiest to track. A measurement approach built on causation rather than correlation gives finance teams a number they can trust and gives media teams a reason to move money toward what works.
💡 Related reads: Incrementality vs attribution: what's the difference and why the change is happening
How incrementality measurement actually works
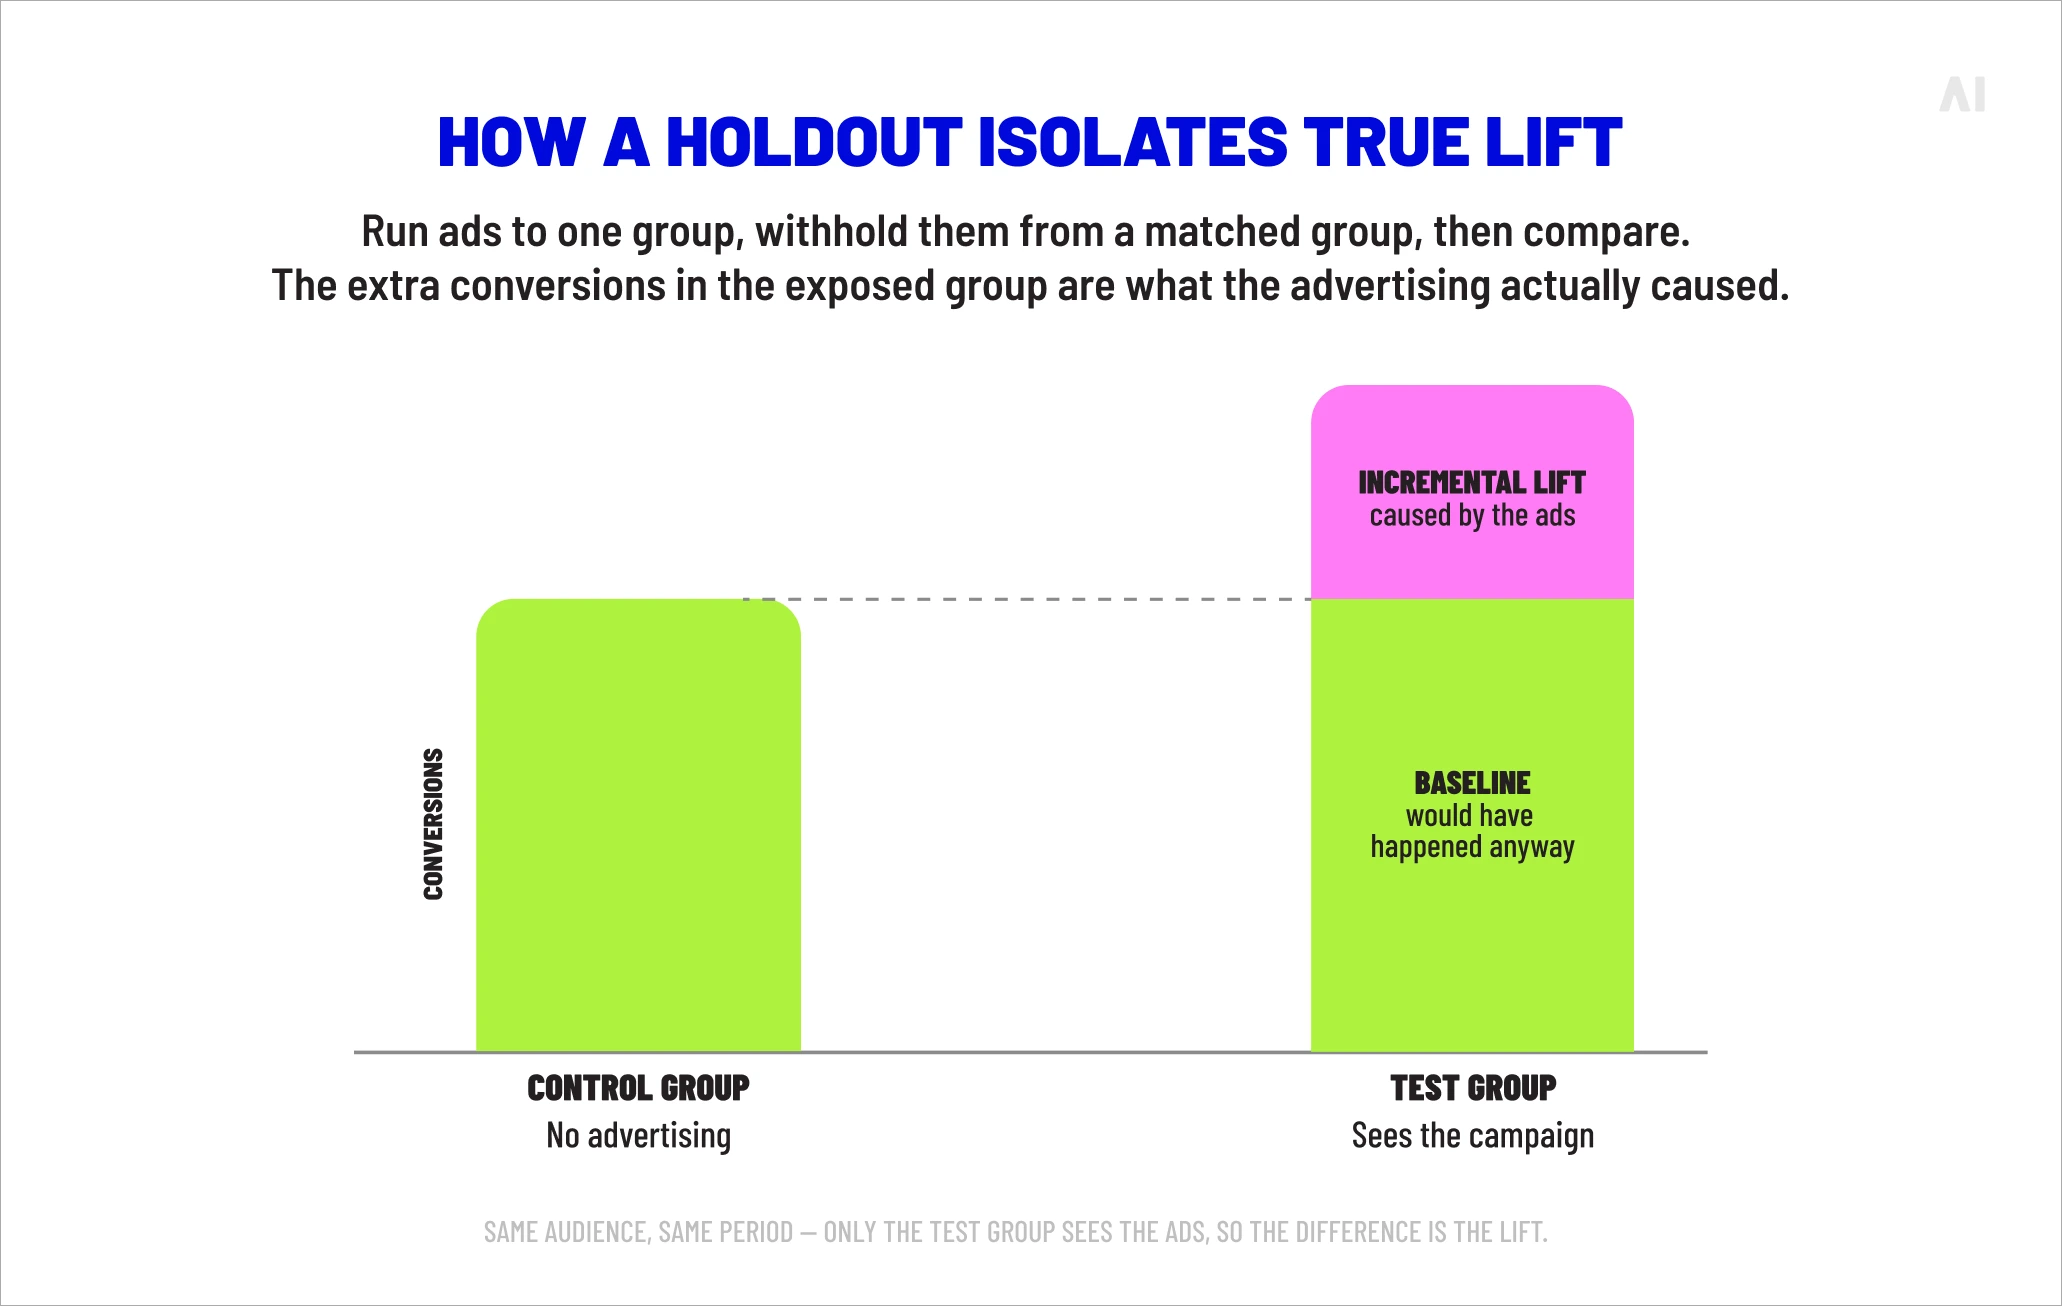
The mechanism behind incrementality measurement is the counterfactual: an estimate of what would have happened in the absence of the campaign. You cannot observe the same customers both seeing and not seeing an ad, so the method builds a stand-in for that unseen reality by holding out a comparable group from exposure.
Three components do the work.
- A control group (also called a holdout) is a randomly selected slice of the target audience that receives no advertising, serving as the baseline.
- The test group receives the campaign as normal.
- Lift analysis then measures the difference in outcomes between the two.
If the exposed group converts at a meaningfully higher rate than the holdout, that excess is the incremental effect. If both groups convert at roughly the same rate, the campaign was taking credit for conversions it never caused.
⚡ Attribution records which ad was nearby when a sale happened. Incrementality asks whether the sale needed the ad at all.
The quality of the answer depends entirely on the quality of the comparison. The two groups have to be alike in every way that affects buying behavior — demographics, intent, seasonality, prior exposure — so that the only systematic difference between them is the advertising itself.
- When the comparison holds, the lift you measure is genuinely causal.
- When it does not, through contamination or weak randomization, the result is no more trustworthy than the attribution it was meant to improve on.
Incrementality vs. attribution vs. MMM: choose the right approach
Attribution, incrementality testing, and marketing mix modeling are often discussed as competitors, which leads teams to pick one and treat it as the source of truth. They are better understood as three instruments tuned to three different questions.
- Attribution explains the path inside a customer journey.
- Incrementality proves causation for a specific campaign or channel.
- Marketing mix modeling estimates the contribution of every channel to the business over time.
Choosing the right approach starts with knowing which question you are trying to answer.

Why attribution does not prove causation
Attribution models — last-click, multi-touch, data-driven — assign fractional or full credit to the touchpoints that appear in a converting path. That is useful for understanding sequence and for in-flight optimization within trackable digital channels. It is silent on cause. A model can tell you that a display impression, a paid social click, and a branded search all preceded a purchase; it cannot tell you whether removing any of them would have changed the outcome. Because attribution only ever sees the journeys that ended in conversion, it systematically over-credits the channels that sit nearest the finish line and under-credits the upper-funnel activity that created the demand in the first place.
💡 Related reads: Unified marketing measurement: why attribution alone no longer works | Marketing attribution challenges: why traditional attribution models don't work.
Where MMM fits into marketing measurement
Marketing mix modeling works at the aggregate level, using historical data on spend, impressions, pricing, seasonality, and external factors to estimate how each channel has contributed to outcomes over months or years. It handles offline media, long time horizons, and the interaction effects between channels that user-level tracking misses entirely. What it does not offer is campaign-level precision or speed. MMM is a planning instrument — strong on the strategic question of how much to put into television versus search across a year, weak on the tactical question of whether last month's retargeting campaign earned its keep.
When marketers use all three together
The strongest measurement programs run the three approaches in concert: MMM for strategic allocation, attribution for tactical optimization, and incrementality testing to validate cause and to calibrate the other two. Used this way, a quarterly geo holdout becomes the reference point that corrects an MMM's coefficients or checks an attribution model's assumptions.
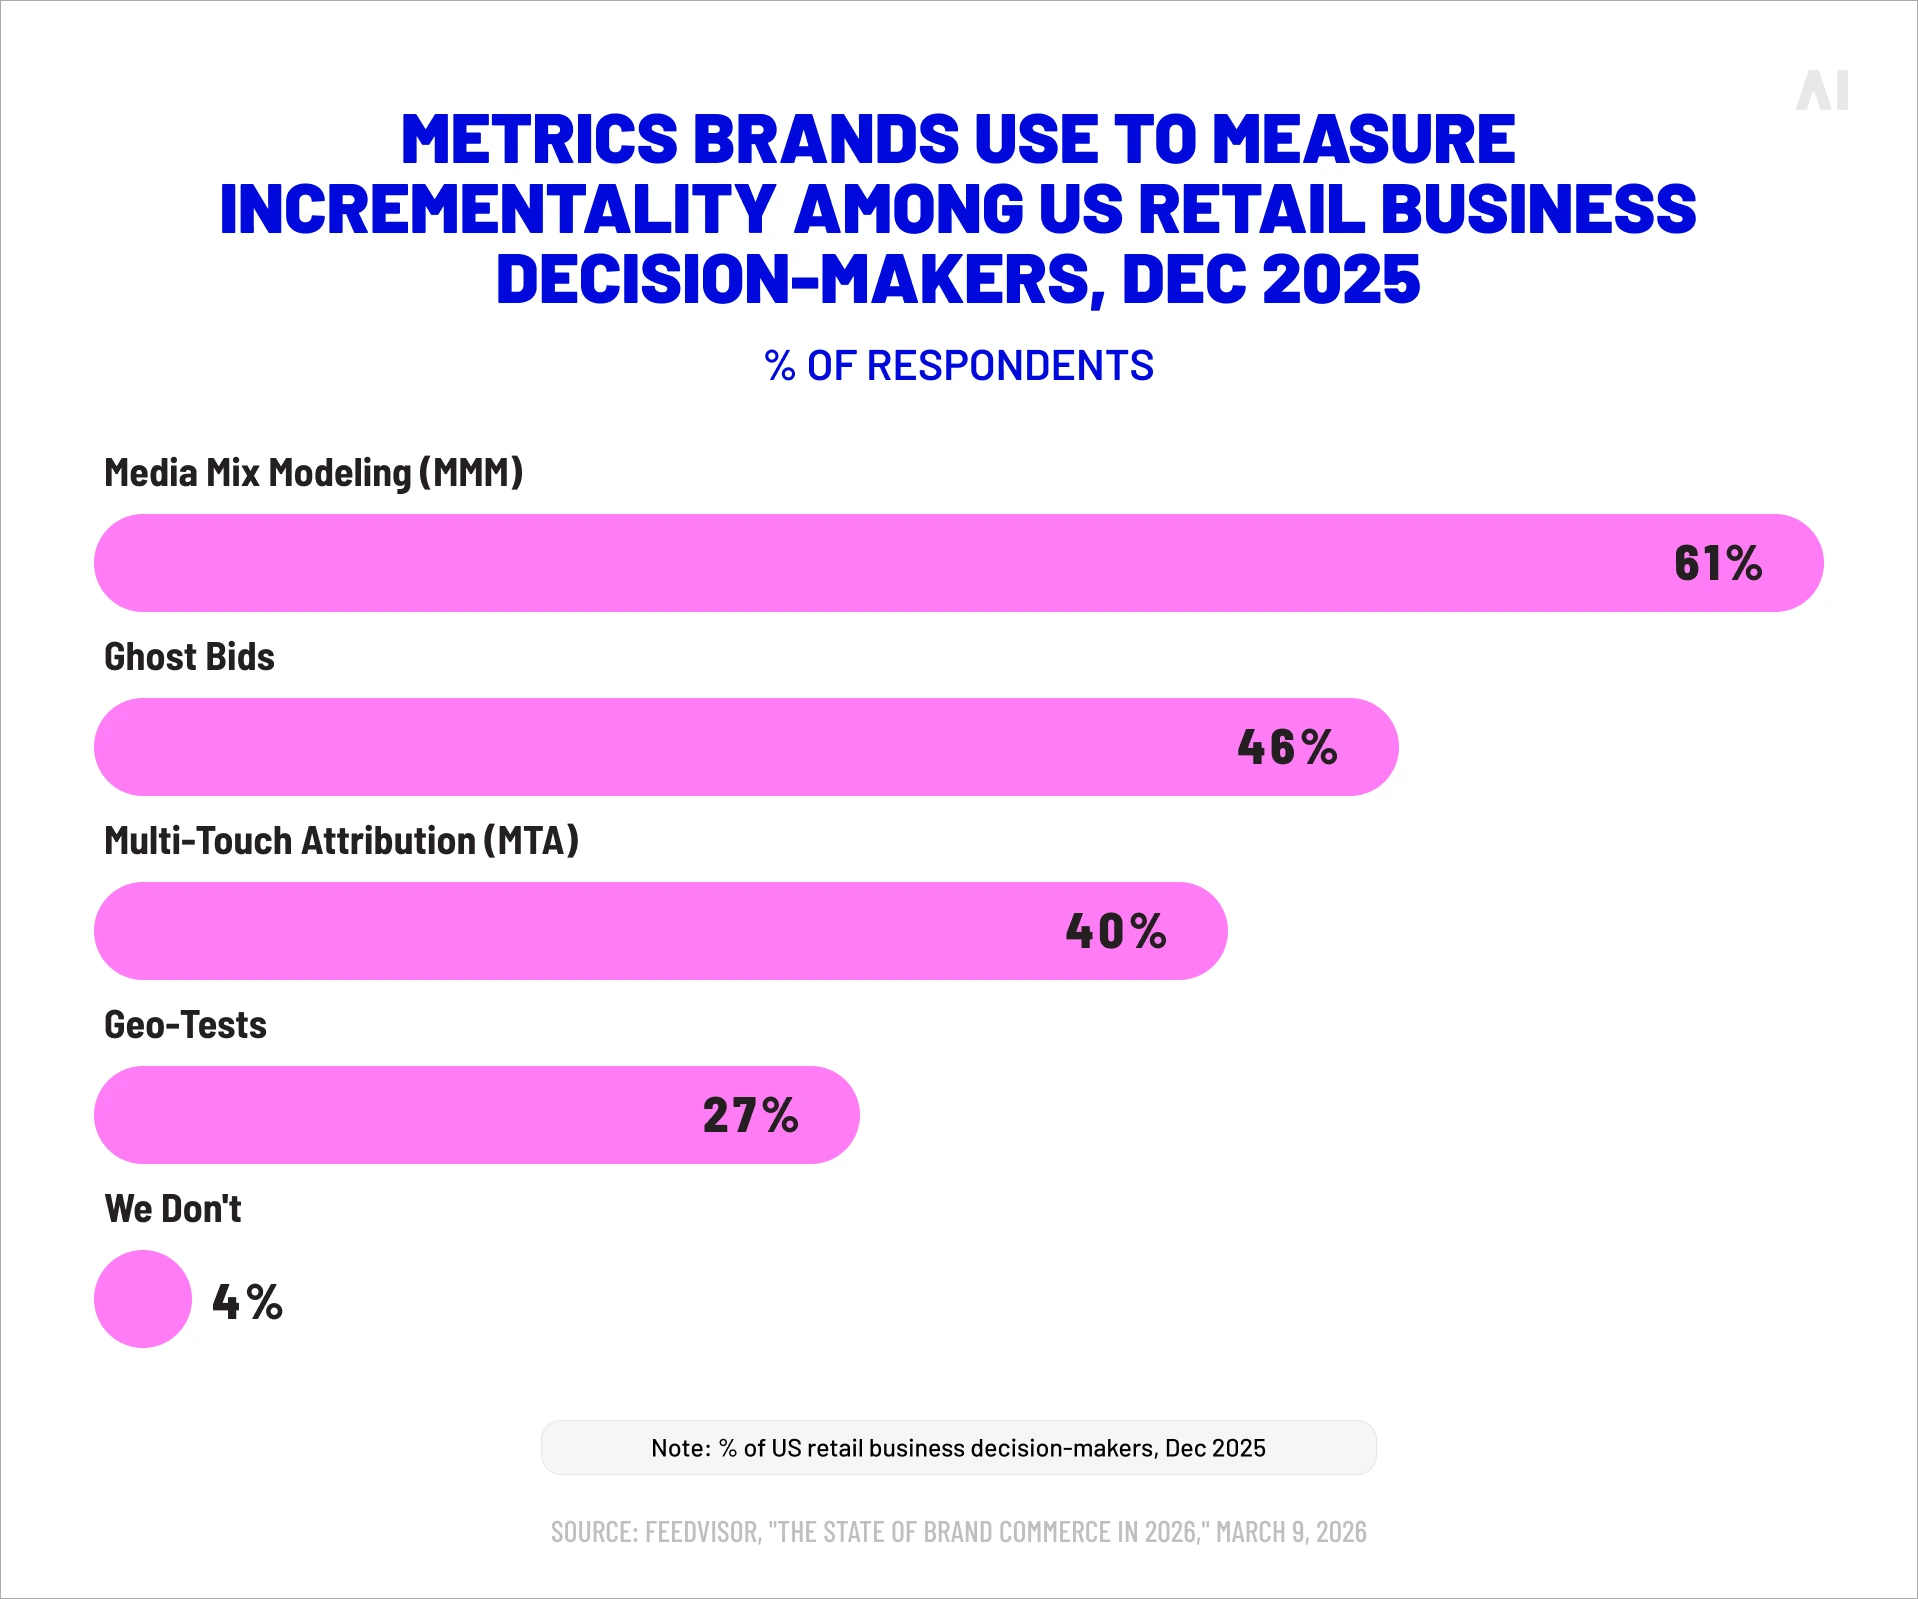
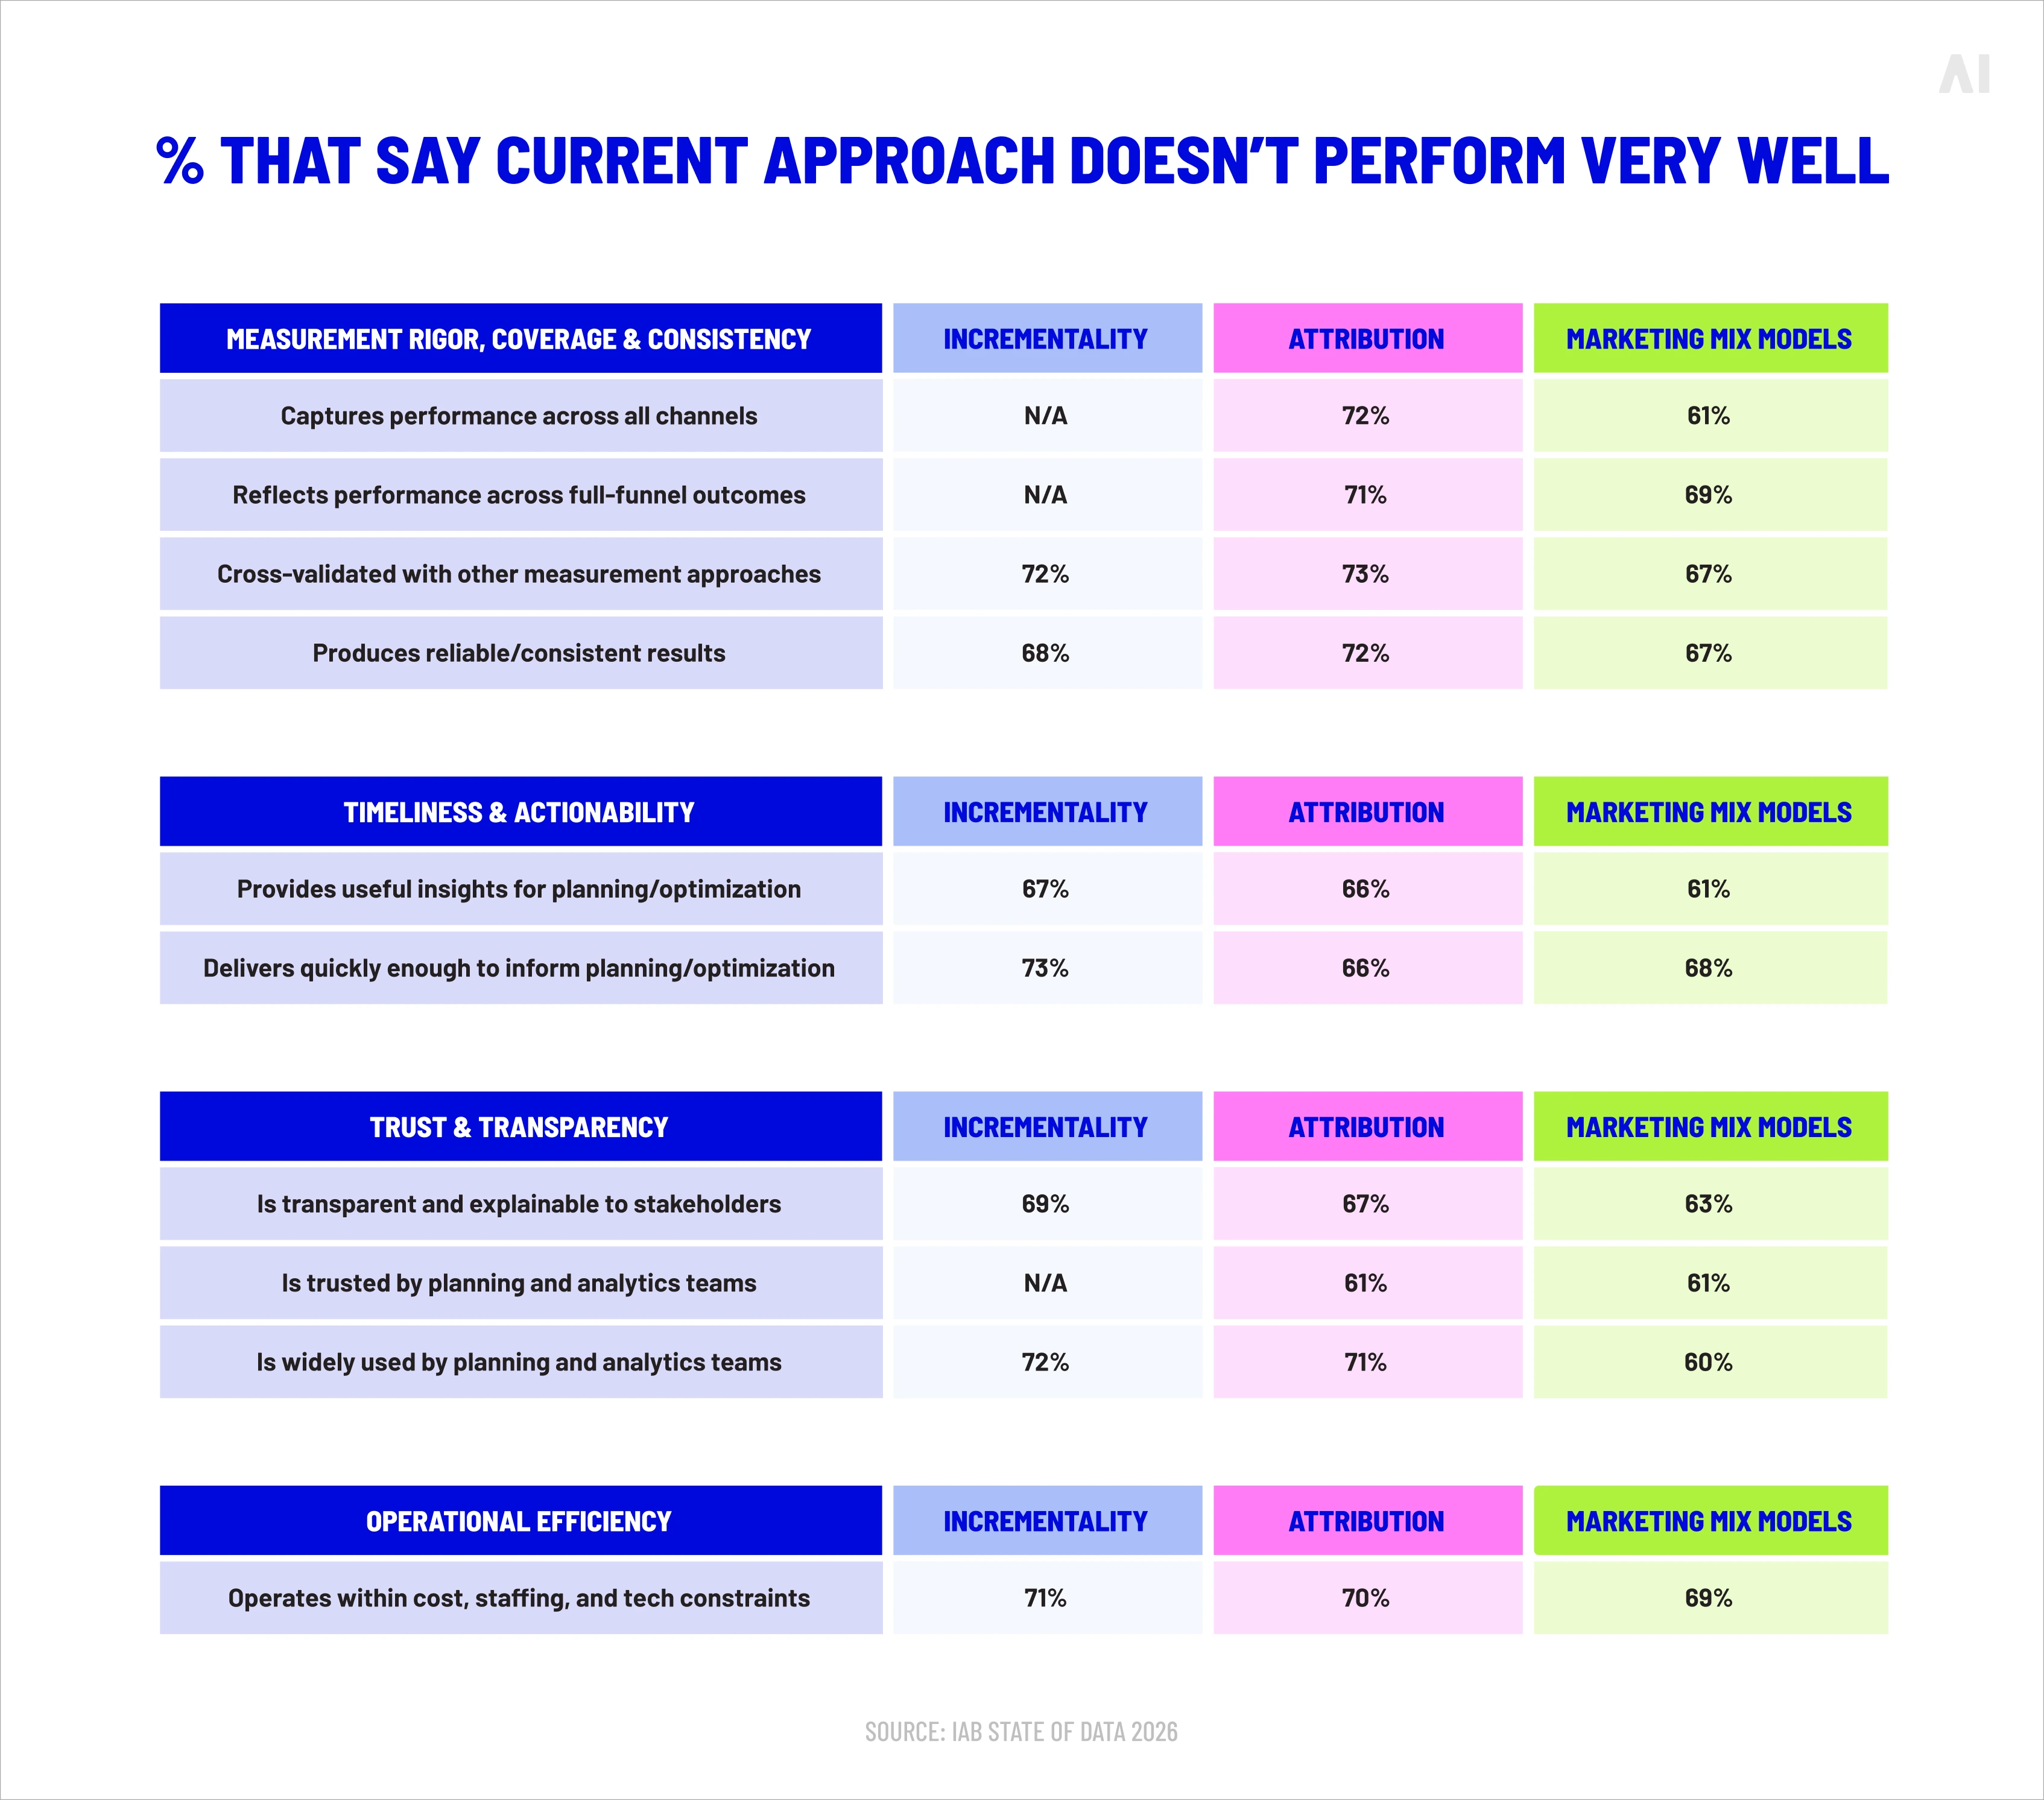
The practice is still rare. The IAB's State of Data 2026 report, based on more than 400 senior buy-side decision-makers, found that only 39% of organizations use attribution, incrementality, and MMM together, despite the three being complementary rather than interchangeable. Most teams own the instruments but have not learned to play them as a set.
Attribution, MMM, and incrementality compared
The table below sets the three approaches side by side. The aim is not to crown a winner but to show where each earns its place in a measurement program.
{{hmi-1}}
Read together, the three approaches answer planning, optimization, and validation in turn. A measurement program that leans on only one is making confident decisions on partial evidence.
The main methods for measuring incrementality
There is no single way to measure incrementality, and the right method depends on the scale of the campaign, the channel, and how much disruption a team can tolerate. The choices run from the statistically pristine to the practically convenient, and each carries a trade-off between rigor and ease. The table that follows summarizes the field; the sections beneath it add the detail decision-makers need.
{{hmi-2}}
Gold standard: randomized controlled trials (RCTs)
The randomized controlled trial is the most reliable way to measure incrementality because it borrows the logic of a clinical study. A target audience is split at random into a treatment group that sees the campaign and a holdout that does not, and because assignment is random, the two groups are statistically identical before the ads run. Any difference in conversions afterward can be attributed to the advertising with real confidence. Scale is what limits the method: RCTs need large, cleanly segmented audiences to reach statistical validity, which makes them well suited to high-volume channels and awkward for smaller campaigns or fragmented audiences where the holdout would be too thin to trust.
Geo-lift and matched market testing
When user-level randomization is not possible — because a channel offers no reliable user identifiers, or because the campaign is built for reach rather than targeting — geo-lift testing offers a practical alternative. The method runs ads in a set of regions while holding out a comparable set, then compares outcomes between them. A brand might keep a campaign live across Dallas, Phoenix, and Seattle while going dark in Austin, Portland, and Denver, then read the difference in sales.
Geo testing suits broad awareness campaigns and channels with limited audience data, and it works without tracking individuals. Regions differ in ways unrelated to advertising, though, so careful matching — and ideally rotating which markets serve as controls — is what keeps the result honest.
💡 Related reads: The future of location-based marketing: from geo-targeting to location intelligence | Geotargeting in 2026: how location intelligence drives measurable business growth.
Platform-native conversion lift studies
Meta, Google, and TikTok all offer built-in conversion lift tools that split exposed and holdout groups inside their own environments. These tools are easy to reach for: no third-party setup, results delivered in the platform's own dashboard, and falling barriers to entry. Google has reduced the minimum spend for a Conversion Lift study from roughly $100,000 to about $5,000 using Bayesian methods, putting native testing within reach of far smaller advertisers. What they cannot offer is independence.
A platform measuring its own incremental value has an obvious interest in the answer, and because each platform sees only its own data, native studies cannot account for the conversions a holdout customer reached through a different channel. They are a reasonable starting point and a poor final word.
Causal inference models
For teams that need a continuous read on incrementality without repeatedly going dark, causal inference models offer a modeled counterfactual rather than an experimental one. Synthetic control constructs a stand-in for the treated market by weighting a combination of untreated markets that, together, track its pre-campaign behavior. Difference-in-differences compares the change in a treated group against the change in a control group over the same period, isolating the campaign's effect from broader trends.
These methods trade the clean randomization of an RCT for the ability to run measurement alongside live campaigns, which is why sophisticated teams increasingly pair them with periodic experiments that keep the models honest.
How to measure marketing incrementality with reliable testing
Knowing the methods is the easy part. Producing a result a finance director will act on means running the test as a disciplined process rather than a casual experiment. Five stages turn the theory into a number worth trusting.
- Form a clear hypothesis. State what you expect the campaign to lift, by roughly how much, and over what period, before you begin. A vague test produces a vague result.
- Build a clean control group. Randomly assign a holdout from the same audience, large enough to detect the effect you expect and protected from accidental exposure through other channels.
- Execute without contamination. Keep the test and control conditions stable, and resist the urge to change targeting, creative, or budget mid-flight.
- Run for the right duration. Give the test long enough to capture the channel's full conversion window and to reach statistical significance, but not so long that seasonality distorts it.
- Analyze the lift and act on it. Calculate incremental conversions, lift, and incremental return, confirm the result is statistically significant, and feed it into the next round of budget decisions.
The stages compound on one another. A clean design with a contaminated holdout is worthless, and a perfectly run test read over too short a window will mislead just as badly. Rigor at every step is what produces a number worth acting on.
How to calculate incremental lift
The calculation behind every incrementality test is a comparison of conversion rates between the exposed and held-out groups.
To make it concrete, take a retargeting campaign — the channel where reported and real performance diverge most sharply. Suppose 50,000 users are exposed to the campaign and a matched 50,000 are held out. The exposed group converts at 4.2%, producing 2,100 conversions. The holdout converts at 3.6%, producing 1,800. The difference of 300 conversions is the incremental result. The other 1,800 conversions among the exposed group would have happened without any advertising — they are the conversions attribution would have proudly claimed.
That one comparison changes the picture entirely. Attribution would log all 2,100 conversions as retargeting's work. Incrementality shows that only 300 of them, fewer than one in six, actually depended on the ads.
The incremental lift formula
The incremental lift calculation expresses that difference as a percentage, which makes results comparable across campaigns of different sizes:
Incremental lift = (Test conversion rate − Control conversion rate) ÷ Control conversion rate × 100
Applying the figures above:
(4.2% − 3.6%) ÷ 3.6% × 100 = 16.7%
The campaign produced a 16.7% lift in conversions among the audience it reached. That is the honest headline — the share of additional conversions the advertising genuinely caused, expressed in a form that lets you stack this campaign against the next one regardless of scale.
A relative lift of 16.7% sits beside the absolute figure of 300 incremental conversions; both belong in the read, because a large relative lift on a tiny base can flatter as easily as a small one on a large base can hide real value.
Calculating incremental ROAS (iROAS)
Lift answers how many extra conversions a campaign caused. Incremental return on ad spend answers what those conversions were worth against what they cost, which is the figure that should govern budget. The calculation is straightforward: divide incremental revenue by campaign spend.
Continue the retargeting example. The 300 incremental conversions, at an average order value of $300, generated $90,000 in incremental revenue. The campaign cost $45,000. Incremental ROAS is therefore:
$90,000 ÷ $45,000 = 2.0x
Now compare that with the reported figure. The platform credits all 2,100 exposed conversions, worth $630,000, against the same $45,000 spend — a reported ROAS of 14x. The dashboard celebrates a fourteen-fold return; the holdout reveals a two-fold one. Both numbers are arithmetically correct, but only one reflects the money the campaign actually made. iROAS is the more honest metric precisely because it refuses to count conversions the campaign did not earn.
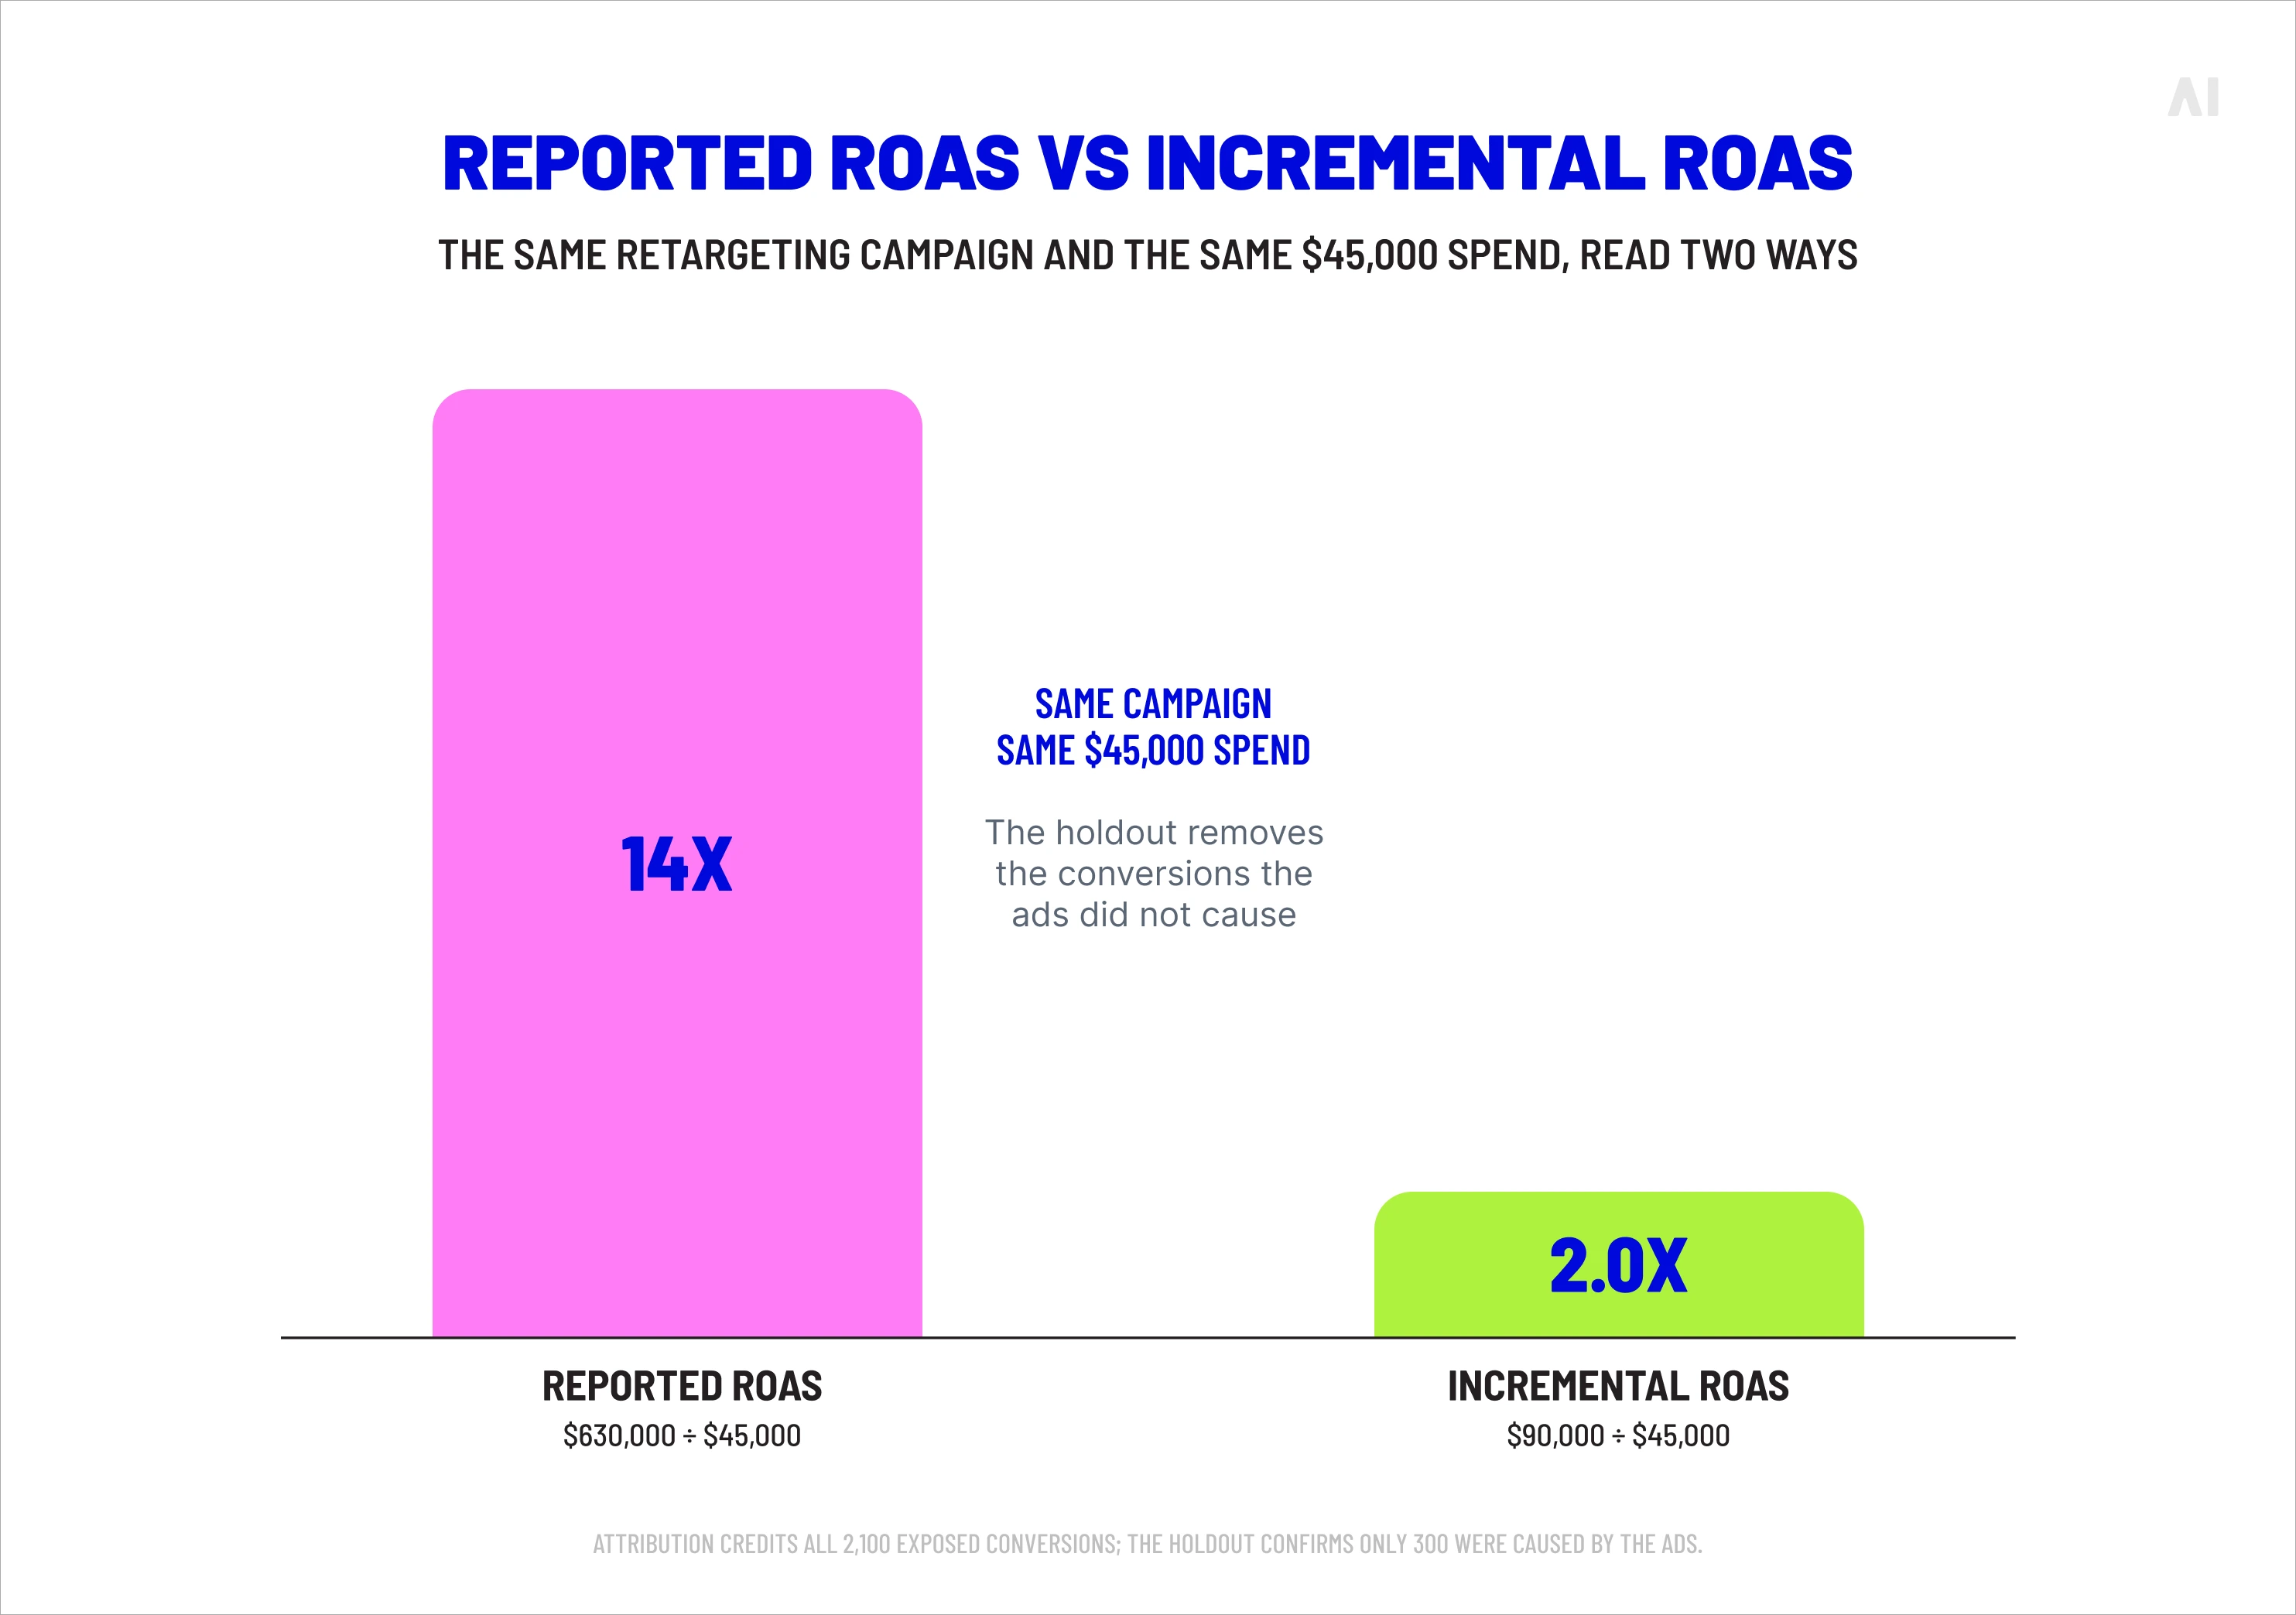
⚡ A reported 14x return and a real 2x return can describe the same campaign. The difference is the part the holdout removes.
How statistical significance validates incrementality results
A measured lift means nothing until you can rule out chance. Statistical significance is the test that separates a genuine incremental effect from random variation between two groups. Four ideas carry most of the weight.
- A confidence interval gives the range the true lift is likely to fall within — a 16.7% lift with a 95% interval of 12% to 21% is far more useful than a bare point estimate.
- A p-value estimates the probability of seeing a difference this large if the campaign had no real effect; the lower it is, the safer the conclusion.
- The minimum detectable effect is the smallest lift your test is powerful enough to catch, which depends directly on sample size — smaller audiences can only confirm larger effects.
A test that is underpowered will return inconclusive results not because the campaign failed but because the experiment was never built to see the truth.
Best marketing channels for incrementality measurement
Incrementality testing applies across every channel, but the value of running it varies enormously, because some channels over-report far more than others and some resist clean measurement altogether. The pattern is consistent: the easier a channel is to track, the more credit it tends to claim, and the more incrementality testing has to offer. The table below maps where attribution distorts most and which method fits each channel, before the sections that follow examine the trickiest cases.
{{hmi-3}}
💡 Related reads: CTV measurement
Paid social and retargeting
Retargeting is the clearest case of a channel paid to take credit for work it did not do. By design, it shows ads to people who have already visited a site or added an item to a cart — an audience defined by existing intent. When those high-intent shoppers convert, as many of them would have regardless, the platform records each sale as a retargeting win. The worked example above is typical: a holdout routinely reveals that a large share of retargeting conversions were inevitable. Incrementality testing is the only way to find the genuine remainder, and the gap it exposes often separates a campaign that earns its budget from one that only appears to.
Branded search
Branded search raises a similar question in a different form: when someone searches for your brand by name and clicks your ad, did the campaign create that demand or simply intercept it on the way to a sale that was already coming? Often the demand was generated elsewhere. Analytic Partners' ROI Genome research, drawn from analysis across hundreds of brands, found that around 30% of paid search clicks are driven by other advertising, much of it video that prompted the search in the first place. A branded-search holdout — pausing brand bids in selected markets and watching whether organic results catch the same traffic — separates the demand a campaign creates from the demand it merely collects.

CTV and upper-funnel campaigns
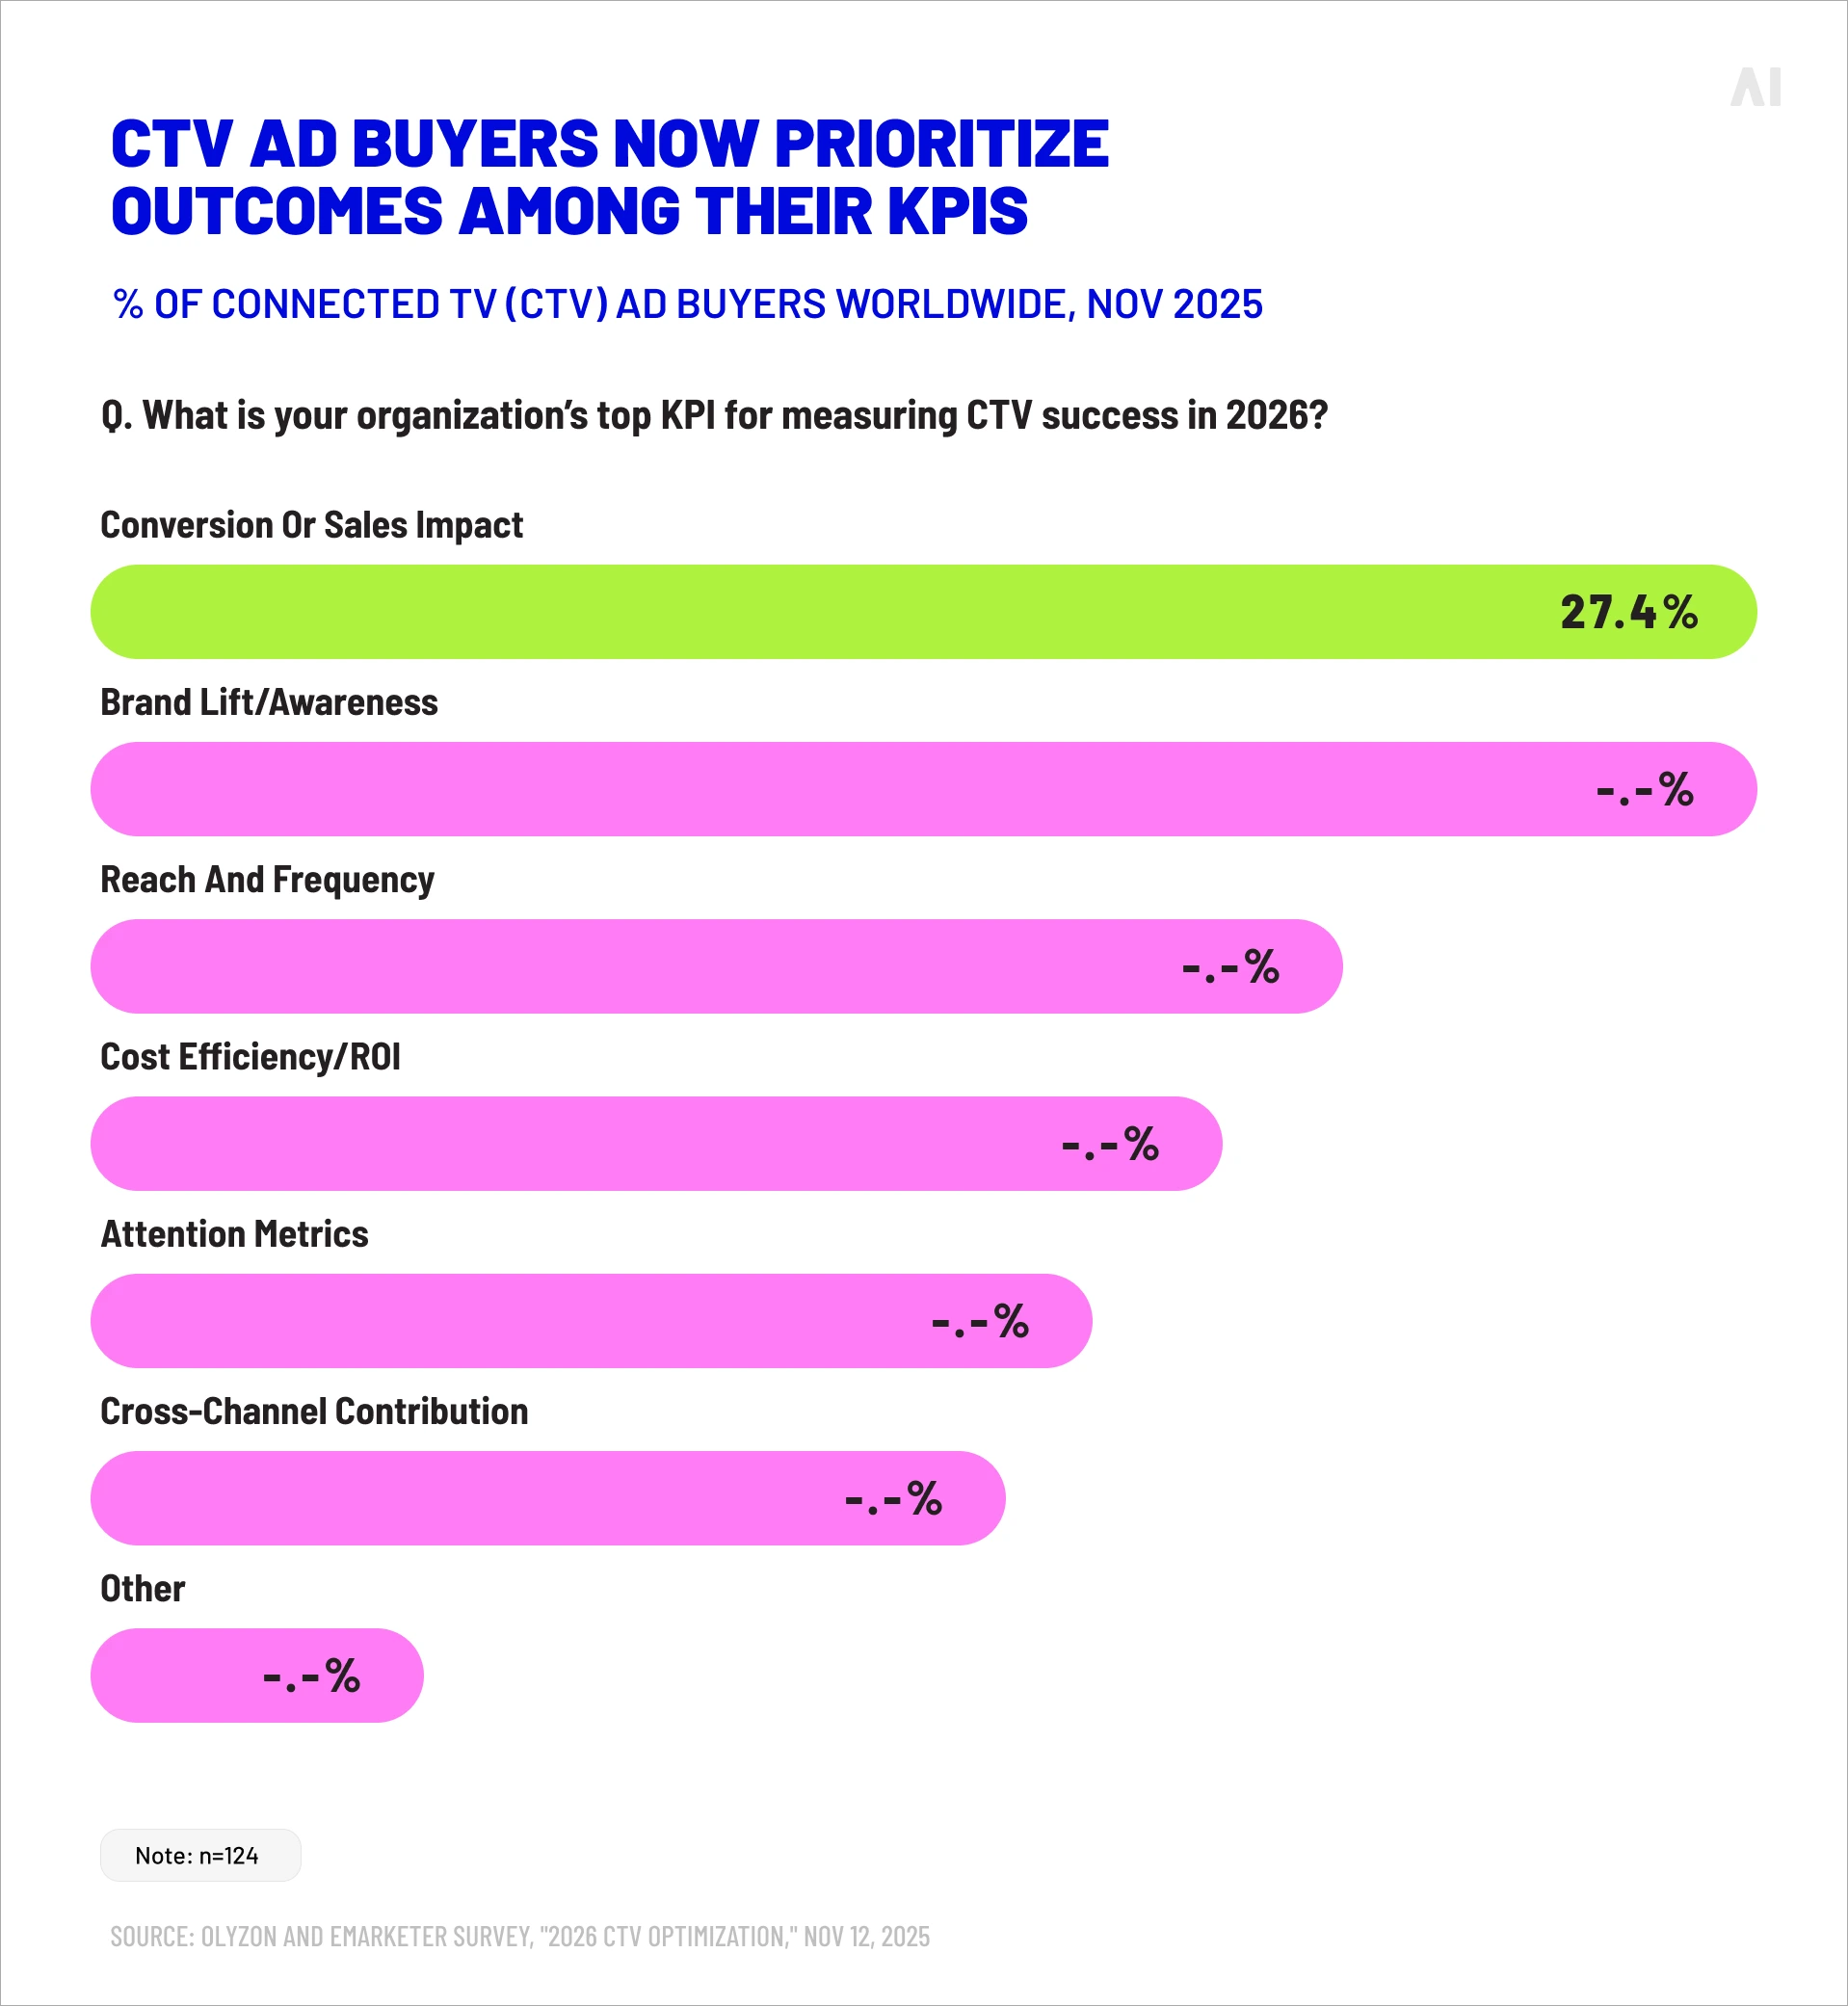
Connected TV and other awareness channels present the opposite problem. They rarely sit in the last-click path, so attribution under-credits them, yet their real influence is genuinely hard to see because it surfaces downstream, in search queries and site visits that follow exposure by days or weeks. Measuring incrementality here means leaning on geo-holdouts, tracking lift in branded search after a flight runs, and following downstream performance signals rather than waiting for a click that upper-funnel media was never designed to produce. The methods are less tidy than a user-level holdout, but they are the only way to value the channels that build the demand everything else converts.
💡 Related read: Performance TV advertising.
Mistakes that distort incrementality measurement
Incrementality testing is only as trustworthy as its design, and a handful of recurring errors can turn a rigorous-looking study into a confident falsehood. The most common are worth naming, because each one inflates results in a way that rewards the wrong decision.
- Audience contamination. When the holdout group is exposed to the campaign through another channel — a customer held out of paid social who still sees the display ads — the baseline rises, the measured lift shrinks, and the test understates a real effect. Clean separation across all channels is what keeps the comparison valid.
- Underpowered tests. A holdout too small to detect the expected effect returns inconclusive or noisy results that get misread as findings. Sample size has to be set against the minimum detectable effect before the test begins, not discovered afterward.
- Seasonal bias. Running a test across a holiday, a promotion, or a demand spike lets external swings masquerade as campaign lift. Test windows should sit on stable ground or stretch long enough to absorb the variation.
- Over-reliance on platform-reported lift. Treating a walled platform's own conversion-lift study as the final answer reintroduces exactly the conflict of interest that incrementality testing exists to remove.
Each mistake biases the result in the same flattering direction, which is precisely why they slip through: a corrupted test seldom announces itself, and an inflated lift reads as success. Building review into the process — a second pair of eyes on the design before launch — catches more of these than any after-the-fact correction.
💡 Related reads: The Problem with Platform-Reported Data: Why You Can’t Trust the Numbers.
How incrementality improves marketing budget decisions
The point of measuring incrementality is practical: it changes how money gets allocated. Once a team can see which campaigns generate net-new outcomes and which collect credit for conversions that were always coming, budget decisions stop being a negotiation over dashboards and become a response to evidence.
Using iROAS to guide budget allocation
Incremental ROAS gives marketers a benchmark that platform-reported ROAS cannot: a measure of return that counts only the revenue a campaign actually produced. Ranking channels by iROAS rather than reported ROAS routinely reorders priorities — a retargeting line that looked like the portfolio's star at 14x reported falls behind an upper-funnel channel once both are read on incremental terms. Allocating against iROAS moves money toward the campaigns that genuinely grow the business and away from those that have been coasting on inevitable conversions. For decisions at the margin, incremental contribution rather than incremental revenue is the sharper guide, since order value and return rates can differ between exposed and held-out customers.
Why incrementality testing should be ongoing
A single test captures one channel, one audience, and one moment. Markets move, creative fatigues, competitors change their spending, and a lift measured last spring may not hold this fall. Treating incrementality as a one-time exercise produces a snapshot that ages badly. The teams that get the most from it run tests on a rotating calendar across channels and audiences, so that allocation rests on current evidence rather than a finding that was true once.
⚡ A single test is a snapshot. Confidence comes from testing the same channels, again and again, as conditions change.
Why incrementality is becoming essential for modern marketing
The pressures pushing incrementality from a specialist technique toward a standard of proof are the same ones eroding older measurement.
- Privacy regulation and signal loss have thinned the user-level data that attribution depends on.
- Customer journeys span more channels and devices than any single platform can see.
- And platform self-reporting keeps inflating the same channels it has always favored.
Against that backdrop, a method grounded in controlled comparison rather than tracked identifiers holds up where attribution buckles. Nielsen's 2025 research underlines how far there is to go: only 32% of marketers globally measure their spending holistically across digital and traditional channels.
💡 Related read: Data fragmentation in advertising.
First-party data and reliable measurement
Accurate incrementality measurement increasingly depends on a brand's own first-party transaction and conversion data rather than on platform-reported metrics. When the conversions feeding a test come from a company's own systems — verified sales, confirmed sign-ups — the lift calculation rests on ground truth instead of a vendor's interpretation of it. First-party data also survives the privacy changes that are dismantling third-party tracking, which makes it the more durable foundation as well as the more honest one.
Privacy-safe measurement in a cookieless environment
Measuring incrementality without user-level identifiers is now a core requirement rather than a future concern. Clean rooms allow exposed and converted audiences to be compared inside a privacy-protected environment without exposing individual records. Geo-based and modeled methods sidestep identifiers altogether. Privacy-first infrastructure lets brands match advertising exposure to outcomes while honoring consent and regulation, which means causal measurement can continue even as the signals attribution relied on disappear.
The move toward always-on incrementality testing
Incrementality testing is moving from a periodic study to a continuous discipline. Automation now handles test design, monitoring, and the scheduling of retests; causal models deliver signal between formal experiments; and falling minimum spends are widening access to a practice that was once the preserve of enterprise data-science teams. All of it points the same way: measurement that runs alongside campaigns rather than pausing them, producing a steady read on causal performance instead of an occasional verdict.
Building a scalable incrementality measurement framework
Running one good test is an achievement. Running incrementality measurement as a routine part of media planning takes infrastructure — transparent measurement frameworks, clean supply paths, capable analysis tools, and connected media execution that lets results flow back into the next campaign. The components below are what move a business from occasional experiments to an operating system for causal measurement.
Better measurement starts with better data
The visibility a closed platform offers ends at the edge of its own inventory, which is exactly the limitation incrementality testing exists to overcome. Independent, cross-platform measurement gives a fuller and less self-interested view of where lift comes from. AI Digital's Open Garden framework is built on that principle, connecting advertisers across more than fifteen demand-side platforms with full transparency over where budget goes and how inventory is chosen, so that measurement reflects performance rather than a single vendor's incentives. When the data underneath a test is neutral and complete, the lift it reveals can be trusted.
Smarter supply leads to accurate measurement
Measurement is only as clean as the inventory it runs on. Invalid traffic, non-viewable impressions, and inflated supply paths corrupt a lift analysis at the source: a holdout contaminated by bot conversions or a test group reached through a chain of resold impressions produces numbers that describe the supply chain more than the campaign. AI Digital's Smart Supply curates inventory before it reaches a buyer, filtering low-quality and fraudulent traffic and shortening the path between spend and placement. Cleaner supply produces a cleaner baseline, and results measured against it hold up to scrutiny.
AI-powered tools for incrementality analysis
The analytical load of continuous incrementality measurement — segmenting audiences, running lift calculations, forecasting outcomes, reconciling results across channels — is more than manual workflows can carry at scale, which is where AI-driven platforms earn their place. AI Digital's Elevate brings that analysis into one intelligence layer, with marketing mix modeling that measures cross-channel influence and a Path to Conversion view that traces the touchpoints behind an outcome rather than crediting the last click.
The industry expects substantial value from this direction: the IAB's State of Data 2026 estimates that AI improvements to advanced measurement could add roughly $26.3 billion in media investment and $6.2 billion in productivity within one to two years. As IAB chief executive David Cohen put it at the report's launch, advanced measurement remains "still falling short of its core promise" — the gap that better tools are built to close.
Start measuring the real impact of your marketing campaigns
Attribution will tell you which channel was standing closest to the sale. It will not tell you which campaigns are growing your business, which are coasting on demand that already existed, and which could be cut tomorrow without anyone noticing in the revenue line.
Incrementality measurement answers those questions, and answering them lets a marketing budget rest on evidence rather than instinct. The teams that build causal testing into their planning spend less on the inevitable and more on the genuinely effective — and they can prove the difference when finance asks.
AI Digital helps brands and agencies put that into practice, from transparent cross-platform execution through the Open Garden framework to curated supply with Smart Supply and AI-driven analysis in Elevate. If you want to measure what your campaigns actually cause rather than what they happen to be near, get in touch to talk through what we do.