What is Marketing Mix Modeling (MMM) and How It Works

%2520and%2520How%2520It%2520Works.webp)
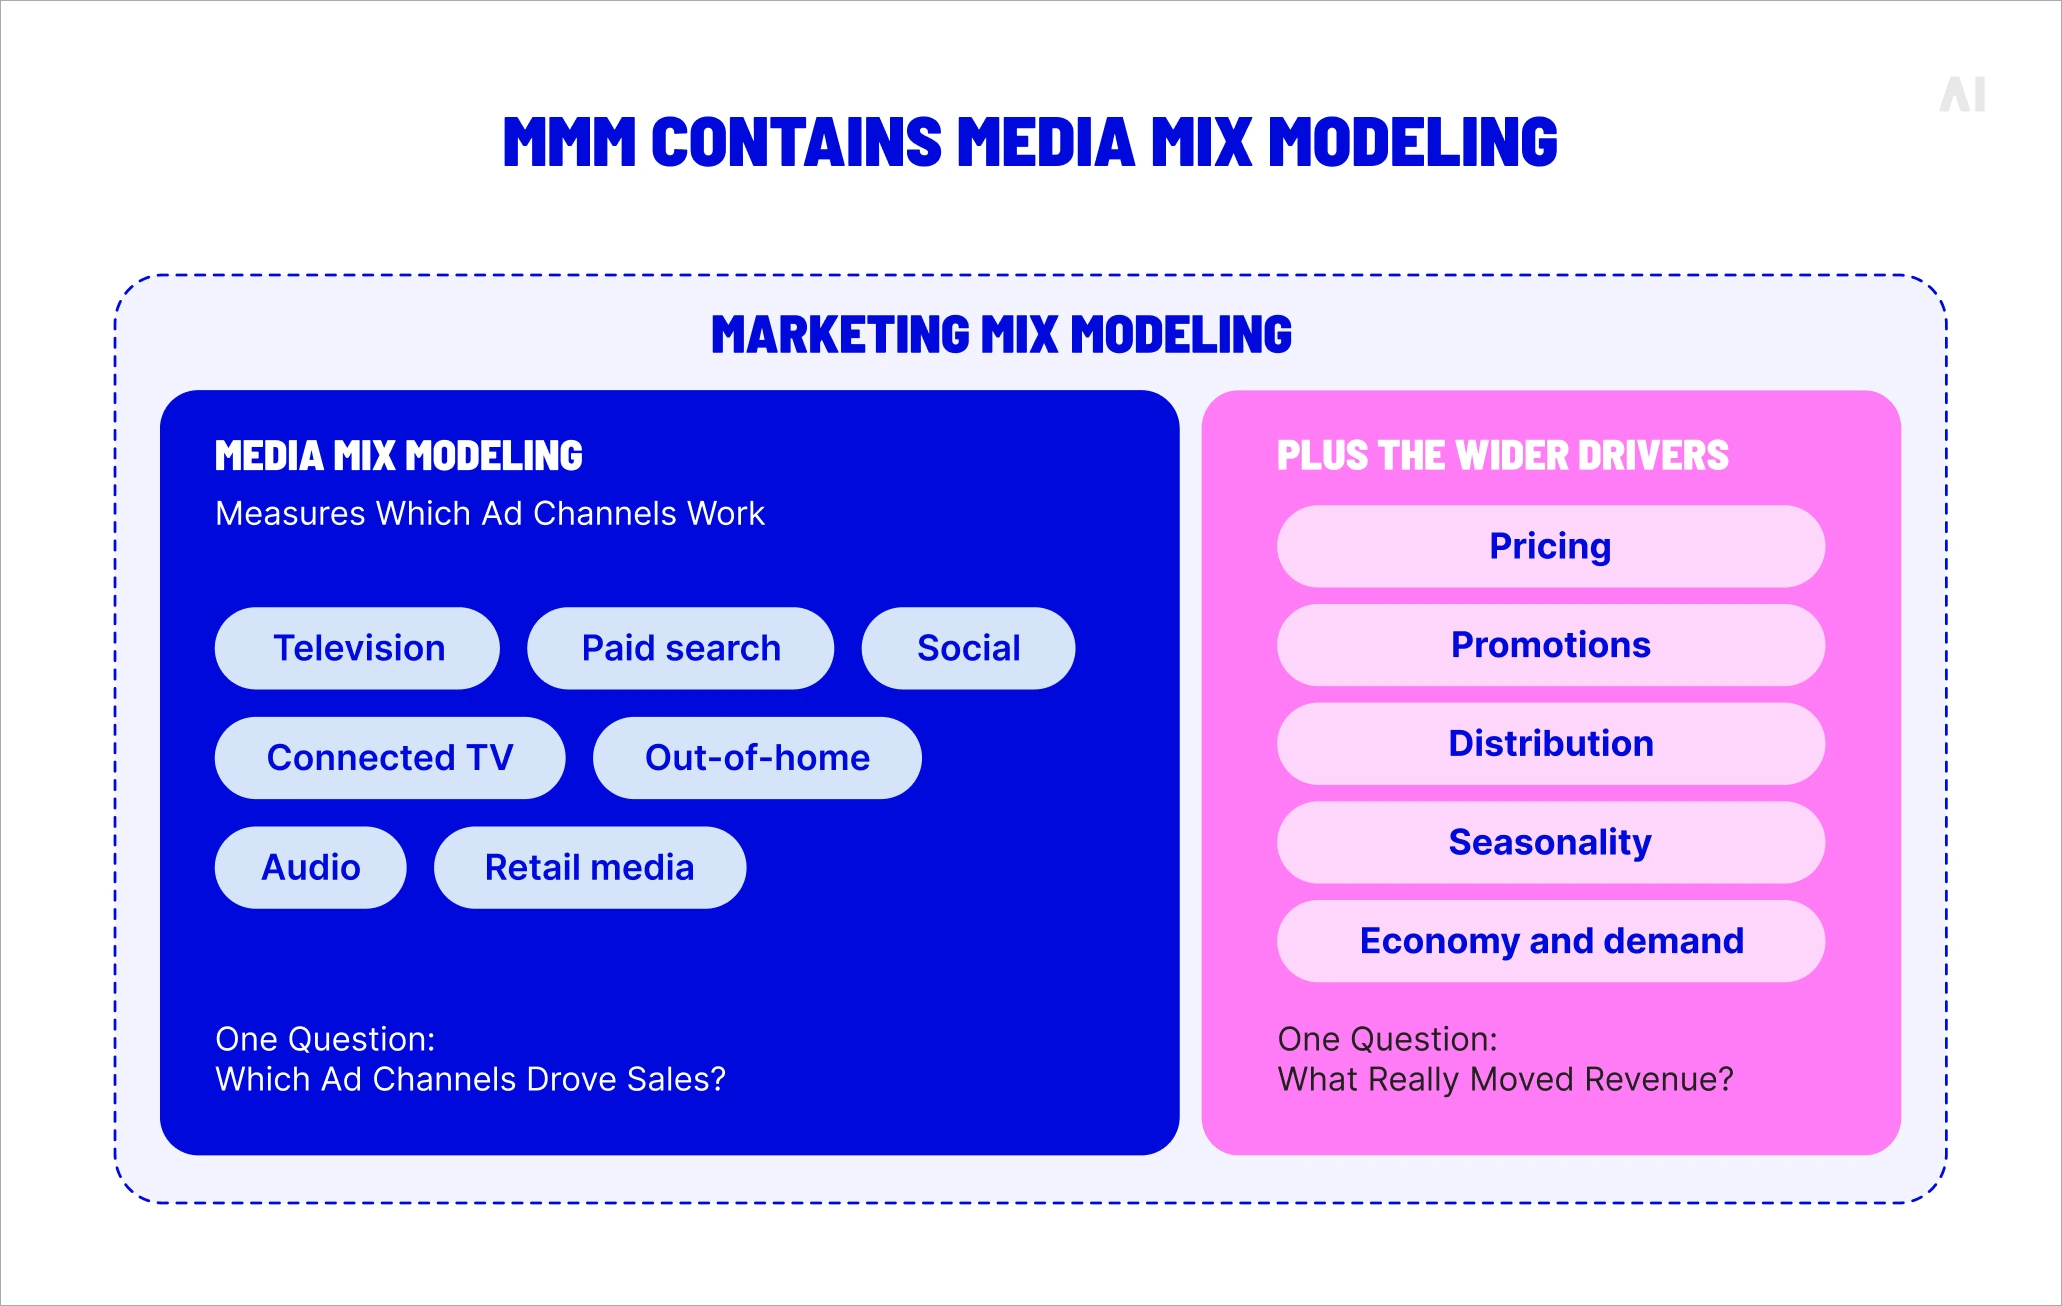
The name causes some confusion, much of it deserved. Media mix modeling measures how advertising channels — television, paid search, social, connected TV — contribute to sales. Marketing mix modeling asks a larger question. It treats advertising as one input among many and sets it beside price changes, promotions, distribution, seasonality, competitor activity, and the state of the wider economy, then estimates how each of those forces contributed to revenue. The two terms get used interchangeably across the industry, including by people who ought to know better, but the difference is real: media mix modeling is a subset of marketing mix modeling, in the way a chapter is a subset of a book.
Interest in the method has climbed steeply over the past two years, for reasons that have less to do with fashion than with necessity. As third-party cookies have crumbled and Apple's privacy changes have starved digital platforms of the user-level signals they once traded on, the click-based attribution that ruled the 2010s has become less and less reliable. MMM, which never needed to follow individuals in the first place, has aged well by comparison. It is now the method many organizations lean on for budget allocation, performance evaluation, forecasting, and longer-term planning — the questions a chief financial officer tends to ask, rather than the ones a campaign dashboard answers.
What is marketing mix modeling (MMM)?
Marketing mix modeling is a statistical approach that quantifies how marketing activities and broader business factors influence revenue and other performance outcomes. Rather than tracking the path of any individual customer, it analyzes aggregated, historical data — spend, impressions, price, promotions, sales, external conditions — and uses regression to estimate how much each input contributed to the result.
The modern version of the method is broader than its media-measurement origins suggest. Gartner defines MMM as a discipline that quantifies the holistic impact of marketing while accounting for business factors such as inventory availability or physical footprint, and external factors such as consumer perception, competitive activity, and macroeconomic conditions. That breadth is the point. A model that only measures media will tell you your television campaign drove a strong quarter; a model that also accounts for the 15% price cut you ran at the same time will tell you whether the television campaign deserves the credit.
Why marketers are returning to MMM
Marketers are returning to MMM because the measurement approach that replaced it has stopped working. Multi-touch attribution depended on following people across sites and devices, stitching together a journey from first impression to final click. Third-party cookie deprecation, Apple's App Tracking Transparency prompt, and tightening consent rules have shredded that journey. When you can observe only a minority of the people you reach, fractional credit stops being measurement and becomes educated guesswork.
MMM sidesteps the problem entirely. Because it works on aggregate data — total spend against total outcomes — it needs no cookies, no device graphs, and no consent banners. A property that once looked like a weakness against the granularity of attribution is now its main advantage.
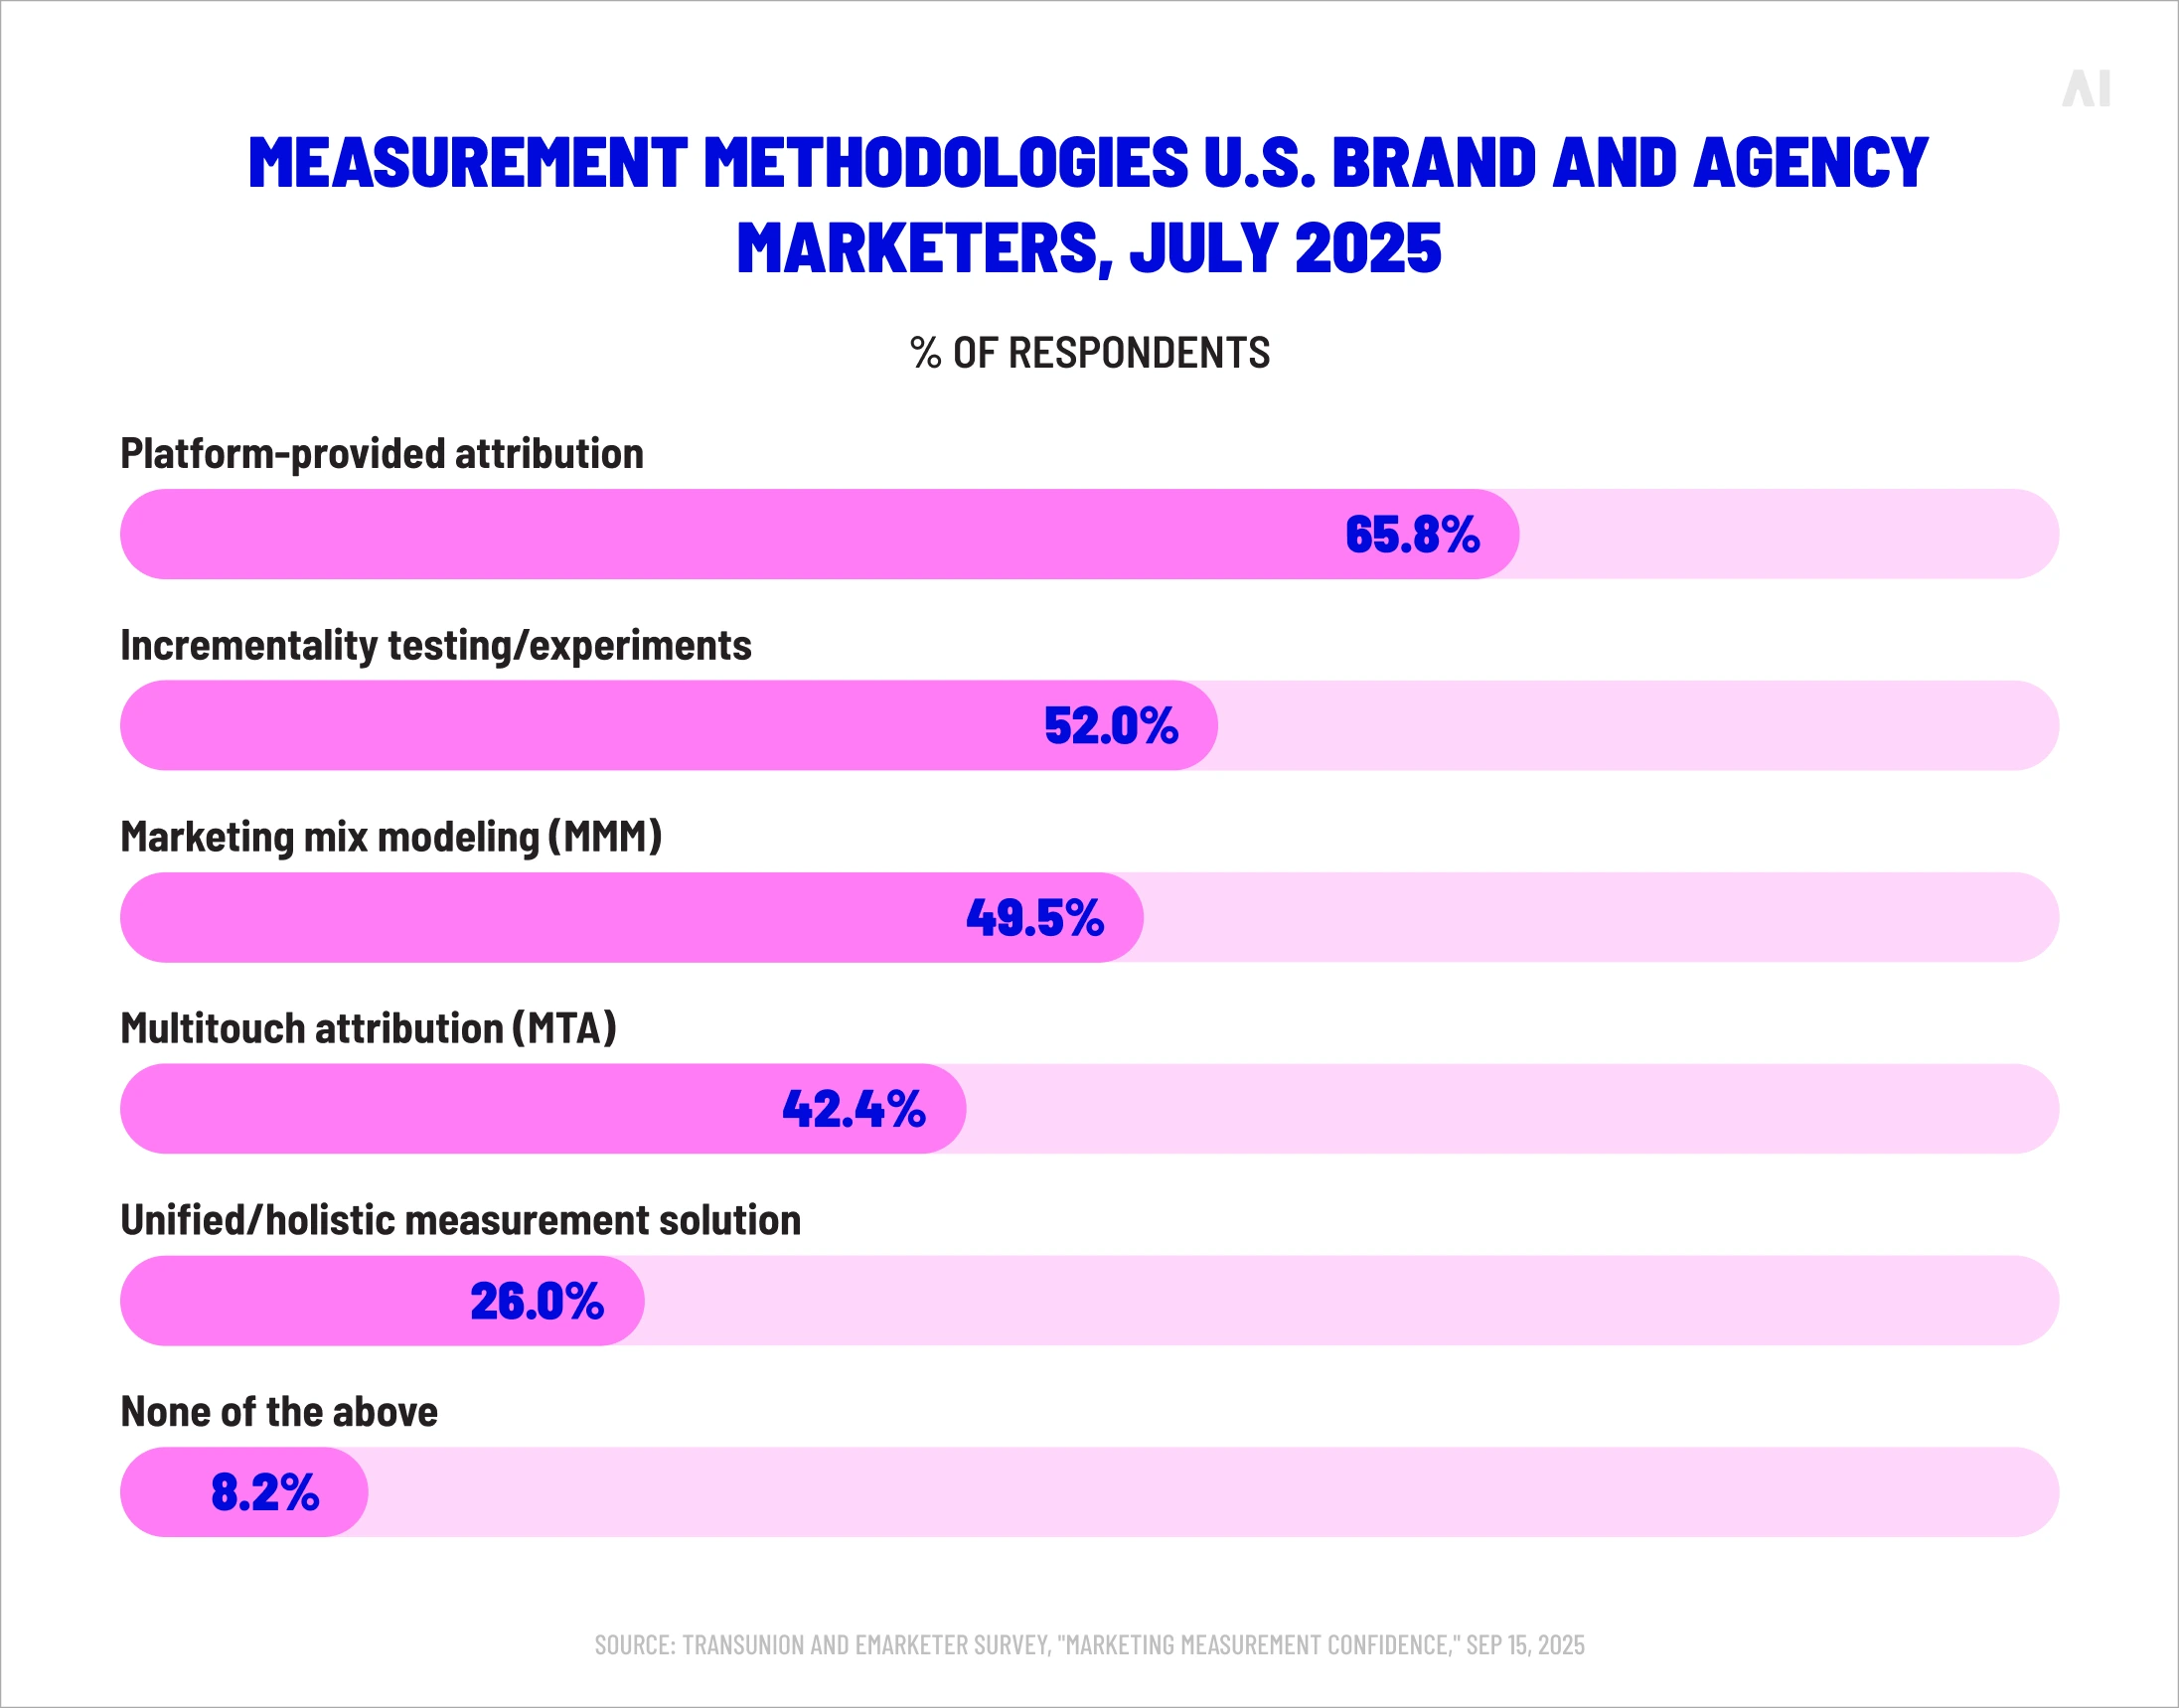
The renewed interest is also a response to pressure from the rest of the business. Finance has grown tired of marketing numbers it cannot reconcile, and the consequences of failing to prove returns are becoming concrete. Gartner predicts that by 2027, more than 40% of chief marketing officers who push for larger budgets will lose influence with the C-suite, simply because they cannot demonstrate sufficient returns. A measurement method that speaks in revenue contribution rather than platform-reported conversions is one way out of that trap.
💡 Related reading: Unified Marketing Measurement: Why Attribution Alone No Longer Works | Alternatives to the walled gardens
The core logic behind MMM
The core logic of MMM is decomposition: it separates the sales a business would have made anyway from the sales its marketing actually generated. Statisticians call the first part the baseline and the second the incremental contribution, and the entire usefulness of the method rests on telling them apart.
Picture a year of weekly revenue plotted as a line. Some of that line is baseline demand — the customers who would have bought regardless, driven by brand equity, distribution, and habit. The rest is movement: a lift when a promotion ran, a dip in a slow trading week, a bump that followed a burst of television spend.
MMM uses regression to attribute that movement to its likely causes, assigning a share of the variation to each media channel, each price change, each promotion, and each external factor such as weather or a competitor's launch. What remains, the part no variable can explain, is the baseline.
By the end, the model can say not just that revenue rose, but roughly how much of the rise belonged to paid search, how much to the price cut, and how much would have arrived regardless.
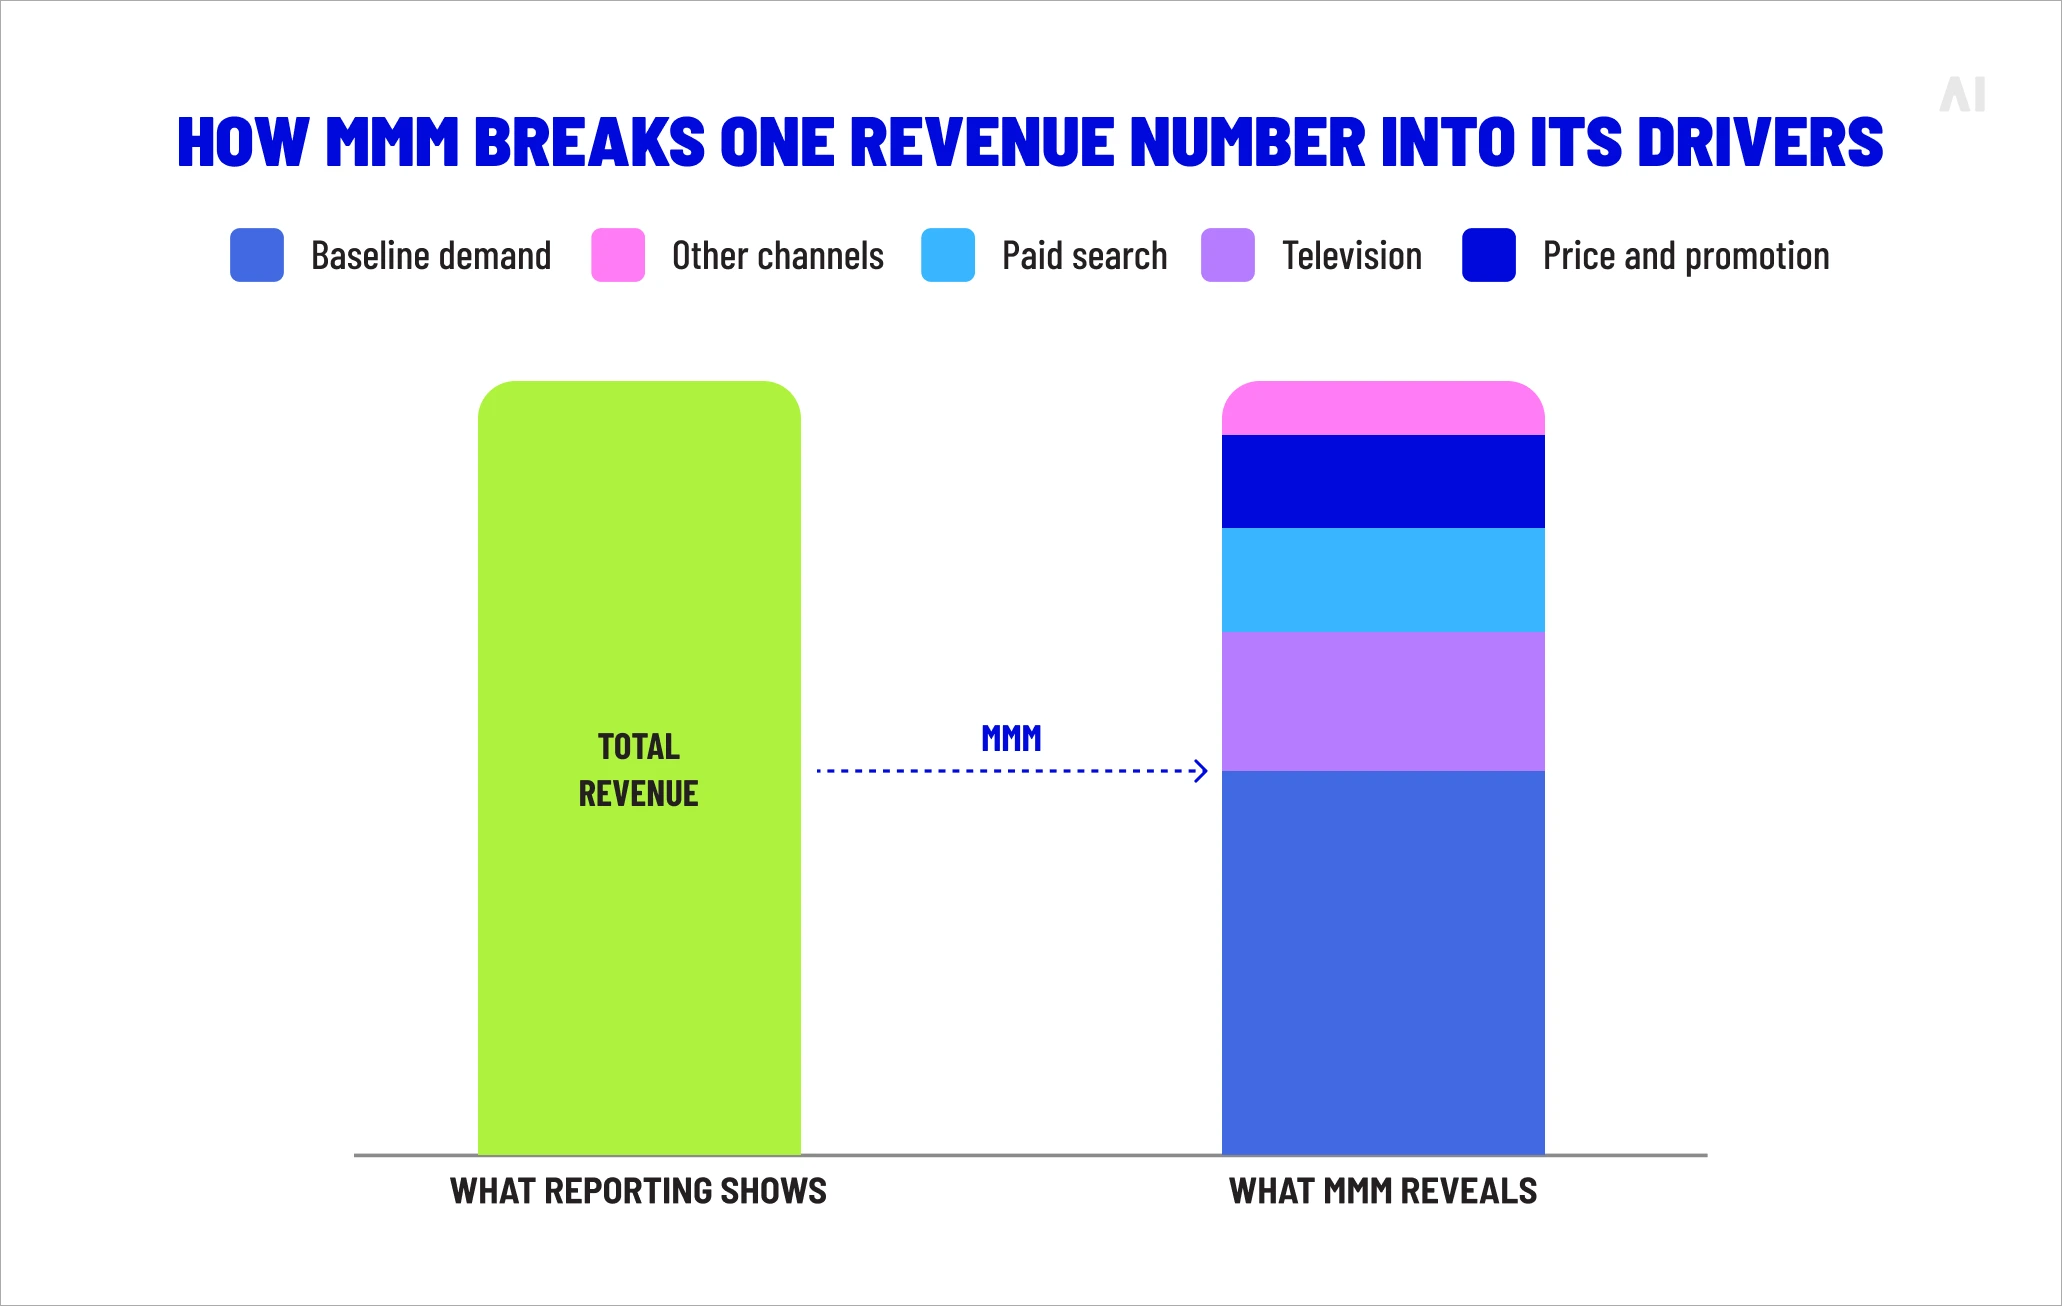
⚡ A media mix model tells you which ads worked. A marketing mix model tells you whether the advertising was the thing that worked at all.
MMM vs attribution vs incrementality
The short answer is that these three methods answer different questions, and the strongest measurement programs run all of them rather than betting on one.
Attribution is granular and fast but blind to anything it cannot track; incrementality is the closest thing to causal proof but narrow in scope; MMM is broad and planning-oriented but correlational and slow.
Used together, each covers the others' blind spots.
{{wmmm-1}}
The reason organizations combine the three is that no single method is both broad and certain.
- MMM gives the wide view a planner needs but cannot prove causation on its own.
- Incrementality tests prove causation but only for the narrow slice of activity you put under the microscope.
- Attribution fills in the tactical detail where tracking still works.
Each method checks the others — and as the later section on calibration shows, the experiments behind incrementality testing can be fed straight back into an MMM to make its estimates more trustworthy.
Related reading: Marketing Measurement vs Attribution vs MMM: What's the Difference
Marketing mix modeling vs. media mix modeling
The distinction between the two comes down to scope: media mix modeling measures the effectiveness of advertising channels, while marketing mix modeling measures the effect of the entire commercial program, of which advertising is one part. Both share the same conveniently identical acronym, which is part of why the terms blur.
- A media mix model answers questions about media. It compares the return on television against paid search, identifies where a channel has begun to saturate, and helps a planner move spend toward whatever is performing.
- A marketing mix model can do all of that, then keep going. It folds in the variables that sit outside the media plan but still drive sales: a price increase, a distribution deal that put the product on more shelves, a promotion that pulled demand forward, a recession that suppressed it.
For a packaged-goods brand whose revenue swings as much on price and promotion as on advertising, that wider lens decides whether the model explains the business or only the advertising.
The interchangeable use of the names is mostly harmless, but anyone scoping a project should be clear about which one they are buying.
Key components of marketing mix modeling
Every marketing mix model is built from a few categories of input that, combined, let it separate cause from coincidence. Get these components right before any modeling begins, because a model is only ever as good as the variables it is given.
The building blocks fall into four broad groups:
- The outcome variable. The business result the model is trying to explain — usually revenue, units sold, or new customers acquired. Everything else exists to account for movement in this number.
- Marketing inputs. Spend, impressions, or gross rating points for each channel, from television and connected TV to paid search, social, audio, out-of-home, and retail media. These are the levers the marketer controls and the ones the model is built to evaluate.
- Business drivers. The commercial decisions that are not advertising but still move sales: pricing, promotions and discounts, distribution and product availability, and new launches. Leaving these out is the most common way to make a model lie, because their effects get wrongly attributed to whichever media campaign happened to run at the same time.
- Control variables. The external forces no marketer controls but every model must account for — seasonality, weather, competitor activity, holidays, and macroeconomic conditions. Their job is to absorb the variation that has nothing to do with marketing, so the marketing effects are estimated cleanly.
When these components work together, the model can attribute a quarter's performance across its true causes. When one is missing, the gap does not disappear; it gets absorbed by the variables that remain, inflating or deflating their apparent effect without warning. A model with no price variable will happily credit your advertising for a sales jump that a discount actually caused.
Benefits of marketing mix modeling
The central benefit of MMM is that it converts marketing from a cost the business tolerates into an investment the business can reason about. By quantifying what each channel and decision contributed, it gives marketing and finance a shared, defensible basis for where money should go — and the confidence to defend those choices when budgets tighten.
Those advantages show up in four areas: measuring effectiveness, allocating budget, planning for the long term, and bringing hard-to-track channels into view. The sections below take each in turn.
Measuring marketing effectiveness
MMM measures effectiveness by isolating the incremental impact of marketing from everything else that influences sales — a harder and more honest task than most channel reporting attempts. Most channel reporting counts outcomes that occurred near an ad and assumes the ad caused them. MMM starts from the opposite premise: that much of what happens near an ad would have happened anyway, and the analyst's job is to find the part that genuinely would not.
That distinction — incremental versus baseline — is what gives MMM its credibility with finance. A platform reporting a 6:1 return on ad spend is describing correlation. A model that has estimated baseline demand, controlled for price and seasonality, and isolated the lift attributable to that channel is describing something much closer to contribution. The numbers are usually less flattering and far more useful.
⚡ The hard part of measurement is working out which sales you can take credit for.
💡 Related reading: What is advertising intelligence? | Marketing Analytics vs Marketing Intelligence: Why the Difference Matters for Growth
Improving budget allocation and marketing efficiency
MMM improves allocation by showing not only which channels work but how hard each can be pushed before it stops repaying the investment. The first insight tells you where to spend; the second, which most marketers lack, tells you how much.
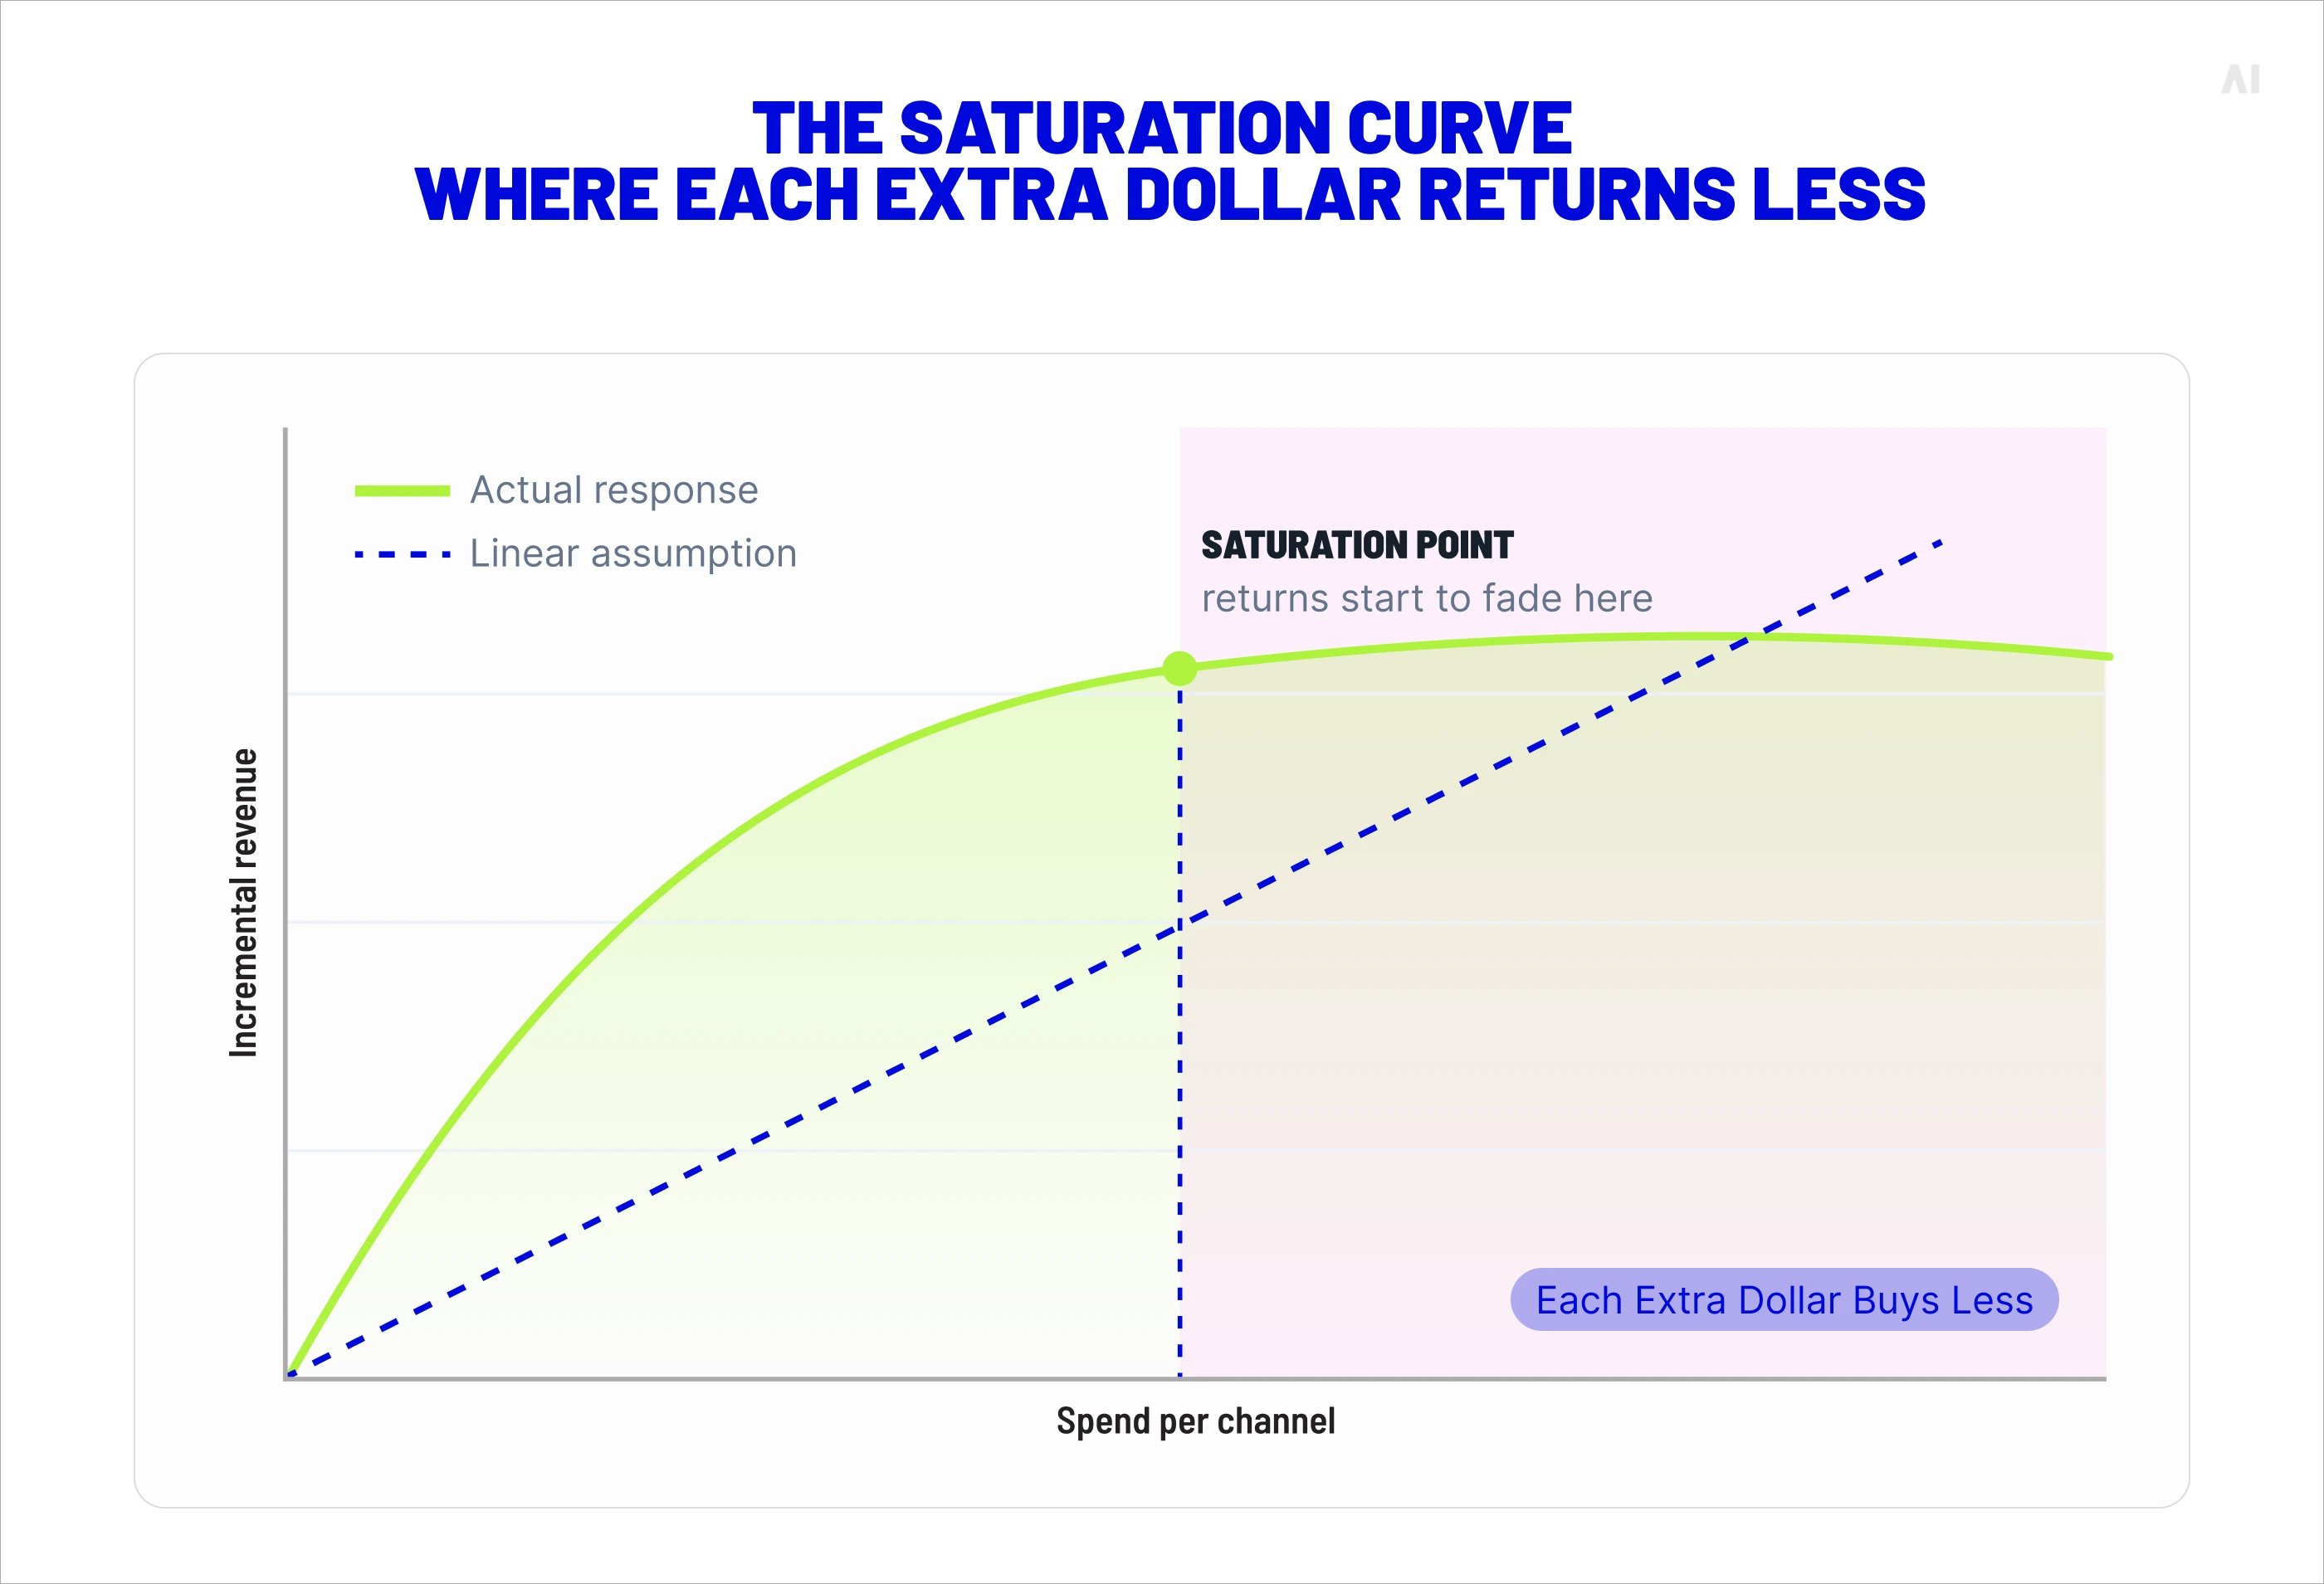
Every channel has a saturation point — a level of spend beyond which each additional dollar returns less than the last. MMM estimates the response curve for each channel and reveals where it begins to flatten, which turns budgeting from a contest of opinions into a set of marginal calculations.
The practical questions become answerable: which channel is closest to saturation and should be capped, which still has room to absorb investment, and where a dollar moved from one line to another would buy more incremental revenue.
Knowing where that slope turns becomes more valuable as budgets concentrate around the funnel's two ends — Gartner reports that awareness and conversion together now absorb 62.6% of media spend as marketers move budget toward acquisition and digital. The more crowded those channels become, the more valuable it is to know exactly where the returns start to fade.
Supporting strategic planning
Beyond measuring the past, MMM supports the harder work of planning the future, because the same response curves that explain last year can simulate next year. A calibrated model lets teams ask what-if questions before committing a budget: what a 10% cut would cost, which channels would absorb it with the least damage, what an extra investment in retail media would likely return.
This is the part of marketing that often gets neglected under quarterly pressure. Gartner has found that just 15% of CMOs plan beyond three years, yet those who plan eighteen months or more ahead are 1.5 times more likely to report high marketing and business performance.
MMM gives long-range planning something it usually lacks — an evidence base — by letting teams forecast and pressure-test scenarios rather than negotiate budgets on instinct and last year's spreadsheet.
💡 Related reading: Retail forecasting: methods and best practices
Measuring offline and online impact together
MMM's most distinctive benefit is that it measures the channels attribution cannot see at all, and weighs them on the same scale as the ones it can. Television, radio, podcasts, out-of-home, retail media, and sponsorship leave no clickstream, which is why click-based measurement either ignores them or guesses. Because MMM correlates aggregate spend against aggregate outcomes, the absence of a tracking signal is no obstacle.
This is what allows a marketer to compare a connected TV campaign and a paid search campaign in the same currency of incremental revenue, rather than trusting that the channels which happen to be measurable are also the ones that work. Upper-funnel investment, long suspected of being effective but impossible to prove, finally gets a fair hearing. For brands that spend heavily offline, this single capability often justifies the entire exercise.
Marketing mix modeling by industry: where the model works best
MMM works best where sales data is plentiful, purchases are frequent, and the forces moving revenue are varied enough to be worth untangling — which is why it was born in packaged goods and has spread unevenly from there. The method is not equally suited to every business; marketing mix models draw their accuracy from the rhythm of the category as much as from the quality of the analyst.
The table below sketches where MMM tends to deliver and what complicates it in each setting.
{{wmmm-2}}
The pattern across the table is that MMM rewards volume and variety. A category with thousands of weekly transactions, visible price movements, and real seasonality gives the model plenty of variation to learn from. A business with a handful of large, slow deals — much of B2B, parts of financial services — gives it far less, and the model's estimates widen accordingly. None of this rules MMM out for those industries; it simply means the results carry more uncertainty and lean harder on careful design.
How marketing mix modeling works
Mechanically, MMM is a time-series regression that relates marketing and business inputs to a sales outcome over time, with two crucial refinements that keep it from being naive. The refinements — adstock and saturation — exist because the real relationship between spending and selling is neither immediate nor proportional, and a model that pretends otherwise will be confidently wrong.
What follows is written for analysts and the marketers who work alongside them, not for data scientists. The aim is to understand what the model is doing and why, which is enough to challenge a bad model and trust a good one.
Adstock and saturation
Adstock and saturation are the two transformations that turn a raw spend figure into something that behaves like advertising actually behaves. Adstock handles time; saturation handles scale. Without them, a model assumes that an ad's effect lands instantly and grows forever, both of which are false.
- Adstock captures the fact that advertising lingers. Someone who sees a television spot on Monday may not buy until Thursday, or the following week, so a portion of this week's effect carries into the next and decays gradually rather than vanishing at midnight. The model represents this as a decay curve, estimating how quickly each channel's influence fades — fast for a performance search ad, slowly for a brand campaign.
- Saturation captures diminishing returns. The first million dollars spent on a channel reaches the most receptive audience; the tenth million reaches people who were already going to buy, or who tune the message out. The effect of spend therefore bends: steep at first, then flattening as the channel saturates. Plotted, the relationship between spend and revenue is an S-curve or a concave one, never a straight line — which is precisely why budgeting by simple ratios, as if every dollar were equally productive, gets the allocation wrong. The slope of that curve is where the money is.
Classical vs. Bayesian MMM
The practical choice in modern MMM is between a classical, frequentist regression and a Bayesian one, and it turns on how much data you have and how much prior knowledge you want the model to use. Classical models are fast, transparent, and familiar; Bayesian models are more stable on messy data and better at absorbing what you already know. Neither is universally correct.
- A classical model, built on ordinary least squares, fits the coefficients that best explain the historical data and reports point estimates with confidence intervals. It is quick to run and easy to interpret, but it grows brittle when channels move together or when the history is short — exactly the conditions most real media plans present.
- A Bayesian model instead combines the data with prior beliefs about how each channel behaves, producing a full distribution of likely values rather than a single number. That structure steadies the model where data is thin and, importantly, lets the results of incrementality experiments enter directly as priors.
The open-source tools that have made MMM accessible to teams without a six-figure consulting budget — Google's Meridian, Meta's Robyn, and PyMC-Marketing — are all Bayesian, which tells you where the discipline's center of gravity has moved.
{{wmmm-3}}
Model calibration with experiments
Calibration is the step that keeps an MMM honest, and it is the one most often skipped. Because the method is correlational, a model can fit the past beautifully and still be wrong about cause — crediting a channel for sales another factor produced. Experiments are how you check.
The standard tools are geo-lift tests and holdout experiments.
- In a geo-lift test, a channel runs in one set of markets and is held back in a comparable set; the difference in outcomes between them is the channel's causal effect, measured without any user-level tracking.
- A holdout experiment does the same at the audience level where that data exists, withholding ads from a randomized control group. The lift these experiments measure becomes a benchmark: if the model claims a channel returns far more than a clean geo test found, the model is recalibrated until its estimates and the experimental evidence agree.
In a Bayesian setup, the experimental result simply becomes a prior, pulling the model toward reality. The principle is simple, even where the execution is not: a model validated against real experiments earns trust that a model fitted to history alone never can.
⚡ A model that is never tested against a real experiment is an opinion with a confidence interval.
Data requirements for marketing mix modelling
MMM needs less exotic data than people assume and more discipline than they expect: the requirement is not a rare dataset but a complete, consistent, and sufficiently long one. The quality, coverage, and granularity of the inputs determine whether a model produces insight or expensive noise, and weak inputs cannot be rescued by clever statistics downstream.
Minimum data requirements
A workable MMM generally needs at least two to three years of history, reported weekly, covering every meaningful channel and the main business drivers alongside it. The reason for the time range is statistical: the model learns by observing how outcomes change as inputs change, and it needs enough seasons, promotions, and spending patterns to tell signal from chance. A single year rarely contains enough variation; it may not even include a full seasonal cycle.
Three conditions separate usable data from the rest:
- Depth. Enough history — two to three years at minimum — to span seasonal cycles and a range of spending levels, so the model has seen each channel at both high and low investment.
- Coverage. Every channel that carries meaningful spend, plus the non-media drivers (price, promotion, distribution) that move sales. A channel left out of the data does not get measured; its effect contaminates the others.
- Granularity and consistency. Weekly reporting at minimum, with definitions that stay constant across the period. A mid-stream change in how a channel is recorded can look to the model exactly like a change in performance.
External factors and control variables
The data that most often gets forgotten is the data the business does not generate itself: the external conditions that move sales independently of anything marketing did. Macroeconomic indicators, competitor activity and spend, weather, seasonality, holidays, and the brand's own pricing all belong in the model, because all of them leave fingerprints on revenue.
Their role is to take responsibility for the variation they cause, so the marketing variables are not blamed or credited for it. A cold snap that lifts soup sales, a competitor's price war that dents yours, a recessionary quarter that softens demand across the category — each one moves revenue on its own, and left uncontrolled, that movement gets handed to whichever campaign happened to be running at the time. Including these controls is less about completeness for its own sake than about protecting the integrity of every other estimate in the model.
💡 Related reading: Data fragmentation in advertising: causes and fixes
The insights MMM provides for better decisions
The output of an MMM is not a single score but a structured account of where performance comes from and what to do about it. Read well, it shows a marketer how the budget breaks down into results, which channels carry their weight, and where next quarter's money might do more.
💡 Related reading: Cross-platform measurement governance
Measuring channel impact and ROI
The headline output is a decomposition of sales: a breakdown of total revenue into the share driven by each channel, each business factor, and baseline demand. From that decomposition flow the figures marketers care about — the contribution of each channel, its return on investment, and its marginal return, the number that should actually drive decisions.
Marginal ROAS is the insight most often missed, and the most useful. Average return tells you how a channel performed across all its spend; marginal return tells you what the next dollar would do.
- A channel can show a healthy average while its marginal return has collapsed because it is near saturation, which means pouring more money in would be close to wasted.
- The opposite case — a modest average masking a strong marginal return — flags a channel worth scaling.
A model that surfaces marginal returns, rather than averages alone, is the difference between a report and a plan.
💡 Related reading: Profit on ad spend: beyond ROAS
Budget scenarios and optimization opportunities
The forward-looking output is scenario planning: using the model's response curves to simulate how different budgets would perform before any money is committed. Because the model knows how each channel's returns rise and then flatten, it can estimate the revenue effect of moving spend between channels, raising or cutting the total, or reallocating toward whatever is least saturated.
This is where MMM stops describing and starts advising. A team can run a dozen budget scenarios in an afternoon and compare their projected returns, identifying the allocation that maximizes incremental revenue — or, more sophisticatedly, profit — within a fixed budget. The model does not make the decision, and treating its simulations as guarantees rather than informed estimates is a common error. But it replaces a negotiation driven by last year's split and the most senior opinion in the room with one driven by evidence.
💡 Related reading:Media Mix Optimization: How to Use MMM for Budget Allocation
Challenges and limitations of MMM
For all its strengths, MMM has real limitations, and pretending otherwise is how organizations end up disappointed. It cannot see individual customers, it depends on the past to predict the future, it is slow to refresh, and its accuracy rises and falls with the quality of its inputs. Understanding where it falls short is what lets a team use it well and supplement it where needed.
The main constraints are these:
- No customer-level view. MMM works only in aggregate, so it cannot tell you which segments or individuals responded — only how a channel performed overall. For audience-level questions, it is the wrong instrument.
- A dependence on history. The model assumes the future will behave roughly like the past. A sudden change — a new competitor, a category disruption, a pandemic — can leave it briefly out of step with reality until enough new data accumulates.
- Refresh lag. Because models need substantial data and periodic rebuilding, their insights describe a period that has already ended. Treating a six-month-old model as a live dashboard is a reliable way to make a poor decision.
- Sensitivity to data quality. Gaps, inconsistencies, and missing variables do not announce themselves; they distort the estimates all the same, and a confident-looking output can rest on shaky inputs.
There is also a gap between producing insight and acting on it. eMarketer reports that only 28% of marketers consider their organization very effective at converting MMM insights into action — a reminder that a model is worth nothing until someone changes a budget because of it.
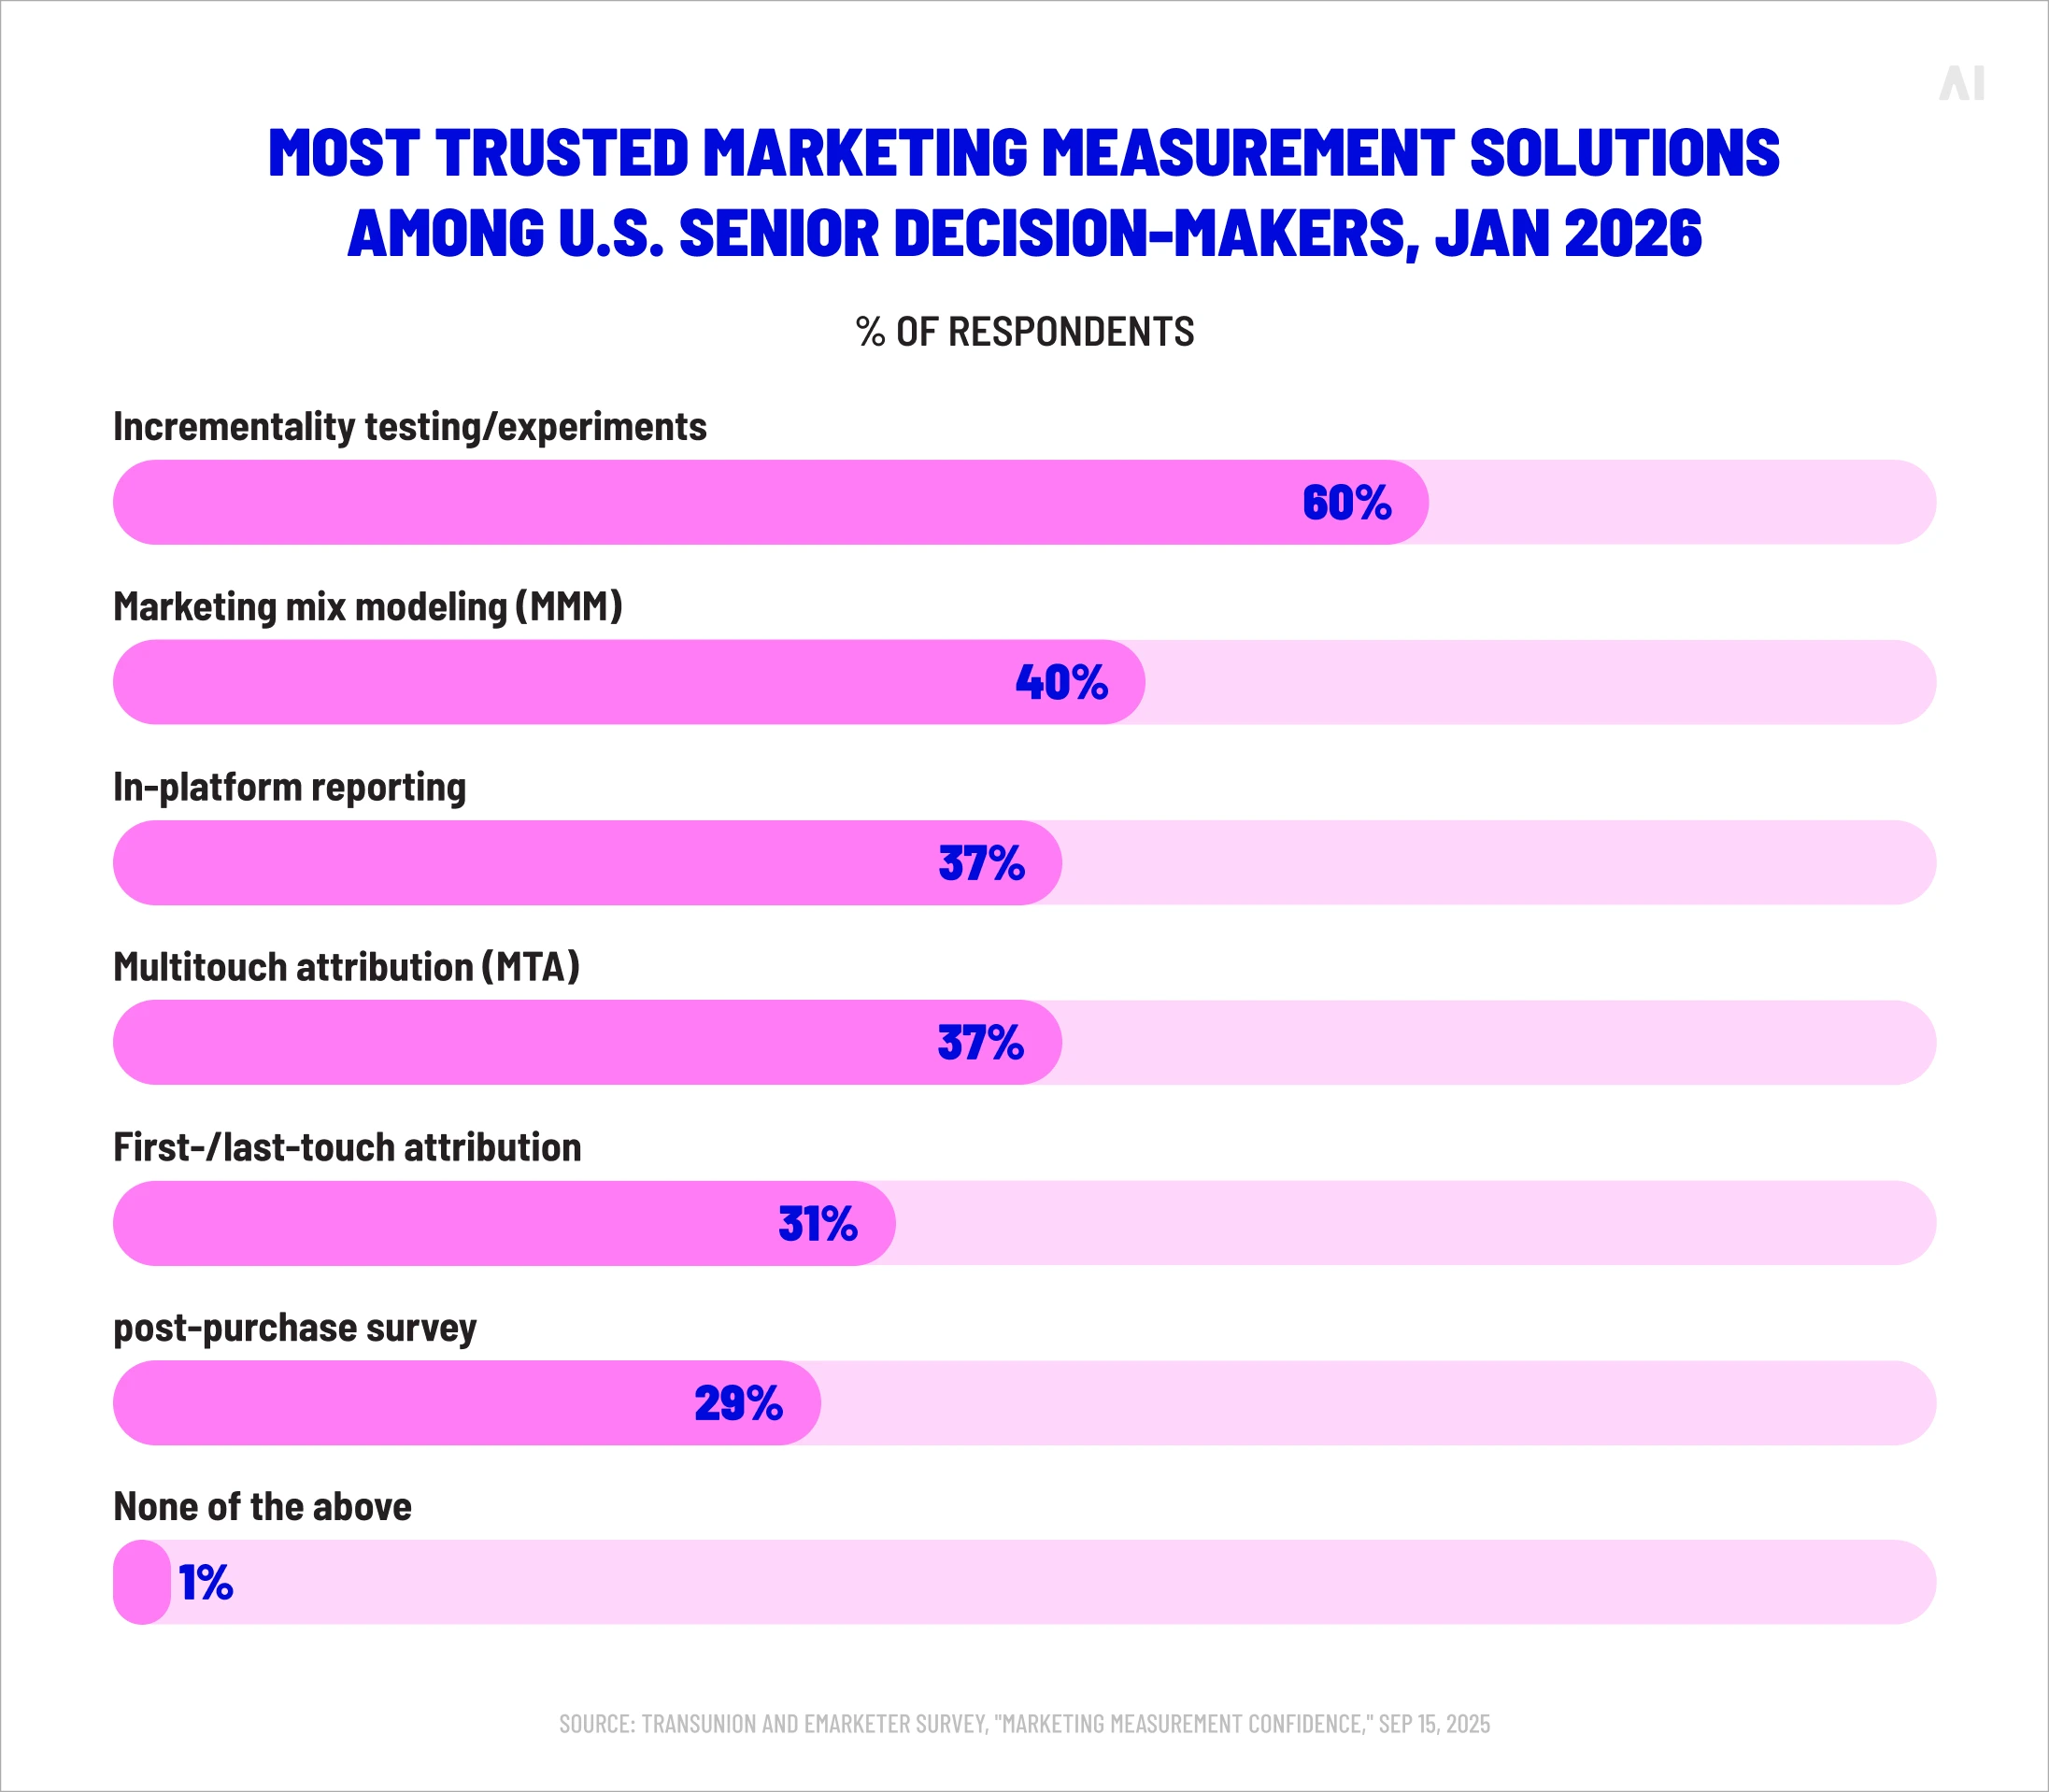
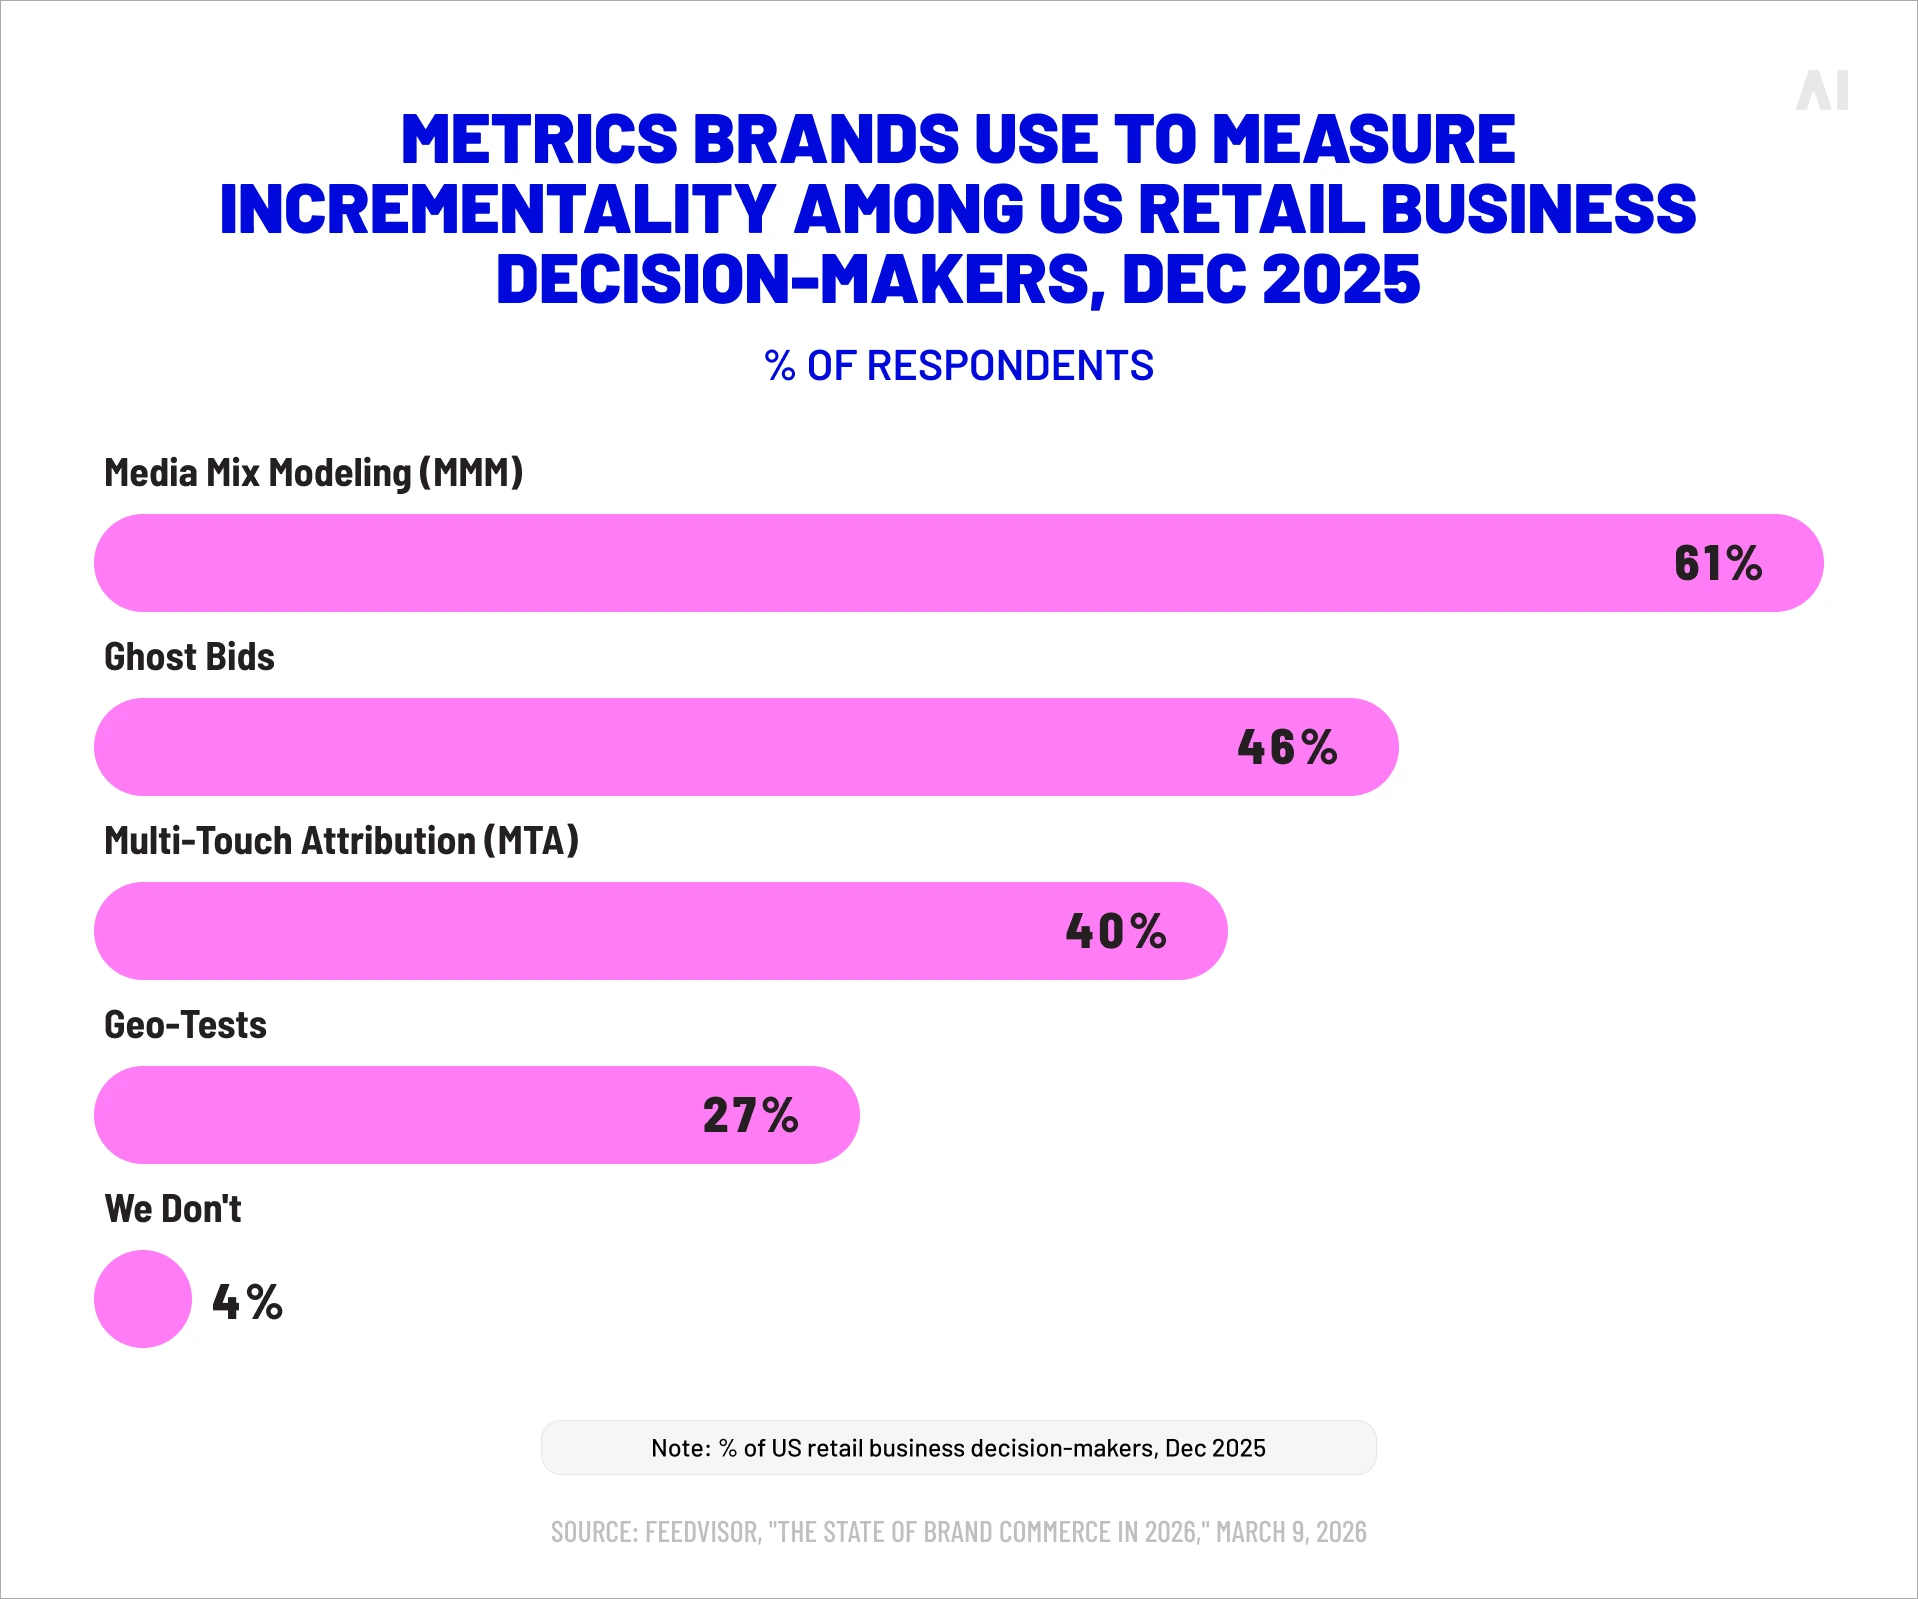
This is also why MMM is best understood as one method in a wider measurement program rather than a complete answer. Its blind spots are precisely the strengths of attribution and incrementality testing: attribution supplies the tactical, channel-level detail MMM lacks, and incrementality testing supplies the causal proof MMM can only approximate. The organizations that get the most from MMM are the ones that stop asking it to be the whole picture.
💡 Related reading: Marketing effectiveness measurement: the core challenges |Incrementality Testing Framework: Step-by-Step | Cross-platform measurement explained
How to implement marketing mix modeling
Implementing MMM is less a technology purchase than an operational discipline, and it follows a predictable arc: assess the data, build and validate the model, act on what it says, then keep it current. Each stage has a way of going wrong, and most failed MMM programs can be traced to skipping or rushing one of them.
💡 Related reading: Creating a Data-Driven Marketing Strategy
Step 1: Data audit and readiness assessment
The first step is an honest audit of whether the data can support a model at all, before a single coefficient is estimated. This means cataloguing what exists for each channel, how far back it goes, how it is recorded, and where the gaps are — in media spend, in outcome metrics, and in the business and external variables the model will need.
Audits almost always surface awkward truths: a channel with eighteen months of clean history and nothing before it, promotions that were never logged systematically, price changes living in a separate system no one connected to marketing. These are not reasons for embarrassment; they are the gaps the project exists to close. Finding them now is far cheaper than discovering them halfway through, when they have already corrupted a model nobody yet distrusts.
💡 Related reading: How to Gain Full Visibility Across Your Marketing Ecosystem
Step 2: Model development and validation
With usable data in hand, the second step is building the model and, just as importantly, proving it works before anyone relies on it. Development involves choosing which variables to include, applying the adstock and saturation transformations, and fitting the model — but the part that separates a sound model from a flattering one is validation.
A model should be tested against data it has not seen, a process called backtesting, to confirm it predicts well rather than merely describing the history it was trained on. It should be checked against the experimental results from any geo-lift or holdout tests the business has run, and recalibrated where the two disagree.
A model that explains the past perfectly but predicts the future poorly has been overfitted, and overfitting is the failure mode that has discredited more than one MMM program. Validation is not a formality at the end; it is the work.
💡 Related reading: Marketing Measurement Framework: Building a Scalable System for Smarter Decisions
Step 3: Turning insights into marketing decisions
The third step justifies the first two: translating the model's findings into budgets, channel plans, and optimization choices. A model that sits in a slide deck has cost money and returned nothing; the value is realized only when its output changes what the organization does.
This is harder than it sounds, and not for technical reasons. It requires marketing and finance to agree on what the model is telling them, to act on conclusions that may contradict long-held assumptions about favored channels, and to fold model-driven recommendations into planning cycles that were not built around them.
The 28% figure cited earlier — the share of marketers who turn MMM insight into action effectively — points straight at this step. Building the model is the easy part; getting the organization to act on it is where programs stall.
Step 4: Refreshing and maintaining the model
The final step is treating the model as a standing capability rather than a one-off study, which means refreshing it on a schedule and rebuilding it when the business changes underneath it. A model is a snapshot of a moment; markets move, channels mature, consumer behavior drifts, and an unmaintained model slowly decays into a historical artifact.
Most organizations refresh coefficients quarterly and rebuild more thoroughly when something material changes — a new channel enters the mix, a major competitor appears, the business reprices or repositions. Each refresh is also an opportunity to run a fresh incrementality test and feed the result back in, tightening the model's accuracy over time. The discipline is what compounds: a model maintained continuously becomes more trustworthy with every cycle, while one built and abandoned is worth less each month it ages.
From MMM insights to media execution with AI Digital
A model only pays off when its conclusions reach the media plan, and closing that distance — from insight to activation — is where measurement meets execution. The challenge for most organizations is operational: the team that builds the model and the systems that buy the media often sit far apart, and the insight evaporates in the gap between them.
This is the problem AI Digital is built to solve. Its products connect the measurement, planning, and buying stages so that what a model recommends can actually be acted on, across channels and without surrendering the transparency that made the recommendation trustworthy to begin with.
💡 Related reading: Integrated Marketing Systems: How to Connect Data, Channels, and Performance
Connect measurement, planning, and optimization with Elevate
Elevate, AI Digital's marketing intelligence platform, brings research, planning, optimization, and reporting into a single workflow, so MMM findings flow into decisions instead of stalling in a report. It is DSP-agnostic by design, which means its view of performance is not confined to any one platform's walled-off version of events.
For teams working with MMM, the value is continuity. Rather than exporting a model's output and hoping it survives the journey into a separate planning tool, Elevate keeps measurement, budget allocation, and channel-level performance in one place, with automated insight surfacing the moves the data supports. The result is fewer handoffs between the analysis and the action, which is usually where momentum is lost.
Media quality optimization with Smart Supply
Smart Supply improves the quality of the inventory a model's recommendations get spent on, through selection, filtering, and optimization of supply rather than blunt volume buying. Cleaner supply is not only a media-waste issue; it is a measurement issue, because a model calibrated on noisy, low-quality delivery is learning from corrupted signals.
The tool applies supply-path optimization across multiple SSPs and builds custom deal IDs aligned to specific KPIs, reducing the bid-stream duplication that inflates costs and muddies performance data. Spending an MMM-optimized budget into well-selected supply means the next model is built on better inputs — a feedback loop that connects execution quality back to measurement accuracy.
💡 Related reading: Smart Supply | Why transparency in advertising improves performance
Cross-channel execution with the Open Garden Framework
The Open Garden Framework lets a brand act on cross-channel insights across platforms without being locked into any single vendor's ecosystem. Since MMM's whole purpose is to compare channels on equal terms, executing its conclusions through a vendor-neutral framework keeps that even-handedness intact all the way to the buy.
A model that recommends moving budget from a walled garden into the open web is only useful if the organization can actually make that move. By operating across many DSPs rather than inside one platform's boundaries, the Open Garden Framework gives planners the flexibility to follow the evidence wherever it leads, and the consistency of measurement that comes from not having each platform mark its own homework.
💡 Related reading: Walled gardens vs the open internet
Is marketing mix modeling the right choice for your business?
MMM is the right choice when a business has enough data, enough complexity, and enough riding on its budget decisions to justify the effort — and the wrong choice, or at least a premature one, when it does not. The honest answer for many organizations is "not yet," and recognizing that is more useful than a model built on foundations that cannot hold it.
The businesses that benefit most share a few traits. They have two or more years of consistent sales and spend history. They invest across several channels, including some that attribution cannot measure, so there is a real allocation problem worth solving. Their revenue is driven by enough moving parts — price, promotion, seasonality — that untangling them has genuine value. And, crucially, they have the organizational willingness to act on findings that may unseat a favored channel. A company spending almost entirely in one trackable digital channel has little for an MMM to chew on; its budget question is narrow enough that simpler methods will do.
The readiness signals cut the other way too. If the data is thin or inconsistent, if no one owns the marketing-to-finance handoff, or if the appetite to change behavior on the strength of a model is absent, those gaps are worth closing before commissioning an MMM rather than after. A model is only as good as the data beneath it and the decisions made on top of it, and investing in either of those foundations first is rarely wasted.
If you are weighing whether MMM fits your business — or you have a model and want its conclusions to reach the media plan intact — AI Digital works with advertisers across the full path from measurement to execution: marketing intelligence through Elevate, supply quality through Smart Supply, and vendor-neutral cross-channel buying through the Open Garden Framework. The throughline is a single aim — the budget a model recommends should be the budget that actually gets spent.