Media Mix Optimization: How to Use MMM for Budget Allocation

The distance between owning a model and acting on it is wider than most teams would admit. Harvard Business Review Analytic Services found that while 87% of marketers consider media mix modeling important to their organization, only 28% rate themselves as very effective at converting its findings into timely decisions. The model runs. The deck gets presented. And then the budget is set more or less the way it was last year, because nobody is quite sure how to translate a chart of response curves into a reallocation they can defend to finance.
Media mix modeling (sometimes called marketing mix modeling, and abbreviated to MMM either way) is a statistical method that estimates how much each channel contributes to a business outcome by reading aggregate spend and sales data, rather than tracking individual people across the web. The mechanics behind it, from adstock to saturation, are the subject of a companion piece, What is marketing mix modeling (MMM) and how it works. This article assumes you already have a model, or are close to one, and concerns itself with the question that follows: what to actually do with it.
Budget allocation is where the method earns its keep. Done well, media mix optimization is the difference between spreading money across channels out of habit and directing it on evidence — knowing which channels are underfed, which are full, and where additional spend will do the most good.
What follows is a practical guide to MMM optimization: why conventional measurement leads budgets astray, what MMM's outputs are really telling you, the four moves that turn those outputs into decisions, the pitfalls that can undermine them, and how to build a media mix modeling strategy that holds up quarter after quarter.
💡 Related reads: Media mix modeling: strategy for growth | Why marketing measurement is broken in today's digital ecosystem.
Why budget allocation breaks without the right model
Budget allocation goes wrong for a mundane reason: the numbers most teams use to make it measure the wrong thing, or only part of it. A media plan spread across search, social, connected TV, retail media, and a stubborn line item for the trade press throws off a flood of performance data, almost all of it reported by the platforms doing the selling. Each one grades its own homework. And each one, by a remarkable coincidence, tends to award itself a pass.
The pressure to keep spending against those flattering numbers is real. According to The CMO Survey, conducted in January 2026, more than 70% of marketers now prioritize short-term results over long-term gains, and most lean on performance tracking as their main way of proving value to the rest of the business. When the scoreboard rewards whatever is easiest to track, budget follows the click — and the channels that build demand without leaving a neat digital trail get starved, regardless of what they actually contribute.
This is exactly what media mix modeling is for. Because it works from aggregate outcomes rather than individual journeys, it can see past the self-interested arithmetic of any single platform and estimate what each channel genuinely added to revenue. That wider view is why so many organizations have come back to the method as tracking signals have decayed.
Marketers are being pushed into a world where we have to use MMM. — Moshe Katzwer, DoorDash (Source)

The limits of attribution and platform data
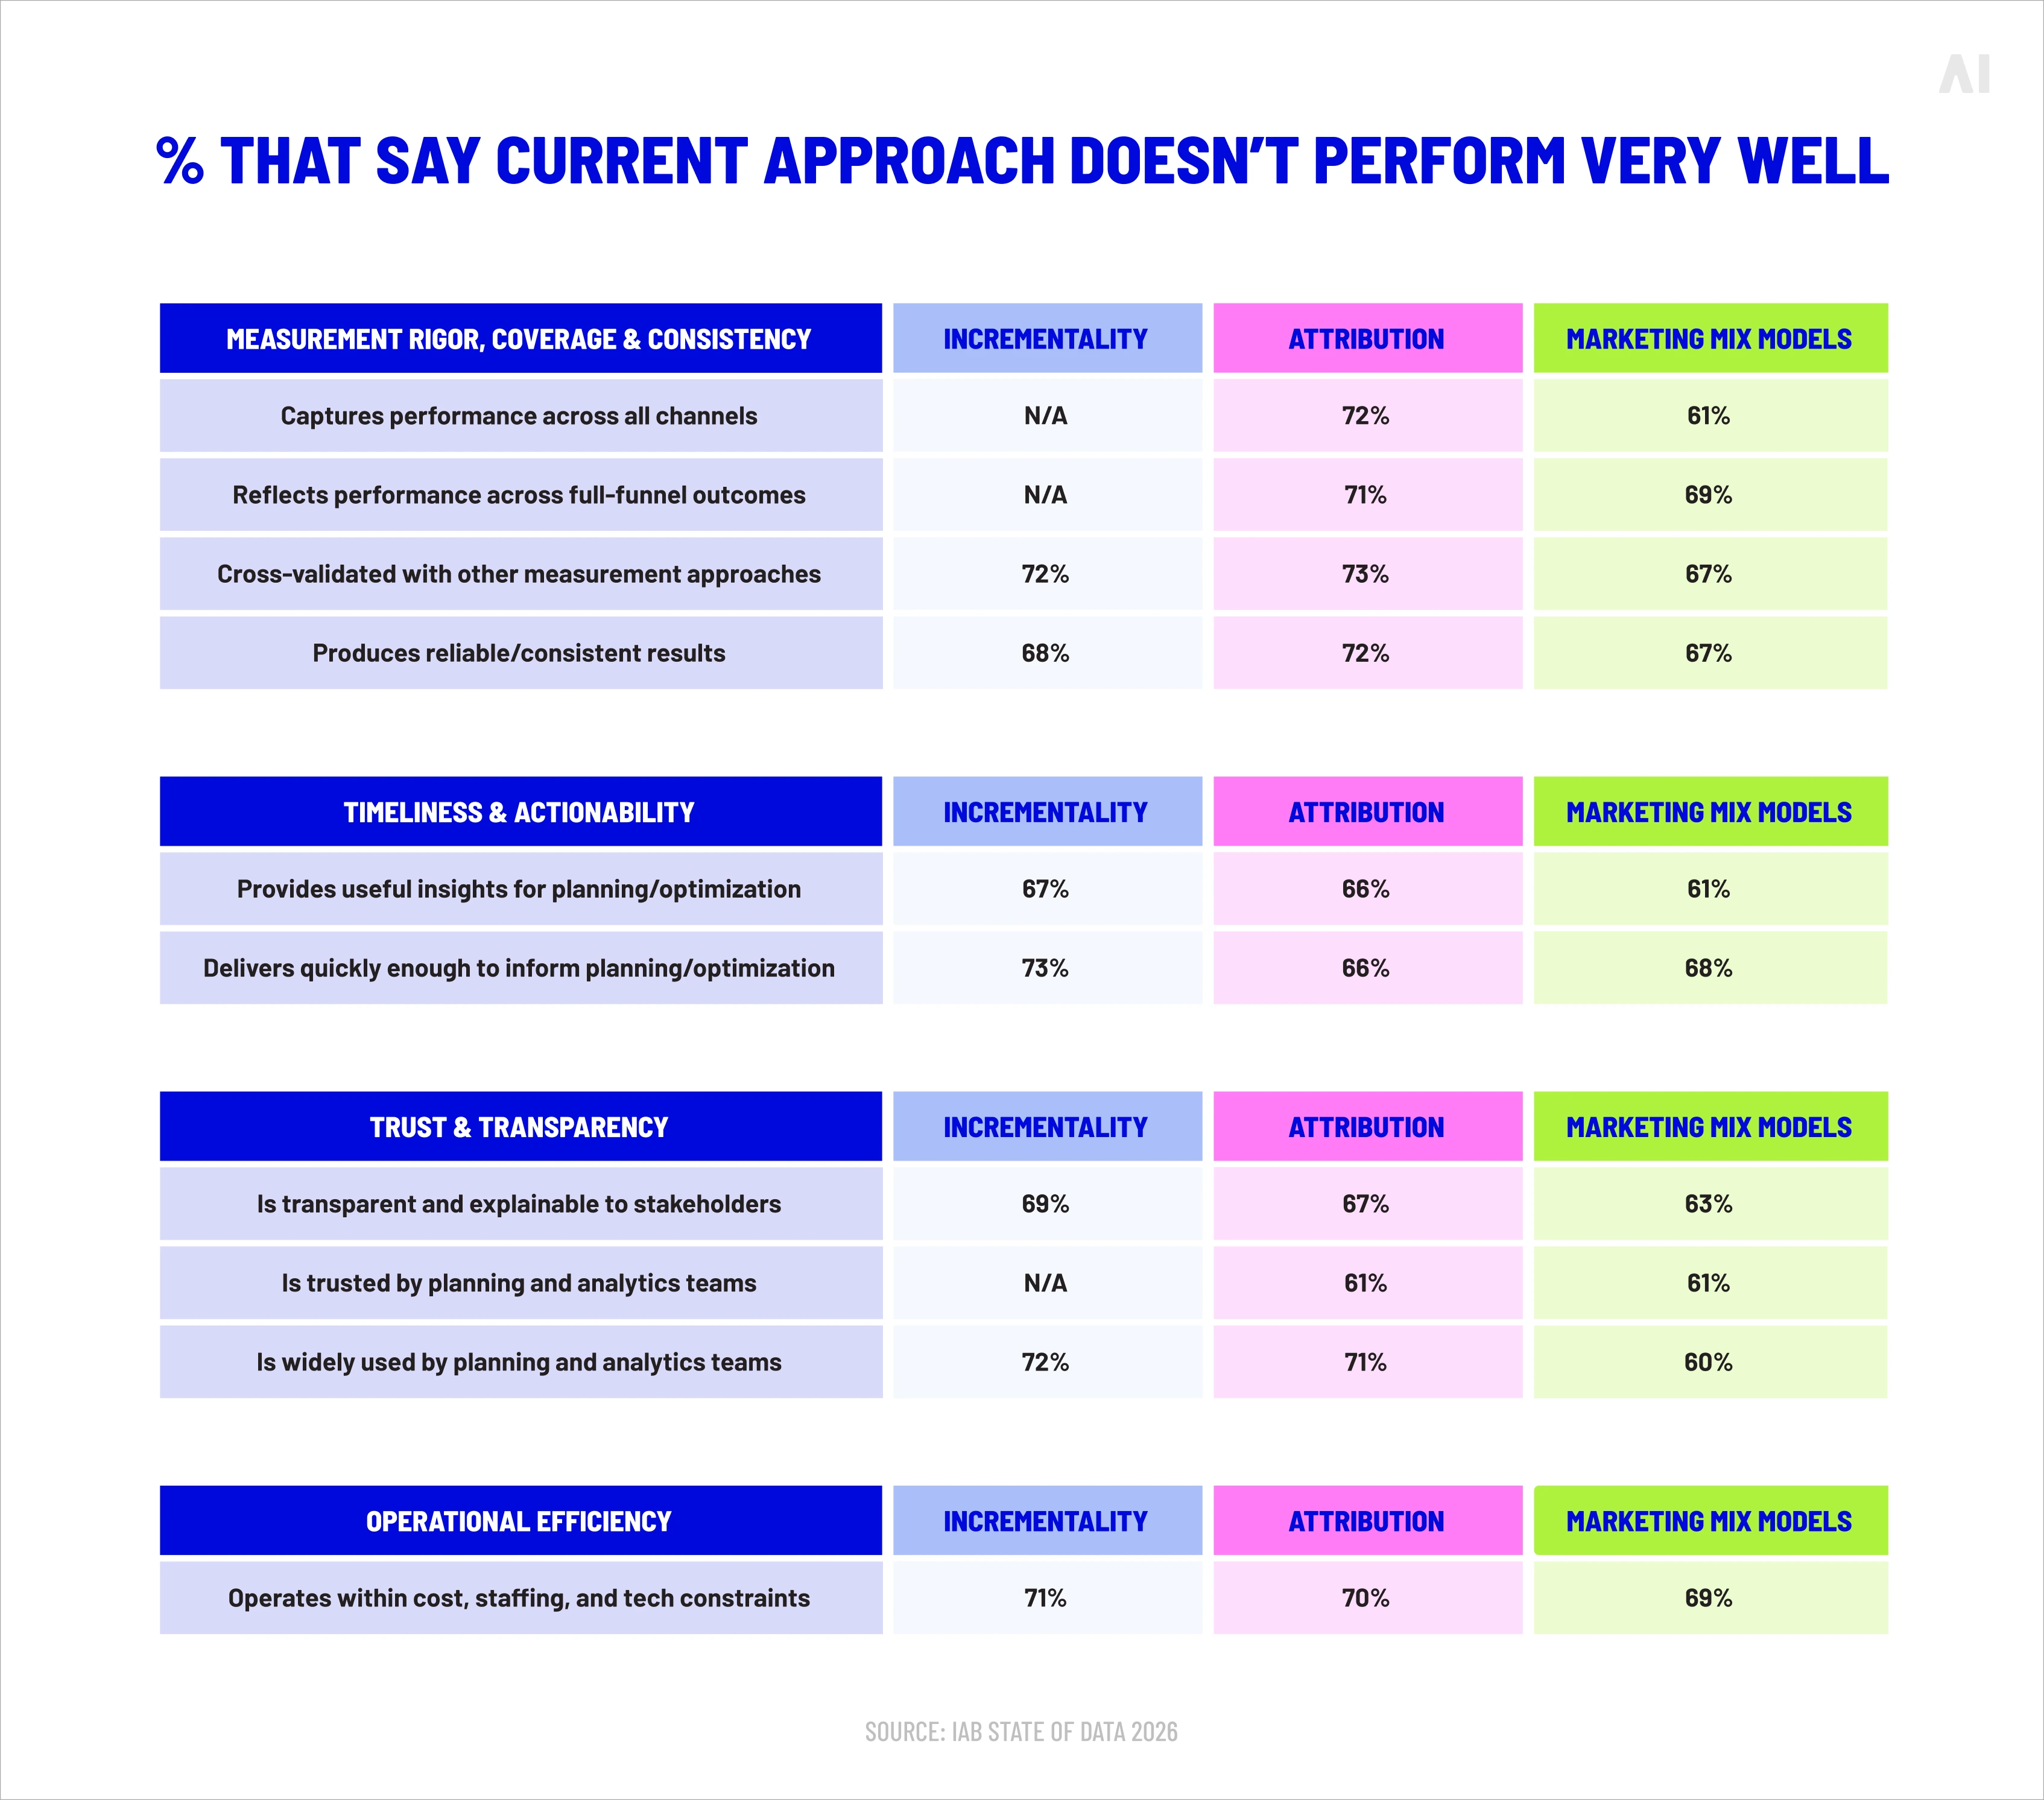
Attribution and platform-reported metrics fail budget decisions in three predictable ways: they confuse correlation with cause, they cannot see the channels they do not touch, and they reward themselves twice over.
Most attribution models assign credit by reading the digital journey to a conversion and handing out points along the way. That works tolerably well for the steps it can observe, but a touchpoint appearing before a sale is not proof that it caused one — plenty of people click a brand search ad on their way to a purchase they had already decided to make.
Self-attribution compounds the trouble. When each walled garden reports on its own performance using its own rules, the credited conversions across all of them routinely add up to more sales than the business actually made. Budgets built on that math overfund whatever is best at claiming credit, not whatever is best at creating customers.
The deeper limitation is everything attribution never sees. Connected TV watched on a shared screen, a billboard on a commuter route, a podcast read, the slow accrual of brand memory — none of it leaves the kind of user-level trail that click-based measurement depends on, yet all of it moves sales. A budget set from platform data alone is a budget set with one eye closed.
💡 Related reads:The Problem with Platform-Reported Data: Why You Can’t Trust the Numbers |Alternatives to walled gardens
Why average ROI isn't enough
Average ROI is the wrong tool for allocation because allocation is a decision about the next dollar, and the next dollar almost never earns the average return.
Picture a channel returning $4 for every $1 spent. That figure is an average across all the money poured into it — the cheap, high-intent impressions at the start and the expensive, marginal ones at the end, blended into a single tidy number. The question a budget owner faces is different and sharper: if I add one more dollar here, what comes back? Early in a channel's spend, that marginal return can sit well above the average. Late in it, once the keen audiences are exhausted and you are paying to reach people who were never going to convert, the marginal return can collapse toward zero while the average still looks healthy. Allocate on the average and you will keep feeding channels that stopped paying their way some time ago.
⚡ Average ROI tells you which channels have worked. Marginal ROI tells you where the next dollar will work hardest — and only one of those is a budget decision.
What insights does media mix modeling (MMM) provide?
MMM gives budget owners the inputs that platform dashboards cannot: an estimate of what each channel truly contributed, what the next increment of spend would add, how channels lift one another, and how offline media pulls its weight. These are the raw materials of allocation, and each answers a question a media plan actually poses.
- Channel contribution sets out the share of sales each line of the plan drove, stripped of the double-counting that self-attribution introduces.
- Marginal impact shows the return on additional spend rather than the blended average, which is the figure that should govern where new money goes.
- Cross-channel effects capture the way a television campaign lifts branded search, or social primes a later retail-media conversion — interactions that single-channel reporting misses entirely.
- Offline influence brings television, print, audio, and out-of-home into the same frame as digital, so the comparison is fair.
- And performance trends show how all of this drifts over time, as audiences tire, costs climb, and seasons turn.
Read together, these outputs support the decisions that conventional measurement leaves to instinct: which channels to grow, which to trim, and how much the plan as a whole can absorb before the returns thin out.
💡 Related reads: Cross-platform measurement and governance
MMM outputs and how marketers use them
A model produces several distinct outputs, and confusing one for another is a common source of bad allocation.
The takeaway is that no single output settles an allocation on its own. Contribution tells you where results came from; marginal ROI tells you where to send the next dollar; the curves and simulations tell you how far you can push before the answer changes.
The core concepts behind media mix optimization
Two ideas do most of the heavy lifting in media optimization, and both describe ways that spending and selling refuse to move in a straight line.
- The first is that channels tire as you feed them.
- The second is that advertising keeps working after the campaign stops.
Grasp these and the rest of the practical work falls into place.
Diminishing returns curves
A response curve shows how a channel's returns change as you spend more on it, and for budget purposes the way that curve bends is the whole point. The line rises steeply at first, when you are reaching the most receptive audience cheaply, then bends as you exhaust them and begin paying to reach people who are less and less likely to act. Eventually it flattens: more money buys almost nothing.
For allocation, the useful trick is to read the curve in three zones.
- In the underfunded zone, returns are still climbing, and additional budget earns more than it costs — money belongs here.
- In the efficient zone, around the bend, the channel is working hard and near its best.
- In the saturated zone, the line has gone flat, and every extra dollar is close to wasted.
Most channels in most plans are not uniformly good or bad; they are simply sitting at different points on their own curve, and good media mix optimization comes down largely to moving money out of saturated zones and into underfunded ones.

Adstock effects
Advertising does not stop working the moment a flight ends. Adstock, or carryover, is the lingering effect of exposure: someone sees a connected TV spot this week and buys a fortnight later, by which point a click-based system has long since lost the thread. For budget decisions, this has two consequences worth holding onto.
- First, do not judge a channel only on what happens during its flight. a campaign that looks flat in-week may be doing its real work in the following weeks, and cutting it on the strength of immediate numbers can strip out demand you were relying on.
- Second, when you reallocate, take care not to double-count the tail. A channel you have just cut will keep delivering for a while on momentum alone, which can flatter the early results of whatever you moved the money into.
Patience, and a model that accounts for the lag, keeps both errors at bay.
How to use MMM for budget allocation
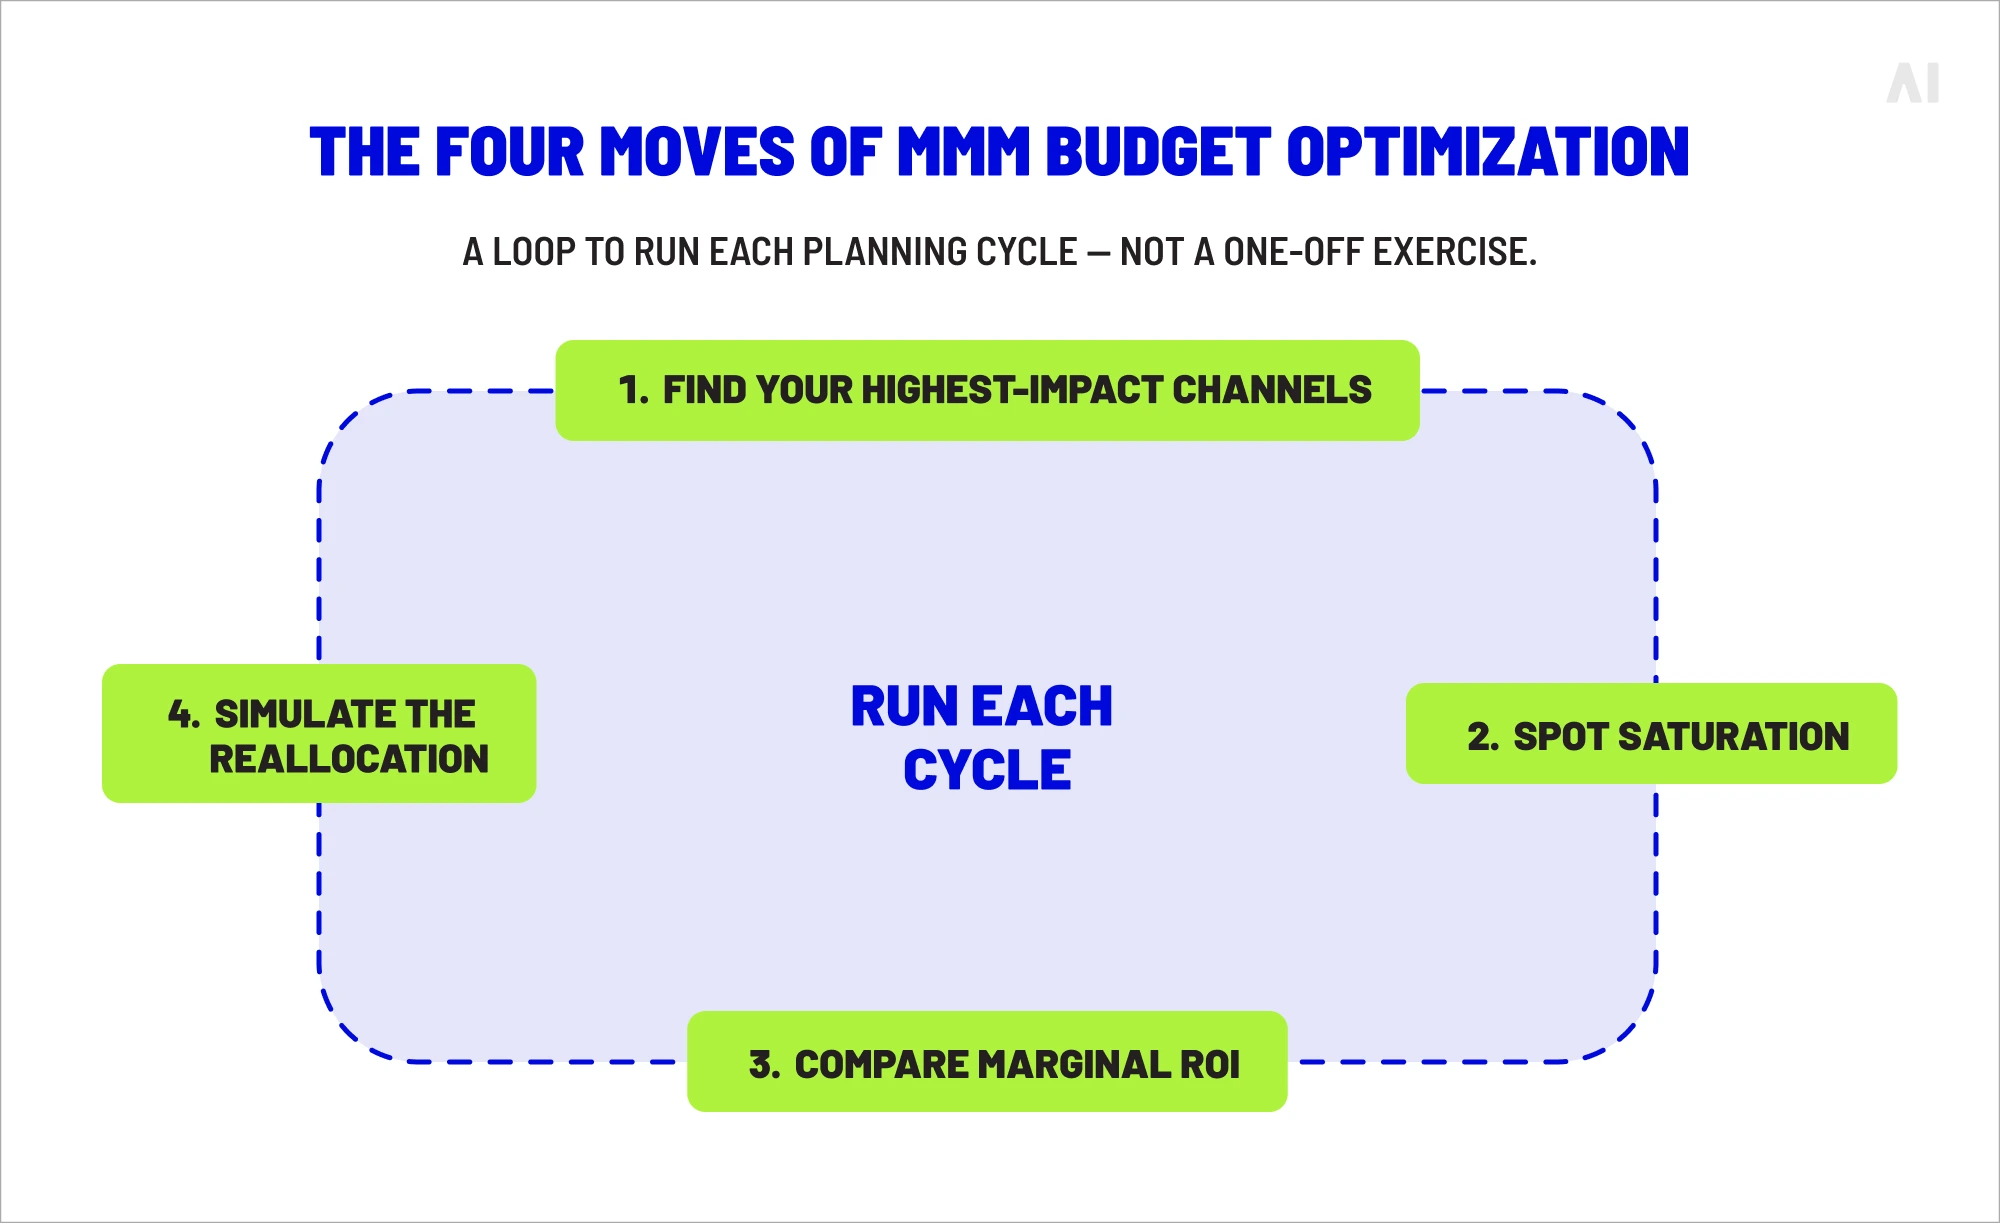
Turning a model into a budget comes down to four moves, performed in order: find the channels doing the most work, find the ones that have stopped absorbing money well, compare the return on the next dollar across all of them, and simulate the reallocation before you commit to it.
This is the tactical core of media optimization — what to do with the model you have, this quarter, not the longer project of building it into the planning calendar, which comes later.
1. Find your highest-impact channels
Start by comparing each channel's contribution with its share of the budget. The aim is to surface the mismatches: channels that carry the plan on a modest budget, and channels consuming a large slice of spend while contributing far less than their cost implies.
A channel taking 10% of the budget but driving 25% of incremental revenue is under-indexed to its own results — a strong candidate for more money. One taking 25% of the budget to deliver 10% of revenue is the reverse, and deserves scrutiny before another dollar goes in.
Contribution analysis is what makes these imbalances visible; without it, budgets ossify around whichever channels shouted loudest in the last planning meeting.
💡 Related reads: Profit on ad spend explained.
2. Know when a channel is saturated
Contribution tells you which channels are doing the work; the response curve tells you whether they can take any more money. A channel can be your single biggest contributor and still be the wrong place to invest, if it has reached the flat part of its curve.
Saturation is the point at which additional spend stops generating a worthwhile return. A channel that has hit it will keep posting a respectable average ROI — all that historic, efficient spend is still in the average — while its marginal return slides toward nothing.
Reading the curve, rather than the headline ROI, is what stops you pouring money into a channel that has nothing left to give. It also flags the opposite case: a channel still climbing steeply, with room to absorb more before it bends.
3. Compare marginal ROI across channels
With saturation mapped, the central allocation decision becomes straightforward to state, if not always to make: rank channels by the return on their next dollar, and move money toward the top of that ranking. This is where the average-versus-marginal distinction stops being theory and starts being budget.
The principle borrows from basic economics. A budget is at its most efficient when the marginal return on the last dollar is roughly equal across every channel — because if one channel's next dollar earns more than another's, you can lift total results, at no extra cost, simply by moving money from the lower to the higher. You keep reallocating until the marginal returns even out.
In practice you will never reach perfect equilibrium, and you should not chase it past the point of useful precision, but the direction of every good reallocation is the same: away from low marginal returns, toward high ones.

4. Reallocate budget with scenario planning
Before committing a single dollar, model the move. Budget simulations let you ask what a 10% cut to one channel and a corresponding increase to another would do to expected revenue, and to see the answer before the quarter is spent rather than after.
This is about confidence as much as accuracy. A reallocation backed by a simulation — here is the projected revenue under the current plan, here it is under the proposed one, here is the difference — is a far easier case to take to a CFO than a hunch dressed up as strategy. Scenario planning also lets you stress-test the downside: what happens if the model is wrong by a margin, whether the gain survives a worse-than-expected response. Caution modeled in advance is cheaper than caution learned in arrears.
Example of MMM-driven budget reallocation
To see the four moves working together, consider a brand with a $4 million quarterly media budget split across five channels. The model returns the contribution, average ROI, and marginal ROI for each, along with where each sits on its curve.
- Read on average ROI alone, paid social is the star of this plan at 4.2x, and the obvious place to invest more.
- Read on marginal ROI, it is the obvious place to invest less: at 1.1x, its next dollar barely breaks even, because the channel is saturated and all that strong average is built on spend that already happened.
Out-of-home is weak on both counts. Connected TV, meanwhile, has the headroom — a 2.8x marginal return and room on its curve to absorb more.
The reallocation writes itself. Pull $300,000 from saturated paid social and $250,000 from over-invested out-of-home, then redeploy $400,000 into connected TV and $150,000 into paid search. Total spend does not move; the budget stays at $4 million.
But because the freed money was earning roughly a dollar back and the redeployed money earns close to three, the same budget is projected to generate on the order of $0.9 million in additional incremental revenue — a substantial gain bought with no extra investment, only a better-informed distribution of the money already in hand.
That is media mix optimization in a single quarter, and the highest-average-ROI channel was the one to take money from, not give it to.
MMM vs. multi-touch attribution for budget allocation
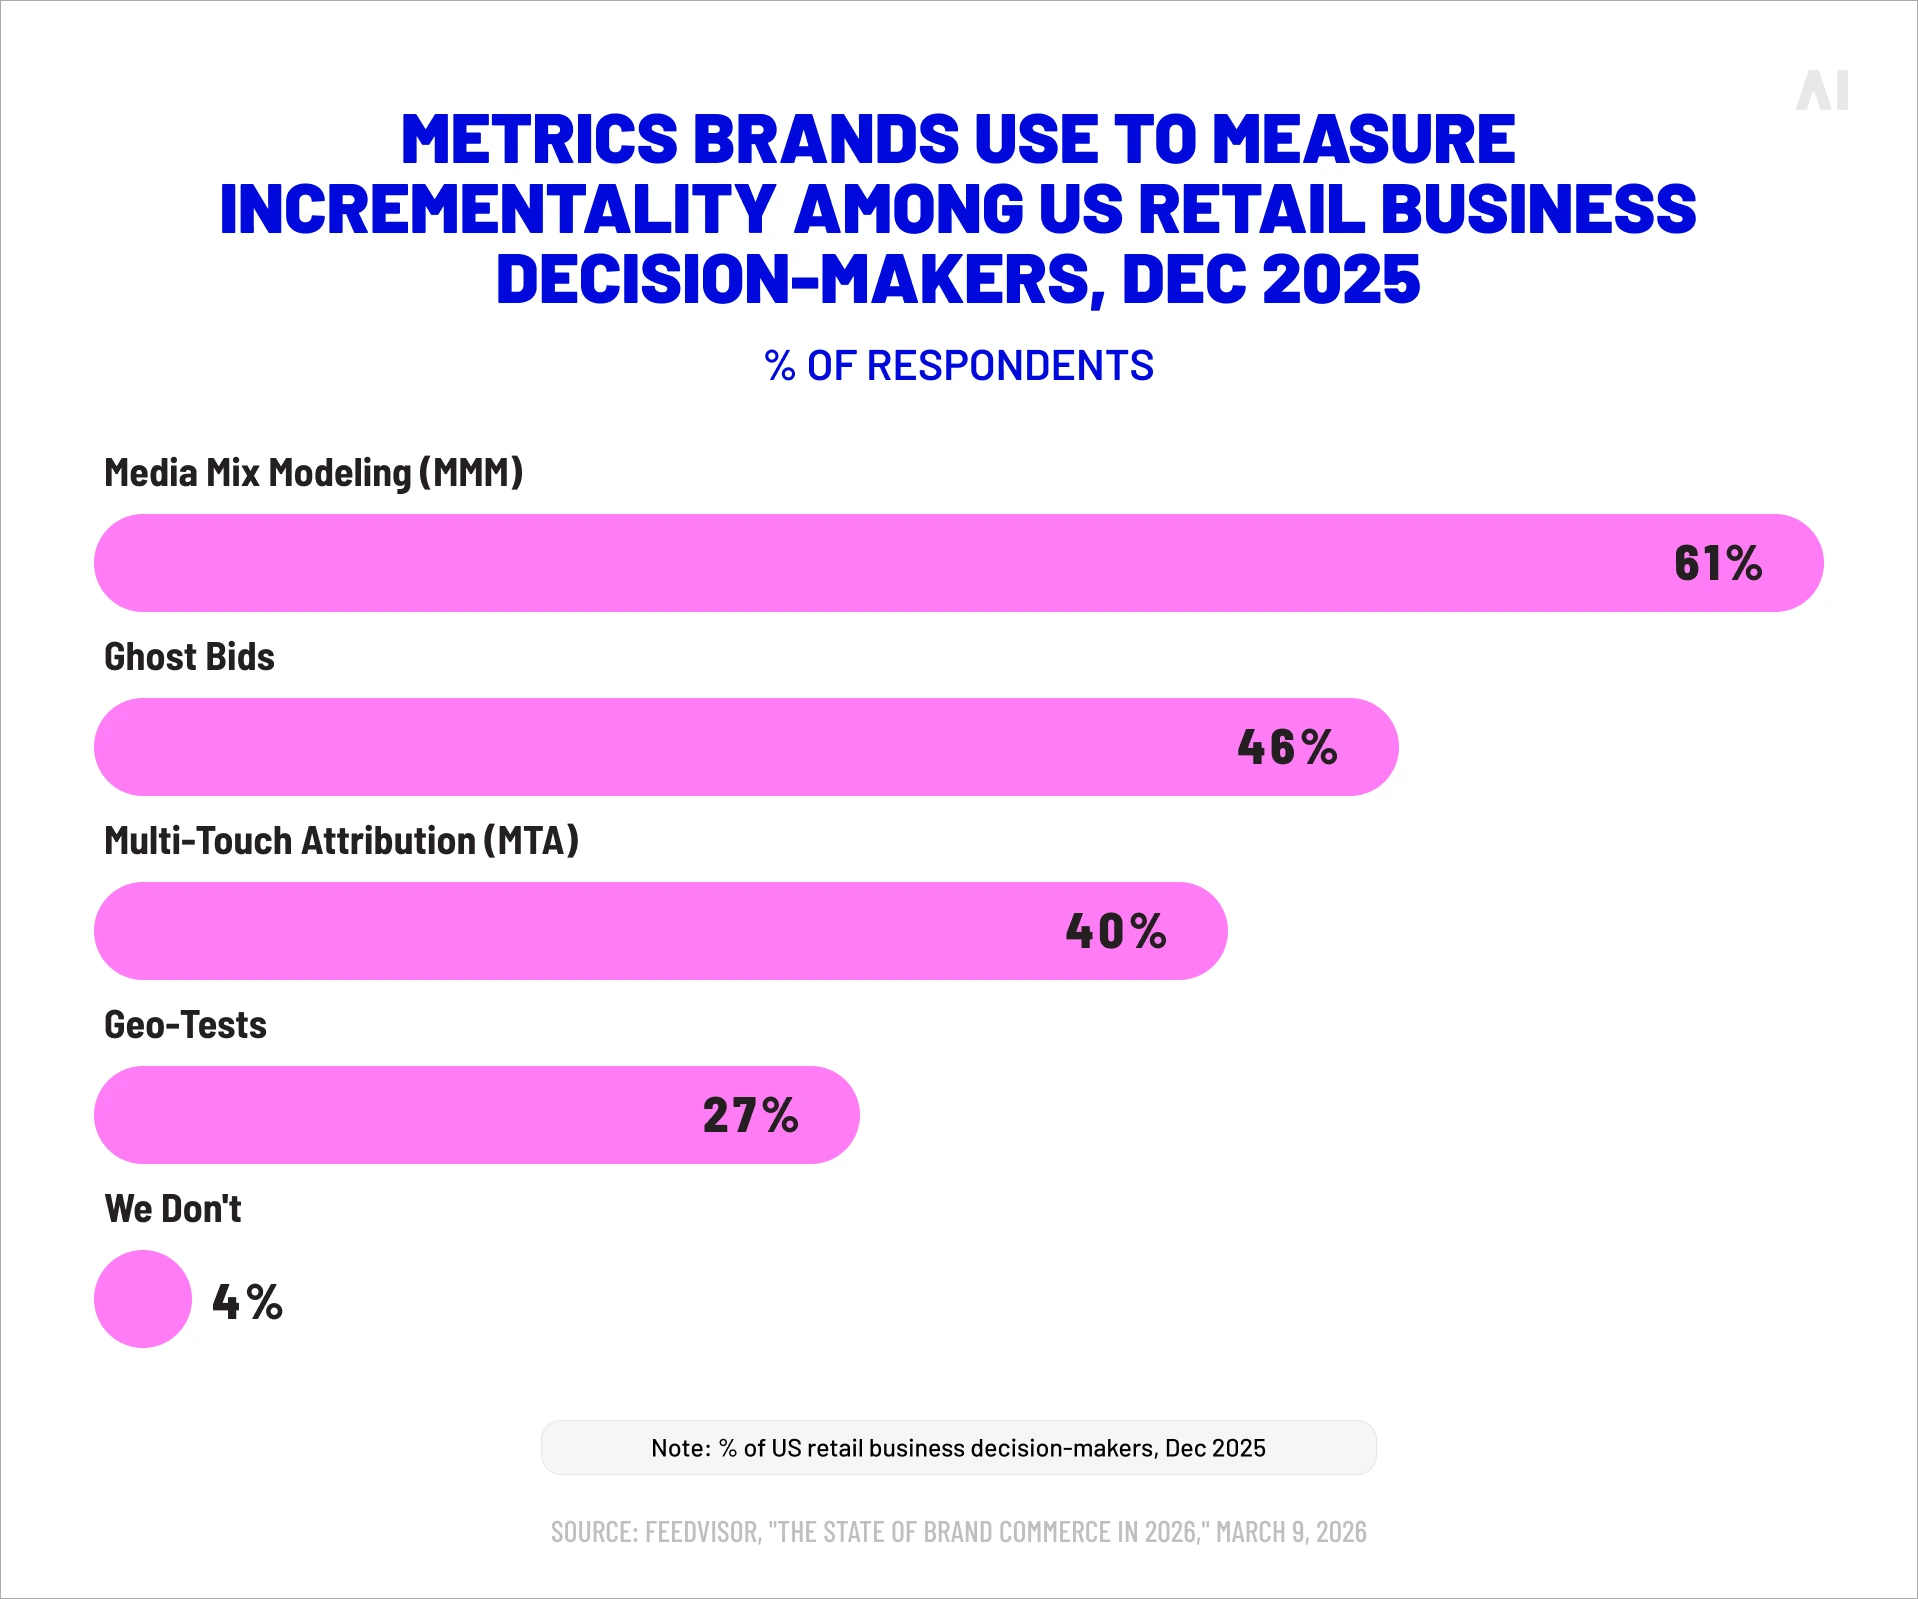
MMM and multi-touch attribution (MTA) are not rivals so much as instruments built for different jobs, and the budget mistakes come from using one to answer questions that belong to the other.
- MTA reads digital journeys at speed and granularity, which makes it strong for in-flight, in-channel optimization.
- MMM works at the aggregate level across online and offline, which makes it strong for allocation and planning.
The most capable organizations run both and let each do what it is good at.
When attribution is the better choice
Attribution earns its place in the day-to-day mechanics of digital campaigns — the fast, granular decisions MMM is too slow and too coarse to inform. Which keyword deserves a higher bid, which audience segment is converting, which creative variant to retire, how to manage spend within a platform over the course of a week: these are attribution's home ground. The signal is immediate and channel-level, which is exactly what tactical optimization needs and exactly what an aggregate model cannot provide.
When MMM is the better choice
MMM is the better instrument whenever the decision is about the budget rather than the campaign. Splitting investment across channels, weighing online against offline, judging whether to fund a brand effort that will pay back slowly, setting the overall structure of the annual plan — these call for a method that sees the whole picture and accounts for what attribution cannot track. Where attribution optimizes within channels, MMM allocates between them, which is why it sits at the center of any serious media mix modeling strategy.
Unified measurement: running both without contradiction
The apparent tension between the two methods dissolves once they are assigned different roles. Attribution governs the daily, in-channel work; MMM governs the periodic question of how much each channel should get in the first place. The friction only arises when teams expect the two to produce identical numbers — they will not, because they measure different things on different timescales.
The stronger practice is to let them check each other. Incrementality experiments and holdout tests can calibrate the model, so that MMM's estimates are anchored to real-world causal results rather than left to stand on regression alone. Run that way, the methods stop competing and start corroborating: when they agree, confidence rises; when they disagree, you have found something worth investigating rather than an argument to have.
💡 Related reads: Unified marketing measurement: why attribution alone no longer works
Common MMM pitfalls that affect budget decisions
A model is only as good as the decisions it survives contact with, and several recurring problems can turn a sound-looking output into a poor reallocation. The ones below do the most damage to budgets, and all of them are avoidable with a little discipline before the money moves.
Validating MMM recommendations
The first discipline is to treat a model's recommendation as a hypothesis rather than a verdict. A regression can fit the past beautifully and still mislead about the future, so the reallocations it suggests should be checked before they are scaled.
The cleanest check is an experiment.
Run a geo holdout or a conversion-lift test on a proposed move, and see whether the real-world result matches what the model predicted. Where they agree, you can act with confidence; where they part ways, the experiment wins, because it observes causality directly while the model only infers it.
Pair this with ordinary business judgment — a recommendation that contradicts everything the commercial team knows about its customers deserves a second look before, not after, the budget changes. Letting a test settle disagreements takes the pressure off the model to be perfect and puts it where it belongs, on continuous learning.
Channel overlap and attribution challenges
When channels run heavily in the same place at the same time, the model can struggle to tell their effects apart. Statisticians call this collinearity; in plain terms, if two channels always rise and fall together, the data cannot easily say which one moved the result, and the contribution it assigns to each becomes unreliable.
For allocation, that is a real danger: a confidently wrong contribution estimate produces a confidently wrong budget. Heavy overlap — a brand that always runs social and display in lockstep, say — should be a prompt for caution rather than blind trust, and sometimes for a deliberate variation in spend that gives the model the separation it needs to learn. A recommendation built on tangled inputs is worth less than the precision of its decimal places suggests.
💡 Related reads: Marketing Attribution Challenges: Why Traditional Attribution Models Don’t Work Anymore
Data quality and model reliability
A model's recommendations can be no better than the data underneath them, and weak data is the most common reason good intentions produce bad allocations. Volume, history, and hygiene all bear on whether a model can be trusted with real money.
This is not a marginal concern. In the Harvard Business Review Analytic Services research, data quality was the single most cited obstacle to acting on MMM, named by 47% of respondents, ahead of every tooling or talent problem. Thin history starves a model of the variation it needs to learn from; channels that change too rarely never reveal their curves; spend, impression, and outcome data scattered across incompatible systems arrives misaligned and full of gaps. None of this is glamorous to fix, and all of it determines whether the budget you set on the model's advice is sound or merely confident.
ROI vs. growth potential
The most expensive misreading in allocation is to treat the highest-ROI channel as the best home for new money. It usually is not, and the reason ties together everything above.
A channel posts a high average ROI precisely because it has been fed well and has performed — which often means it is already deep into its response curve, near or at saturation, with little marginal return left to give. The best place for growth is rarely the channel with the best record; it is the channel with the best prospects, the one whose marginal ROI is still high because it has been underfunded relative to its potential.
Confusing the two — rewarding past performance instead of future return — sends new budget to channels that cannot use it and away from channels that can. Marginal ROI is the corrective: it points not at what has worked, but at what will.
Scaling MMM into an ongoing planning framework
A single model run is a snapshot, useful for one set of decisions and stale soon after. The organizations that get the most from media mix optimization treat it not as a periodic audit but as a standing input to planning — wired into the calendar, the goals, and the tools so that each cycle builds on the last rather than starting from a blank page.
⚡ A model that never changes a budget is an expensive history lesson.
Getting there is as much an organizational project as an analytical one. It means agreeing what the model is for, setting rules for how its outputs become decisions, putting those outputs where planners can actually use them, feeding the model cleaner data over time, and extending the whole apparatus across teams and markets.
💡 Related reads: Advertising intelligence | From data to decisions: how marketing intelligence transforms performance strategy
Align MMM with business goals
A model should be built around the outcome the business actually cares about, not the metric that happens to be easiest to measure. Configured against revenue, profit, or customer acquisition, MMM produces recommendations a CFO can act on; configured against platform-level proxies, it produces recommendations that optimize the dashboard and little else.
The choice of objective changes the answer. A model tuned to maximize revenue will favor a different channel mix than one tuned to maximize profit, because the cheapest revenue and the most profitable revenue rarely come from the same place. Deciding what you are optimizing for, before you optimize, is what keeps the model's recommendations pointed at the business rather than at a number that flatters it.
💡 Related reads: Creating a data-driven marketing strategy
Create budget allocation guidelines
Once a model is producing trustworthy outputs, the next step is to turn its recurring lessons into standing rules, so that each planning cycle is not rebuilt from scratch. Allocation guidelines and performance benchmarks give budget decisions a consistent backbone and a shared reference point.
In practice this means writing down what the model keeps telling you: the spend ceilings at which key channels saturate, the marginal-ROI threshold below which a channel gets no new money, the minimum test budget reserved for channels the model cannot yet read well. Codified this way, the model's intelligence outlives any single run and any single planner, and the organization stops relearning the same lessons every quarter.
Operationalize MMM insights
The hardest part of media mix optimization is rarely the modeling; it is moving the output into the room where budgets are decided, quickly enough to act on. The actionability gap that opened this article is, at bottom, an operational problem — the distance between an insight and a decision.

The evidence that this distance is where value leaks away is consistent. The CMO Survey found in January 2026 that no marketing technology capability is currently delivering at its full potential, with adoption outpacing the organizational ability to use it — a reminder that owning a tool and getting value from it are different achievements.
A marketing intelligence platform such as Elevate is built to close that distance: rather than leaving scenario analysis, reporting, and budget recommendations scattered across disconnected tools and slide decks, it brings them into one environment, so that a model's output can become a planning decision without losing a fortnight in translation.
💡 Related reads: Marketing Analytics vs Marketing Intelligence: Why the Difference Matters for Growth
Improve model reliability with better data
Because a model's recommendations rise or fall with the quality of its inputs, the most durable way to improve media mix optimization is to improve the data going in — and that includes the integrity of the media supply itself. A model fed bid-stream data riddled with recycled impressions and opaque intermediaries will produce blurrier estimates than one fed clean, transparent execution.
This is where supply-path discipline pays off in measurement as well as in media. AI Digital's Open Garden framework keeps execution vendor-neutral and transparent across channels, and its supply-side curation tool, Smart Supply, filters inventory toward clean, performant placements rather than whatever the bid stream happens to recycle. The benefit compounds: better-quality media produces better-quality data, which produces more reliable contribution estimates, which produce budget recommendations you can stand behind. Measurement and execution are not separate problems, and treating them as one improves both.
💡 Related reads: Walled gardens vs the open internet | Cross-platform measurement
Embed MMM across teams and markets
The final step is to take a method that began as a single team's project and make it a shared input across the organization. MMM becomes most valuable when it feeds multi-market budgeting, cross-team forecasting, and the executive reviews where investment is actually decided.
Scaling it sustainably is a question of infrastructure and cadence rather than ambition. It means a consistent modeling approach across markets so results can be compared rather than argued over, a refresh schedule that keeps outputs current without overwhelming the analysts who maintain them, and a common language so that finance, marketing, and regional teams read the same numbers the same way. Embedded like this, MMM stops being a thing one team does and becomes the way the organization plans.
💡 Related reads: Marketing measurement framework: building a scalable system for smarter decisions
Turning MMM into a competitive advantage
The organizations that pull ahead on media mix optimization will not be the ones with the most sophisticated models. They will be the ones that act on them — closing the gap between insight and decision, treating allocation as a continuous discipline rather than an annual event, and feeding the whole system cleaner data over time. As user-level tracking continues to fade, the privacy-durable measurement MMM offers stops being a fallback and becomes the foundation, and the advantage accrues to whoever can turn its outputs into budget moves fastest and most reliably.
Turning models into moves is what AI Digital is for. Through the Elevate intelligence platform, the vendor-neutral Open Garden framework, and Smart Supply curation, the goal is a measurement-and-execution loop where cleaner media produces better data, better data produces more reliable models, and more reliable models produce budget decisions that compound quarter on quarter. If you are working to turn media mix modeling from a report into a repeatable advantage, get in touch — it is the kind of problem we like.
💡Related reads: Marketing measurement strategy: how to measure and optimize performance across channels