TV Viewership Trends in 2026: What Advertisers Need to Know

TV viewership trends in 2026 point to a simple reality: television is not disappearing—it is being watched differently. Audiences now move between broadcast and cable channels, streaming services, live programming, and digital-first platforms, often using the same TV screen. In July 2026, streaming accounted for 49% of total U.S. TV-screen viewing time, according to Nielsen’s The Gauge. However, linear TV still brings large audiences together around live sports, news, major events, and seasonal programming.
These changing viewing habits make media planning more complex. Viewing share is not the same as audience reach: a headline percentage does not reveal who watched, how many unique people were reached, or whether the same audiences moved between platforms. This article explores the main shifts shaping television viewership and explains how advertisers can use the data to combine linear and streaming, extend reach, manage frequency, adapt creative, and measure performance across an increasingly fragmented TV environment.
TL;DR: Key Takeaways
- Streaming is now central to television viewing. Its 49% share of U.S. TV-screen time in July 2026 confirms that streaming is no longer an incremental viewing behavior, although one month should not be treated as a permanent market share.
- Linear TV remains relevant in high-attention contexts. Live sports, news, major events, and seasonal programming can still concentrate large audiences. In June 2026, the World Cup and NBA Finals helped increase broadcast sports viewing by 118% month over month.
- Ad-supported streaming is increasingly mainstream. Ad-supported content represented 71.5% of total U.S. TV viewing in Q2 2026, with streaming capturing 48.2% of that ad-supported viewing as paid ad tiers and FAST services expanded advertiser-accessible environments.
- Audiences are fragmented across platforms and viewing models. National averages can hide differences by age, content preference, and service type, while viewing share measures time—not unique audience reach or available advertising inventory.
- Linear and streaming should be planned as complementary environments. The appropriate mix depends on audience composition, geography, content context, campaign scale, and objective. Actual incremental reach and frequency should be evaluated with deduplicated campaign-level data rather than inferred from national viewing shares alone.
What Does TV Viewership Mean in 2026?
In 2026, TV viewership is no longer limited to scheduled programmes delivered through broadcast and cable networks. It also includes on-demand shows, live streams, FAST channels, and digital-first videos watched through connected television screens. However, the meaning of “TV viewing” still depends on what a particular measurement source includes.
These distinctions matter because the screen, delivery method, content type, and measurement category are not interchangeable. A creator video watched through YouTube on a smart TV contributes to television-screen viewing, even though it is not traditional TV programming. Conversely, a live cable channel delivered through YouTube TV uses internet-based distribution but may still be classified as cable viewing in Nielsen’s methodology.
Nielsen’s The Gauge, for example, provides a monthly view of U.S. broadcast, cable, streaming, and other activity occurring through television screens. Its total-TV figures include both ad-supported and ad-free viewing and are separate from the currency ratings used to transact television advertising. A streaming share from The Gauge therefore describes the percentage of measured TV-screen time spent streaming—not streaming’s share of all video consumption across every device, the number of people reached, or the amount of advertising inventory available.
Before comparing TV viewership statistics, advertisers should check four details:
- Geography and audience: Does the figure cover the U.S. population, a specific demographic, households, or individual viewers?
- Device coverage: Does it measure television screens only or also include mobile, desktop, and tablet viewing?
- Denominator: Is the percentage based on total TV viewing, streaming viewing, or ad-supported TV viewing?
- Period and methodology: Does it represent one month, one quarter, a consumer survey, platform data, or panel-based measurement?
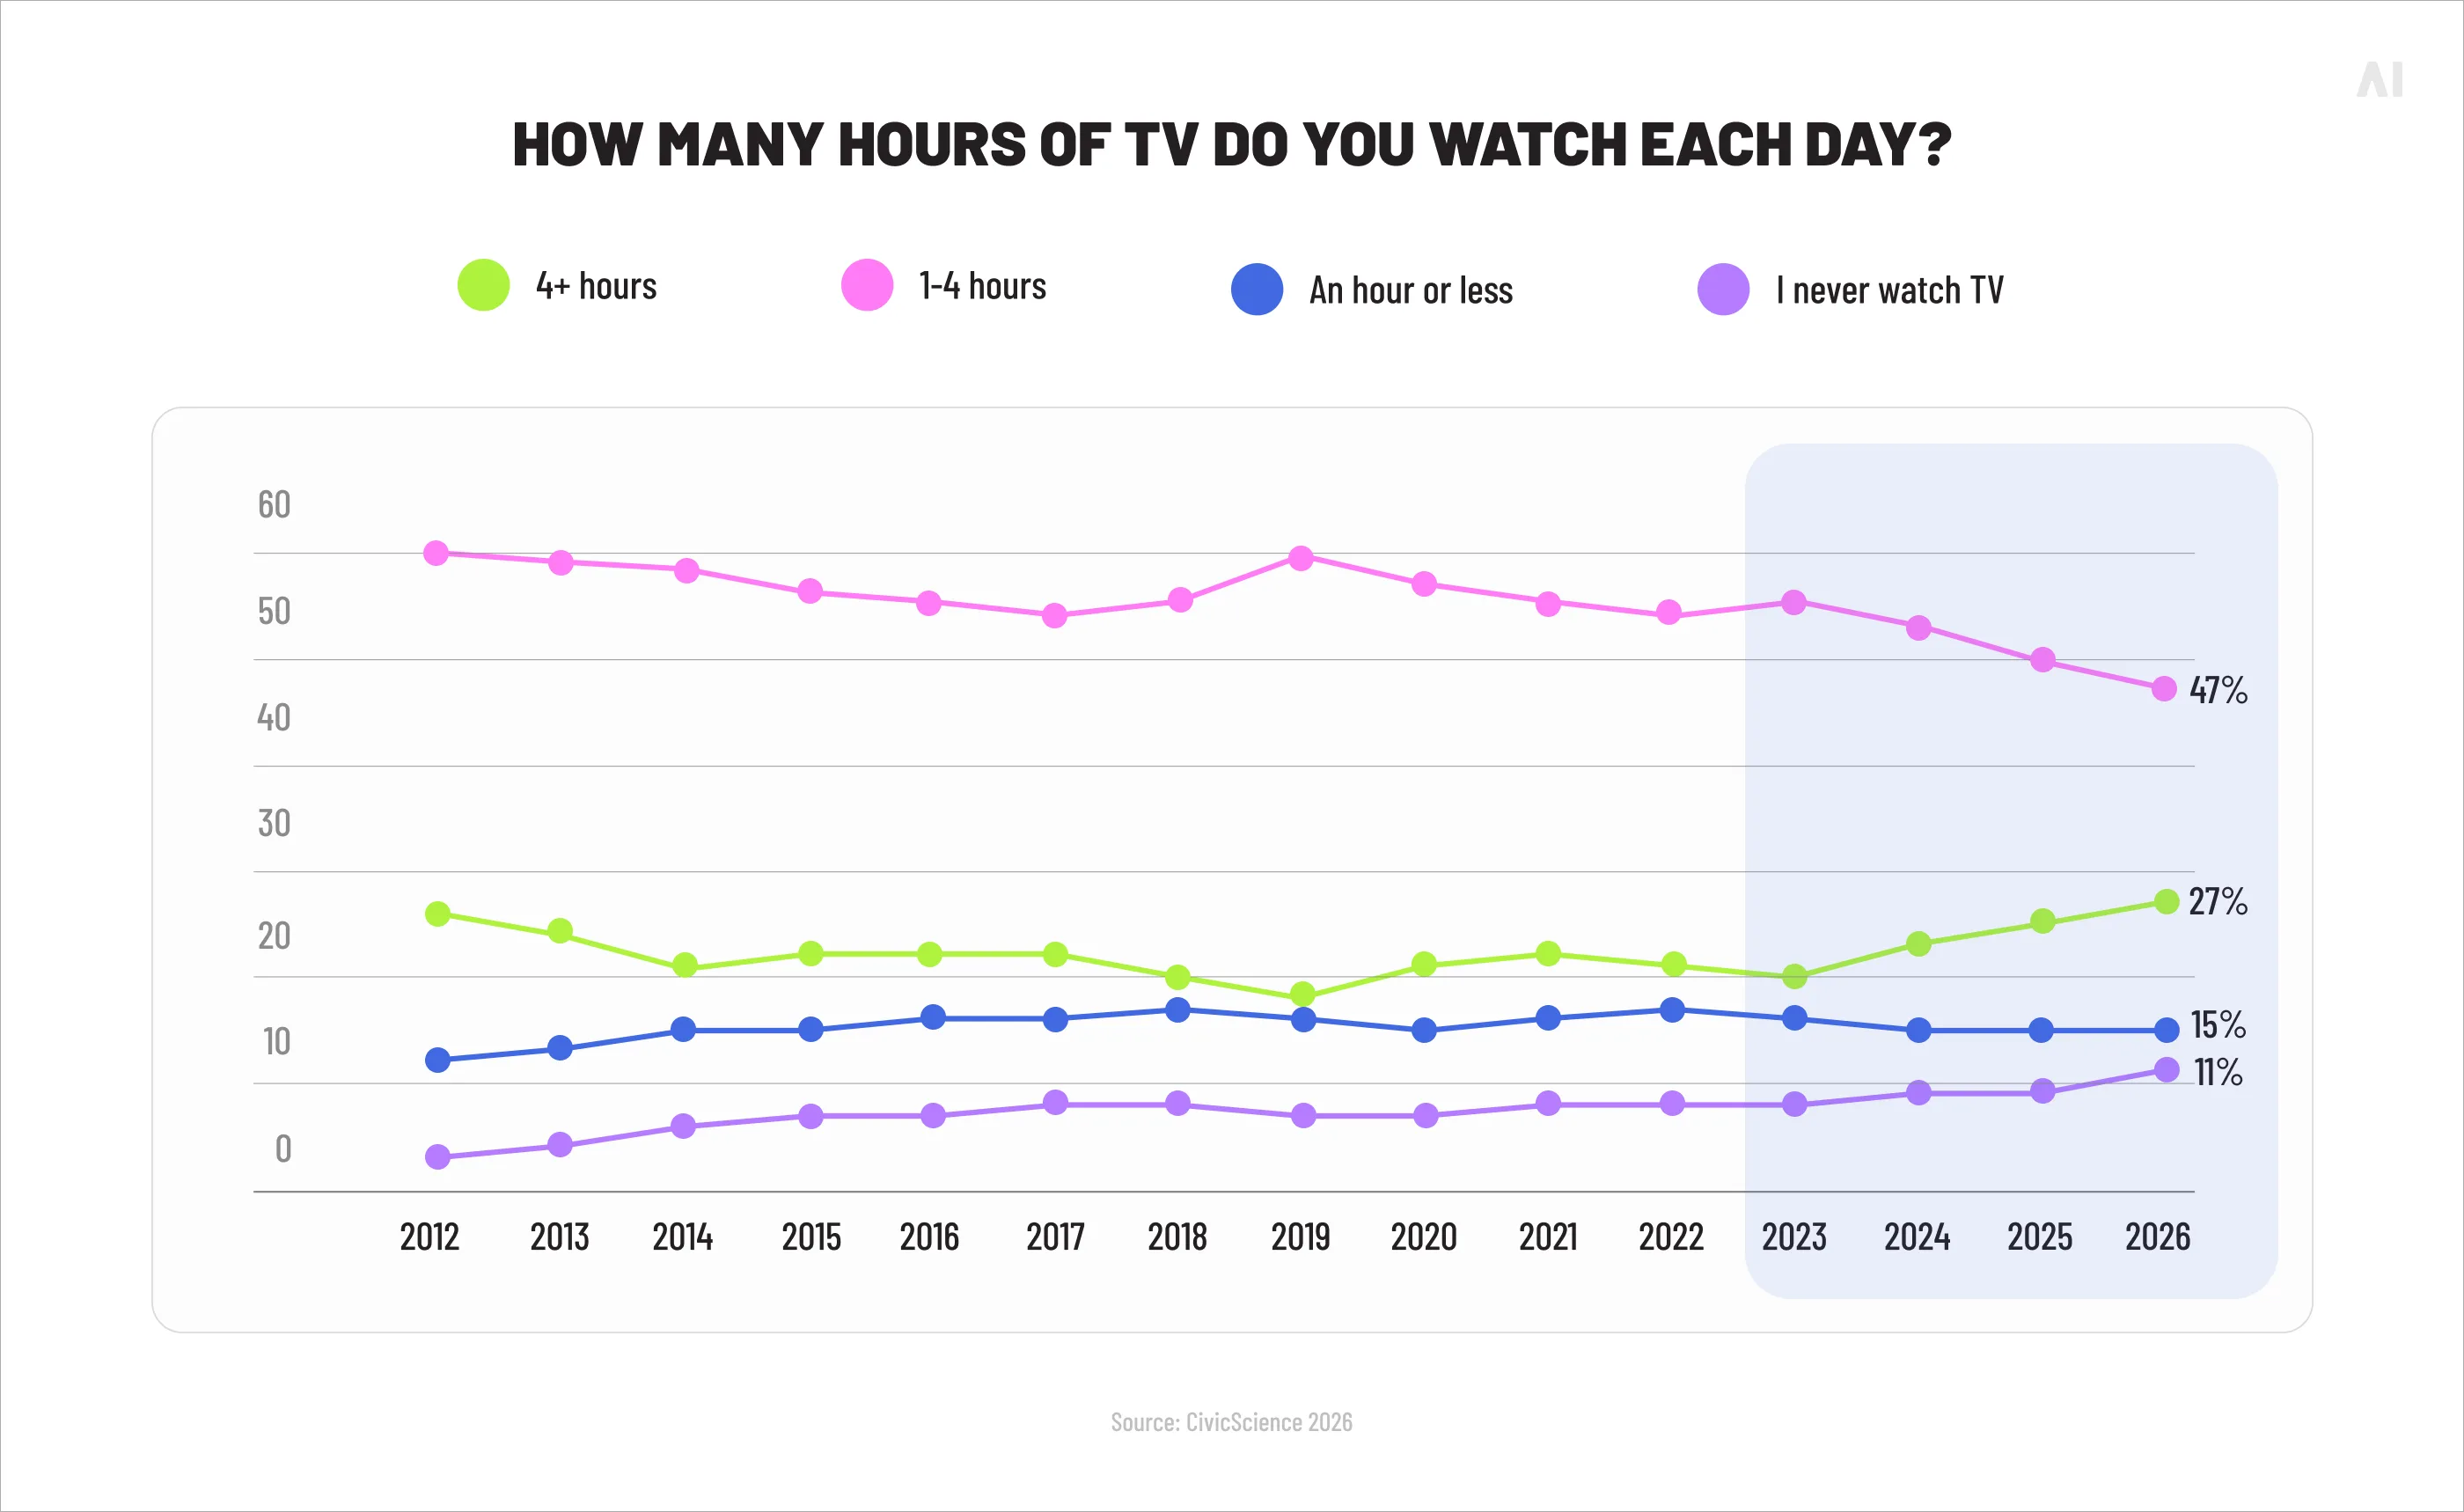
These distinctions are essential when interpreting connected TV statistics, because device adoption, audience reach, and TV-screen viewing measure different aspects of consumer behavior.
The TV Viewership Trends Shaping 2026
The most important TV viewing trends in 2026 are not simply about streaming replacing traditional television. They show how attention is being redistributed across delivery methods, platforms, content types, and viewing occasions. The following trends explain what is changing in U.S. television viewership, what the available evidence actually demonstrates, and how advertisers should interpret it.
Streaming Is Now at the Center of TV Viewing
Streaming has moved beyond being an additional way to watch television. It now represents a central part of everyday TV-screen viewing.
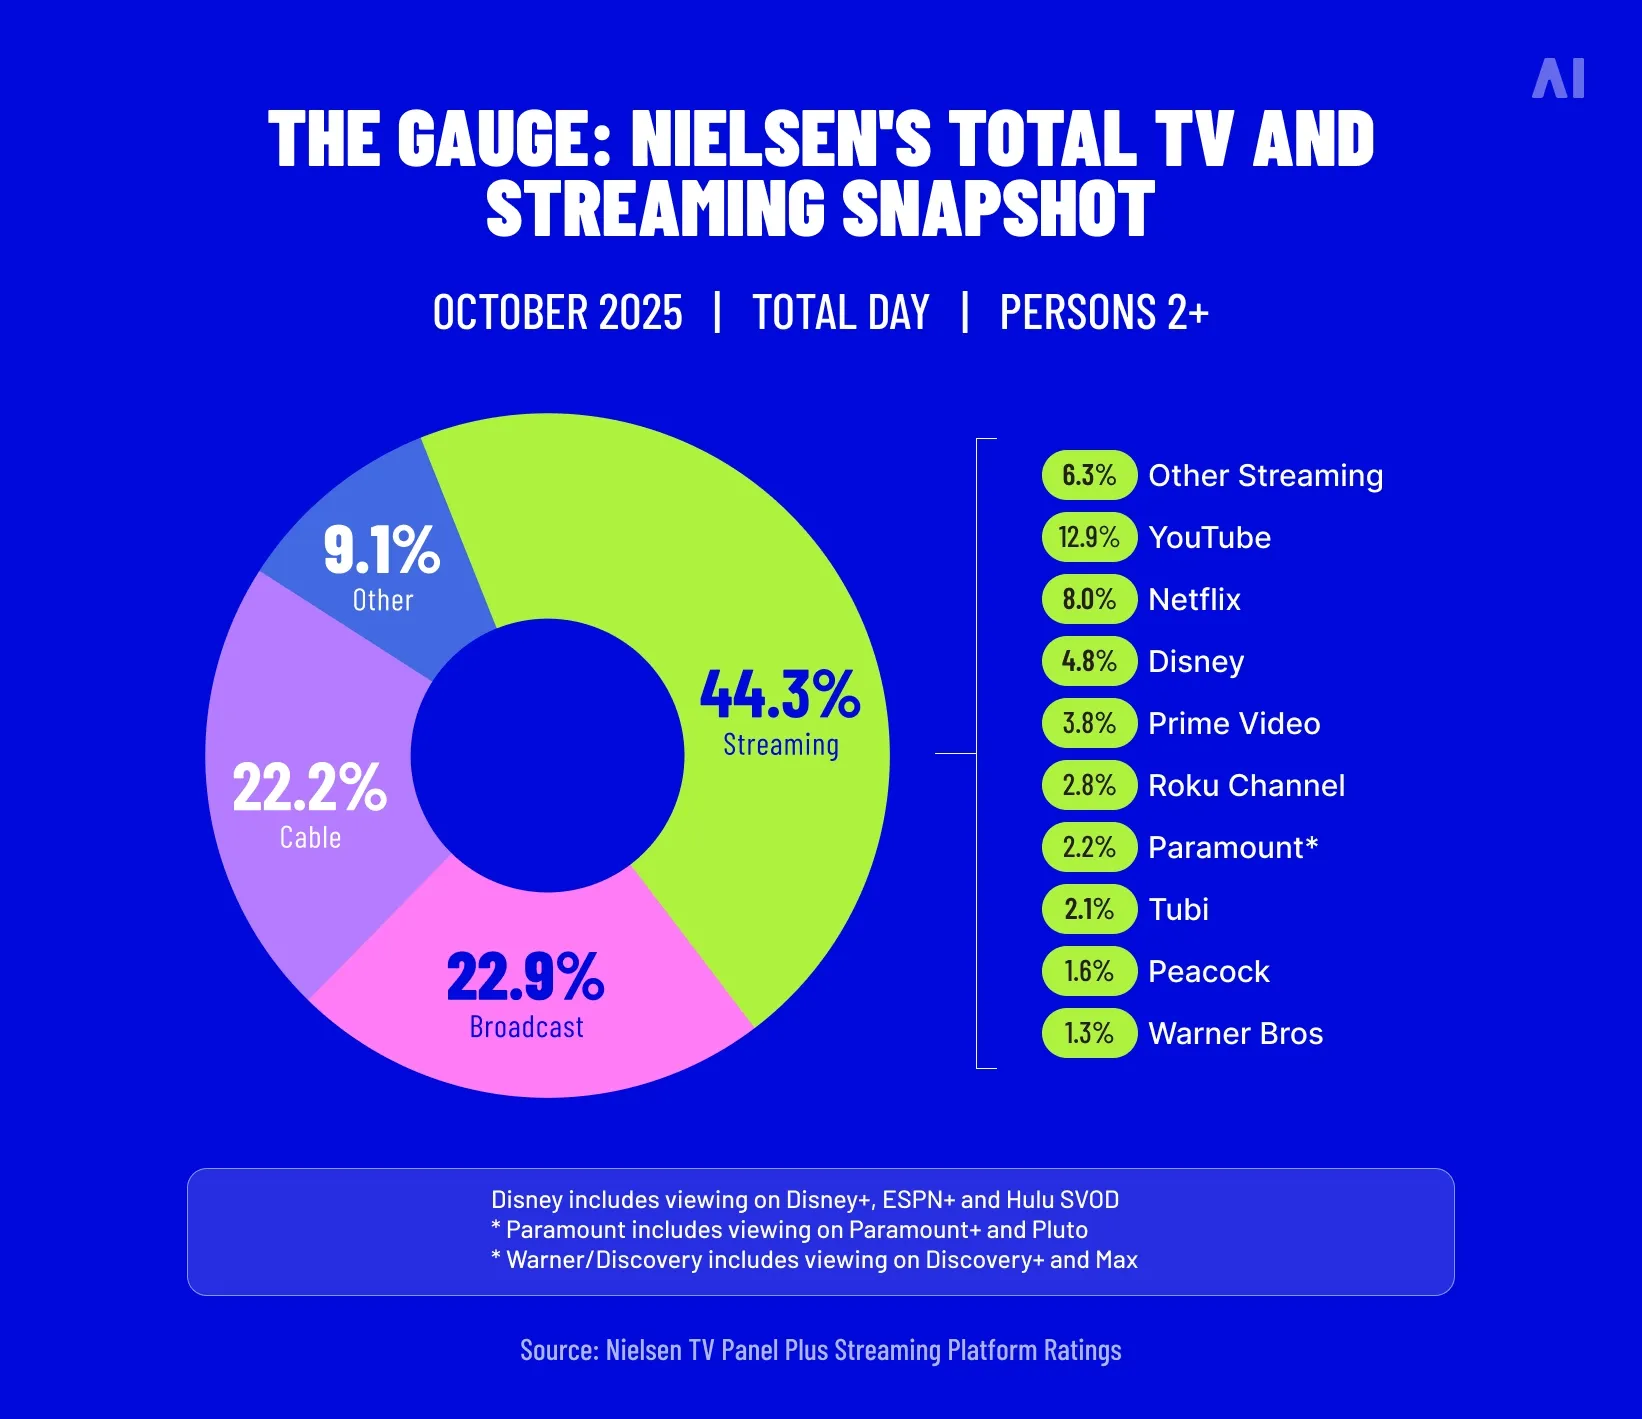
A same-month comparison provides stronger evidence of this structural shift than a single record. In May 2025, streaming accounted for 44.8% of total U.S. TV viewing time. By May 2026, its share had increased to 48.6%—a gain of 3.8 percentage points in one year.
The comparison also helps separate sustained change from normal monthly variation.
Streaming often rises during the summer when school is out, audiences have more time to watch, and broadcast schedules contain fewer new programmes. However, the year-over-year increase indicates that streaming viewership is expanding beyond one seasonal peak.
This does not mean every streaming service is growing at the same rate or reaching the same audience. Viewing can shift quickly when a platform releases a popular series, carries a major live event, or expands its content library. National viewing share also says little about how much incremental reach an individual service can deliver for a particular campaign.
What this means for advertisers: Streaming should no longer be treated as a small extension of a linear TV plan. It belongs in the core media-planning process, but the appropriate balance between streaming TV advertising and linear television should still depend on the target audience, content context, geography, and campaign objective.
Linear TV Still Concentrates Attention Around Major Moments
Linear TV viewership has declined as a share of overall television time, but broadcast and cable remain substantial viewing environments. In July 2026, broadcast represented 19.5% of total U.S. TV viewing, while cable accounted for another 18.7%. Together, they still generated more than one-third of measured television-screen time.
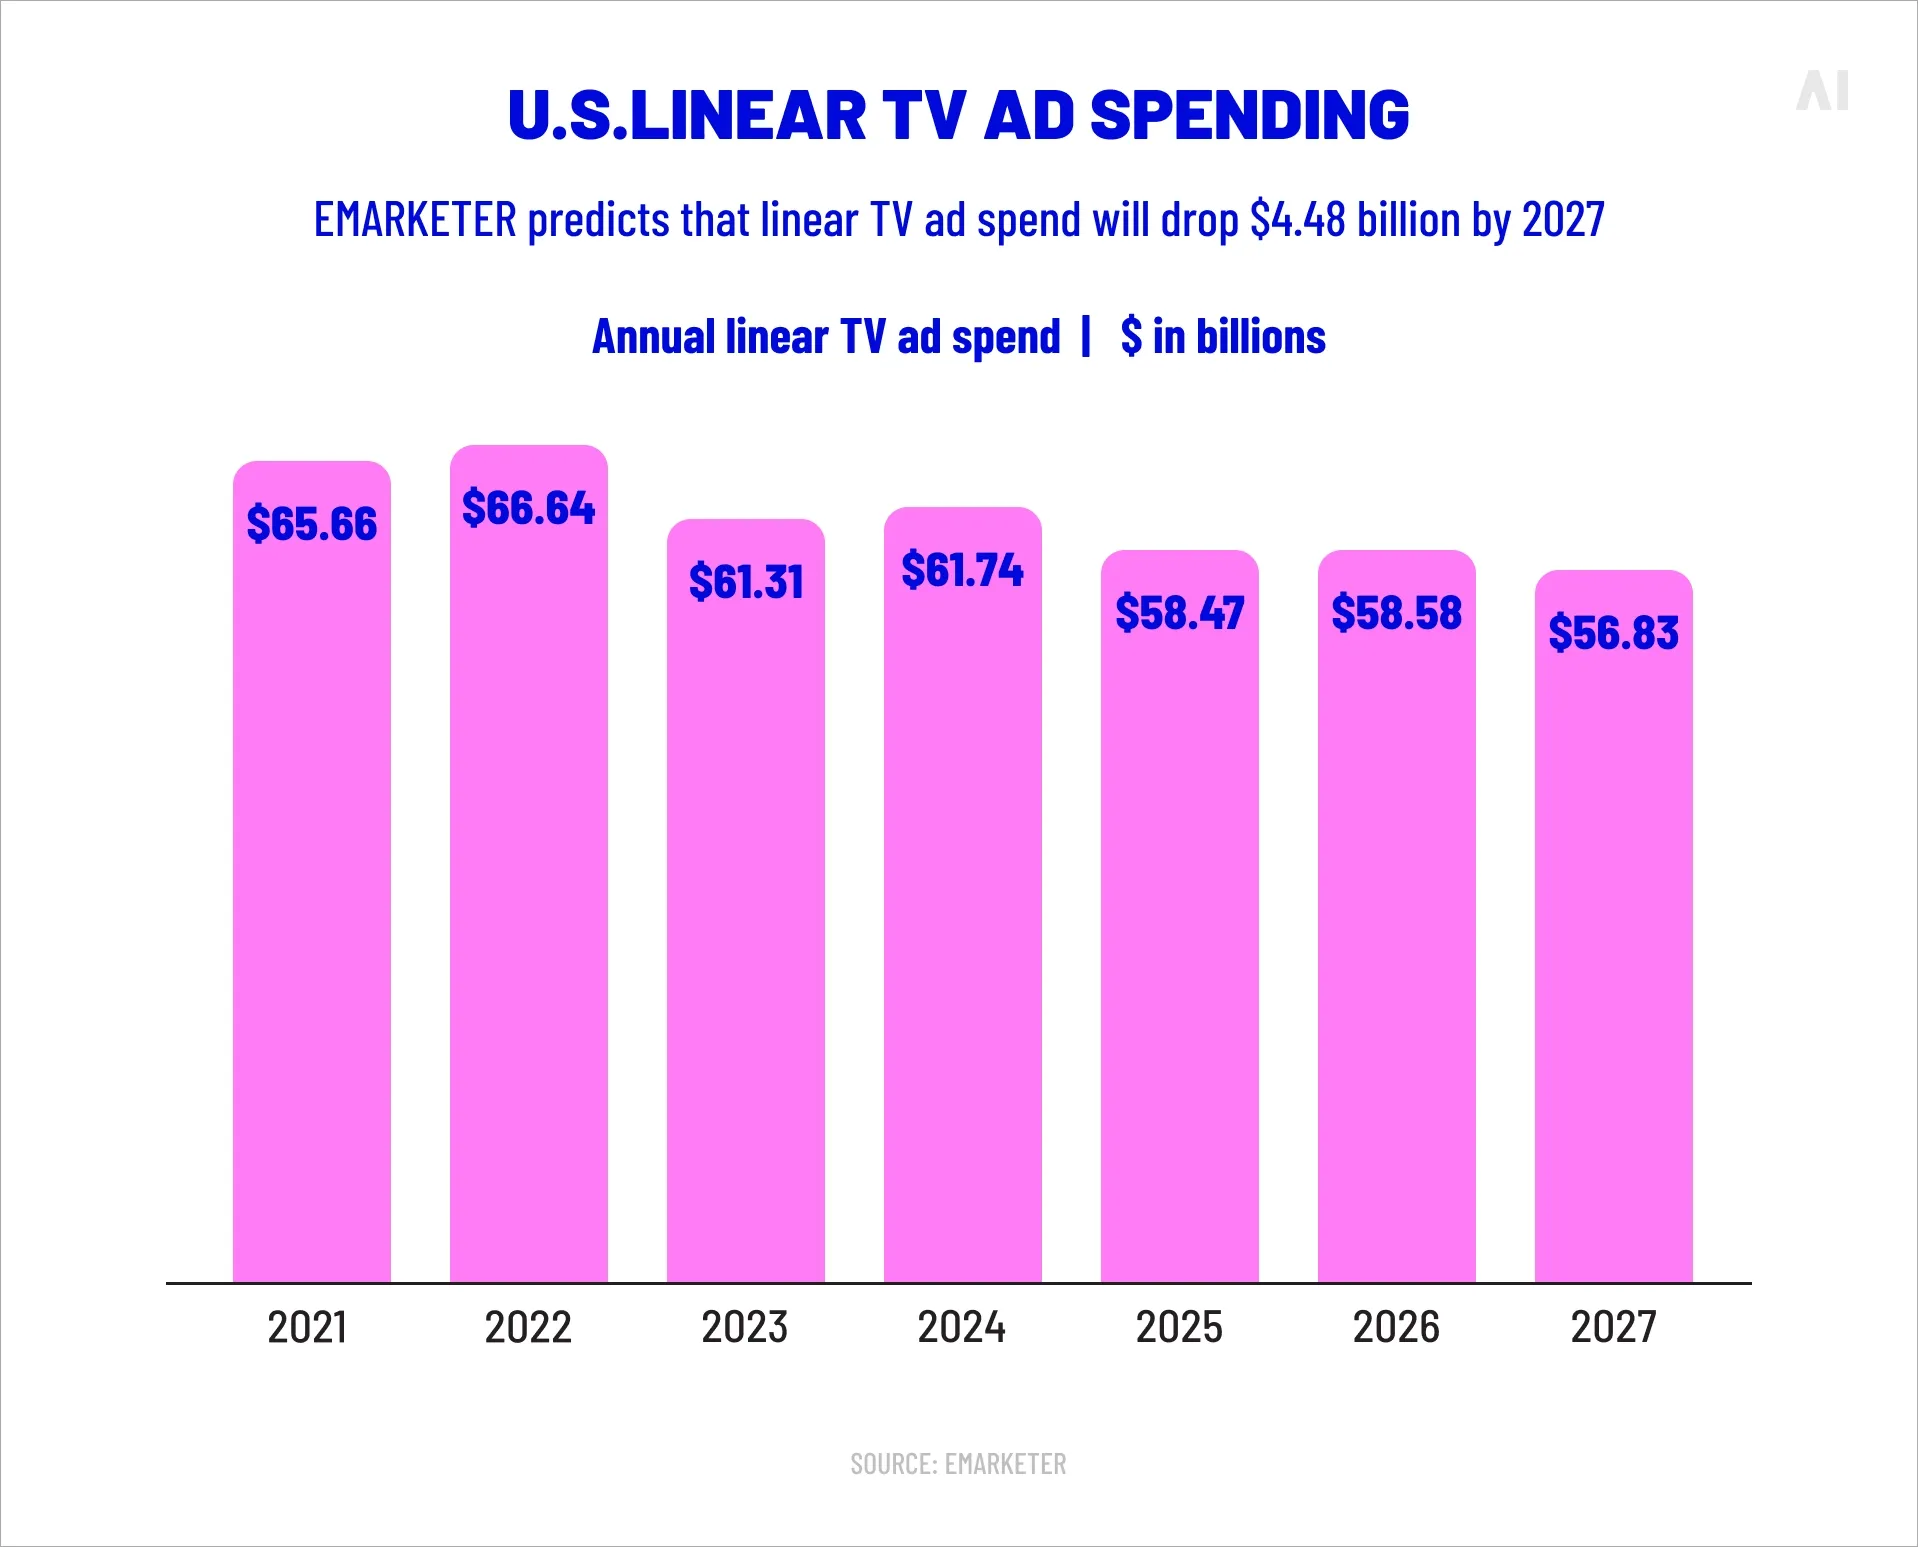
Their value is particularly visible when viewers want immediacy or a shared schedule. Live sports, breaking news, awards programmes, season premieres, and major cultural events can still bring large audiences together at the same time—something that fragmented on-demand libraries do not always reproduce.
July also illustrates why viewing-share statistics require context. Nielsen found that broadcast usage increased 1% from June, even though its share of total TV declined by 0.3 percentage points. Both statements can be true: audiences spent slightly more time with broadcast, but total television usage grew faster. A lower share therefore does not always mean that the underlying amount of viewing fell.
What this means for advertisers: Linear TV should be evaluated according to the audiences and viewing occasions it can deliver, not dismissed because its national share is declining. A campaign seeking broad awareness around a live event may require a different mix from one designed to build efficient reach among streaming-heavy viewers. The decision is not simply streaming versus linear TV, but which combination best supports the campaign’s reach, context, and timing.
Ad-Supported Streaming Is Becoming Mainstream
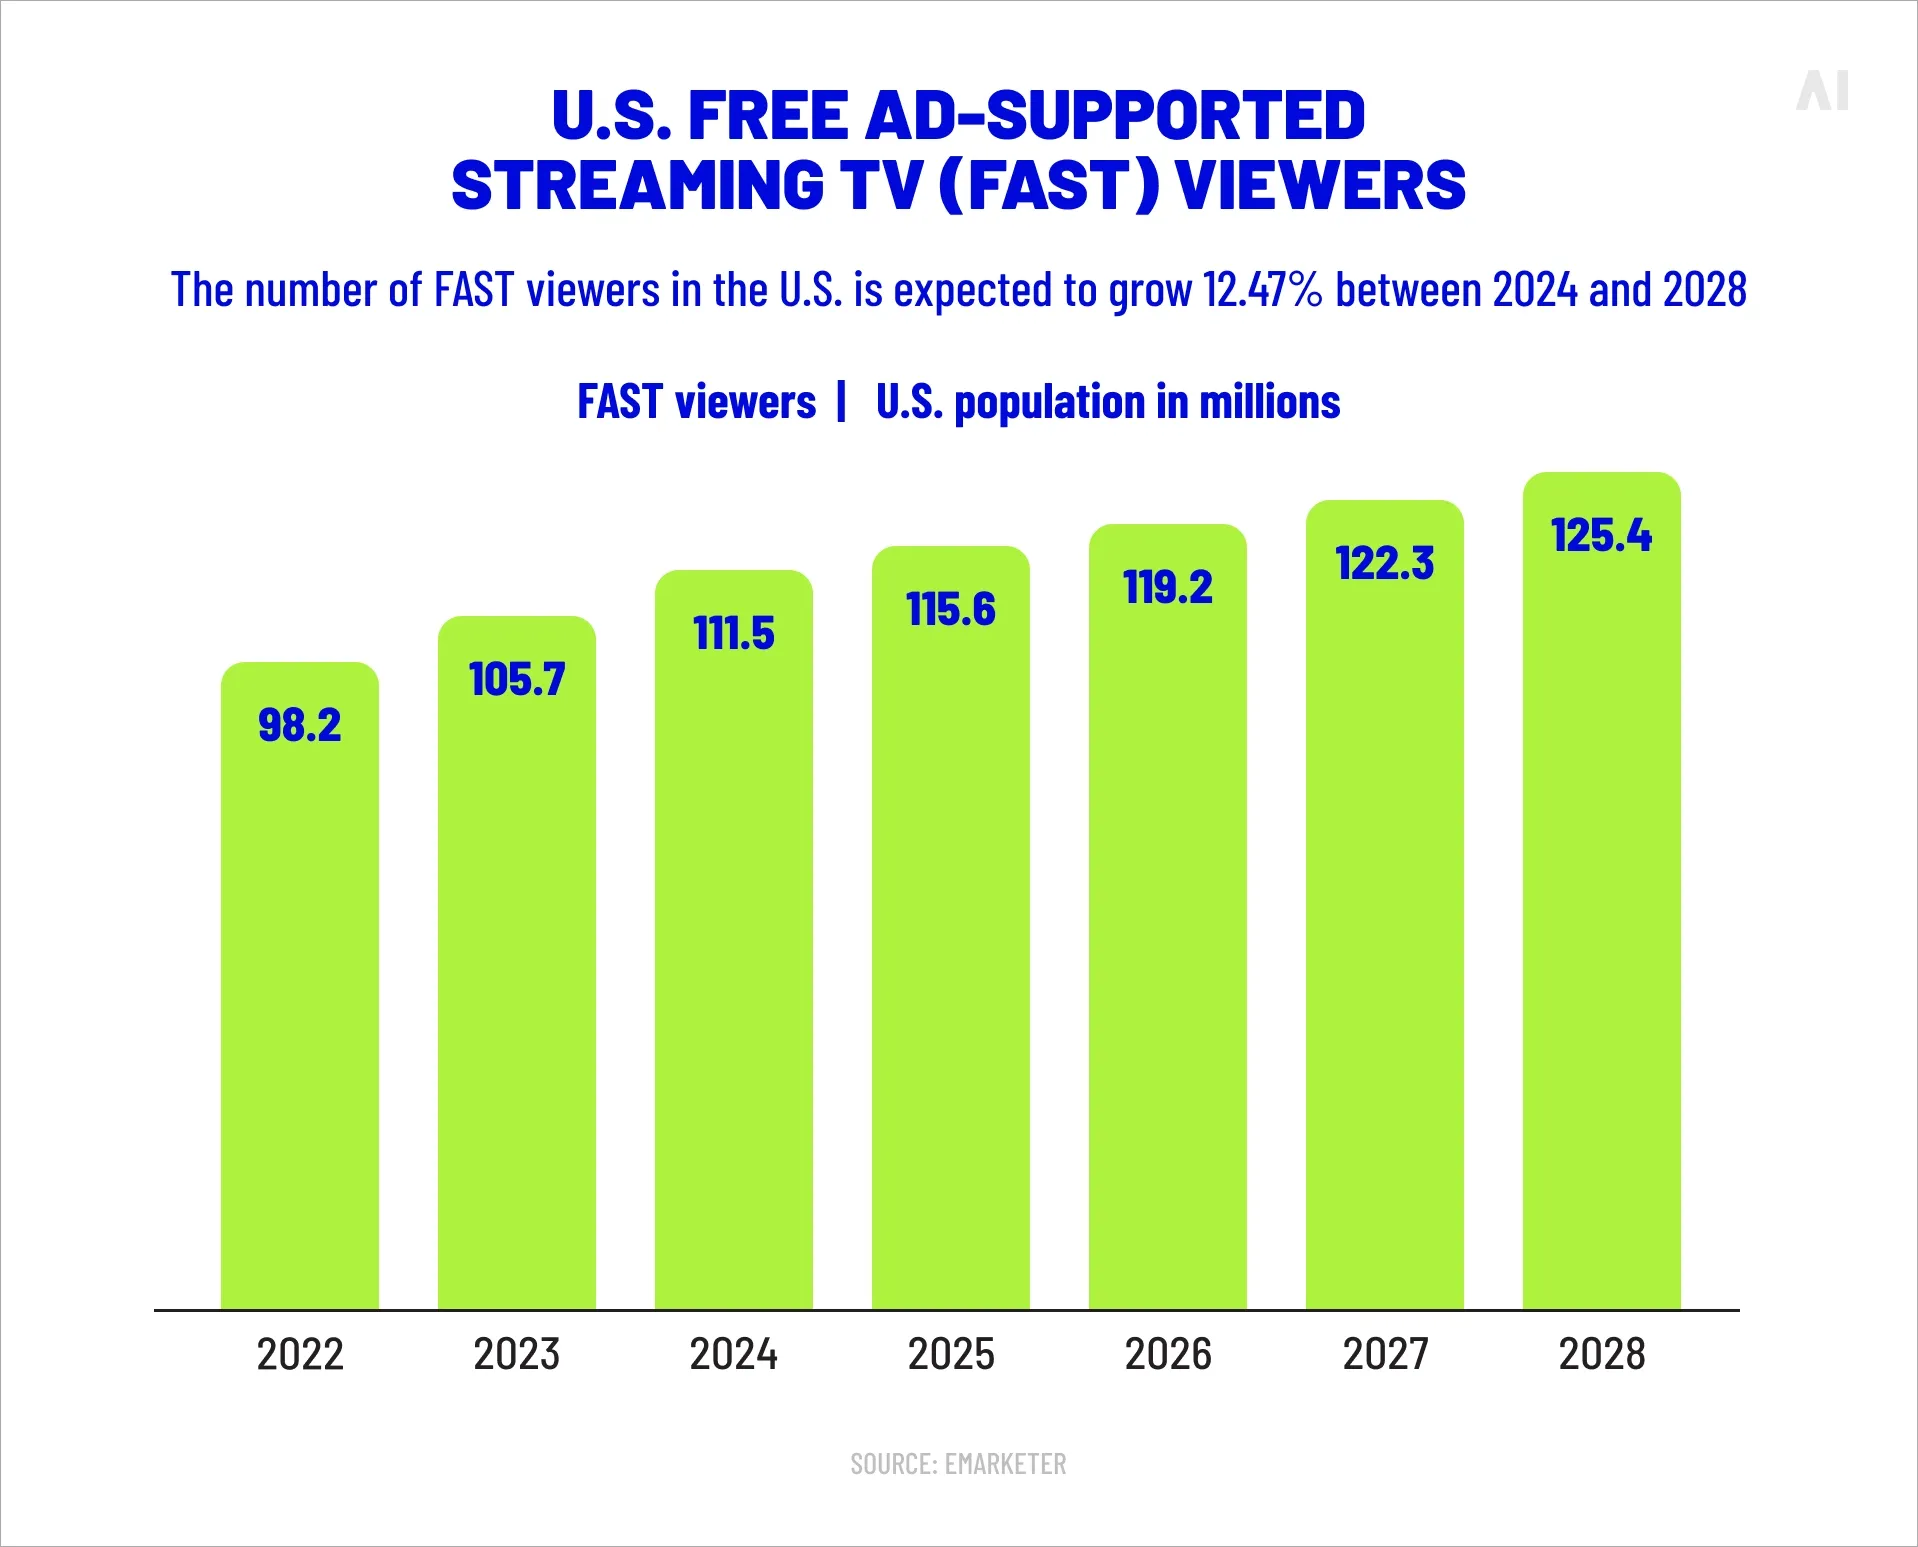
Streaming’s growth initially reduced the amount of television viewing available to advertisers because many subscription services launched without commercials. That relationship is changing as paid ad-supported tiers, advertising-based video on demand, and free ad-supported streaming television become more widely used.
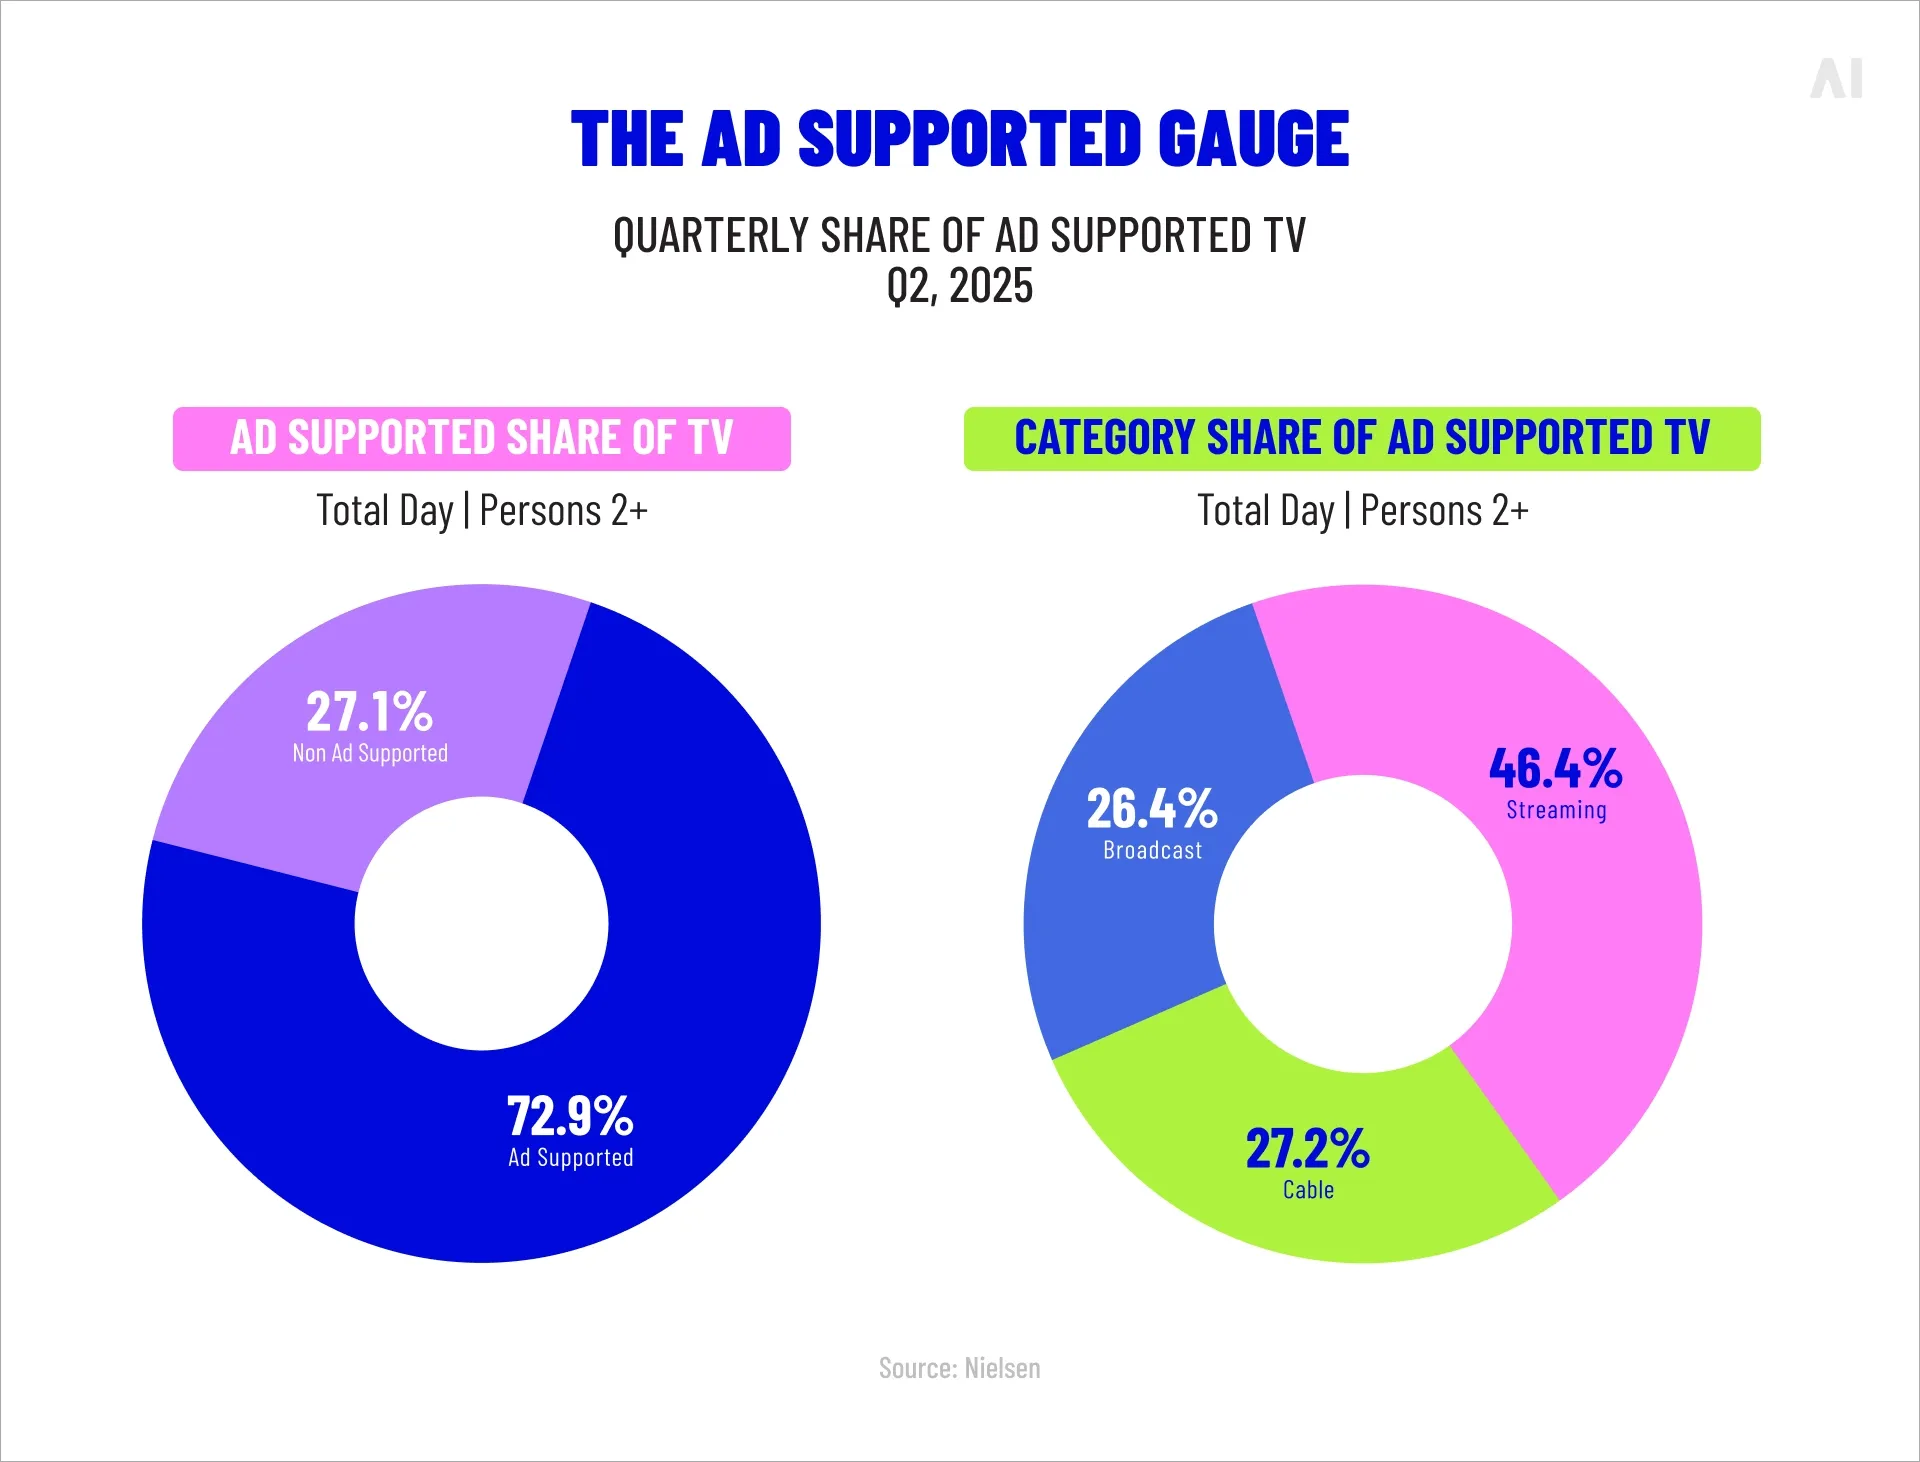
In Q2 2026, ad-supported environments represented 71.5% of total U.S. TV viewing, according to Nielsen’s Ad Supported Gauge. Within that ad-supported viewing universe, streaming captured 48.2%, compared with 26.6% for broadcast and 25.2% for cable. The denominator is important: streaming did not represent 48.2% of all TV viewing in this report—it represented 48.2% of the portion of TV viewing that carried advertising.
Consumer adoption supports the same direction of travel. Deloitte’s March 2026 Digital Media Trends data found that 68% of U.S. households subscribing to paid streaming services had at least one ad-supported VOD service, up from 54% in March 2025. This measures household adoption, not viewing hours or the number of ads actually seen, so it should not be compared directly with Nielsen’s share-of-viewing figures.
The category itself is also varied. An ad-supported subscription tier, a free on-demand service, and a scheduled FAST channel can differ in audience composition, programming, ad load, buying access, reporting, and supply transparency. Growth in ad-supported streaming therefore expands the potential advertising opportunity without making every impression equivalent.
What this means for advertisers: Ad-supported streaming is now large enough to be considered a mainstream component of television planning. However, buyers still need to assess the specific audience, content, inventory path, frequency controls, and measurement available within each service.
Live Sports Are Spreading Across Broadcast and Streaming
Live sports are not moving from linear television to one new destination. Instead, viewing is being distributed across broadcast networks, cable channels, streaming platforms, language-specific services, and digital simulcasts.
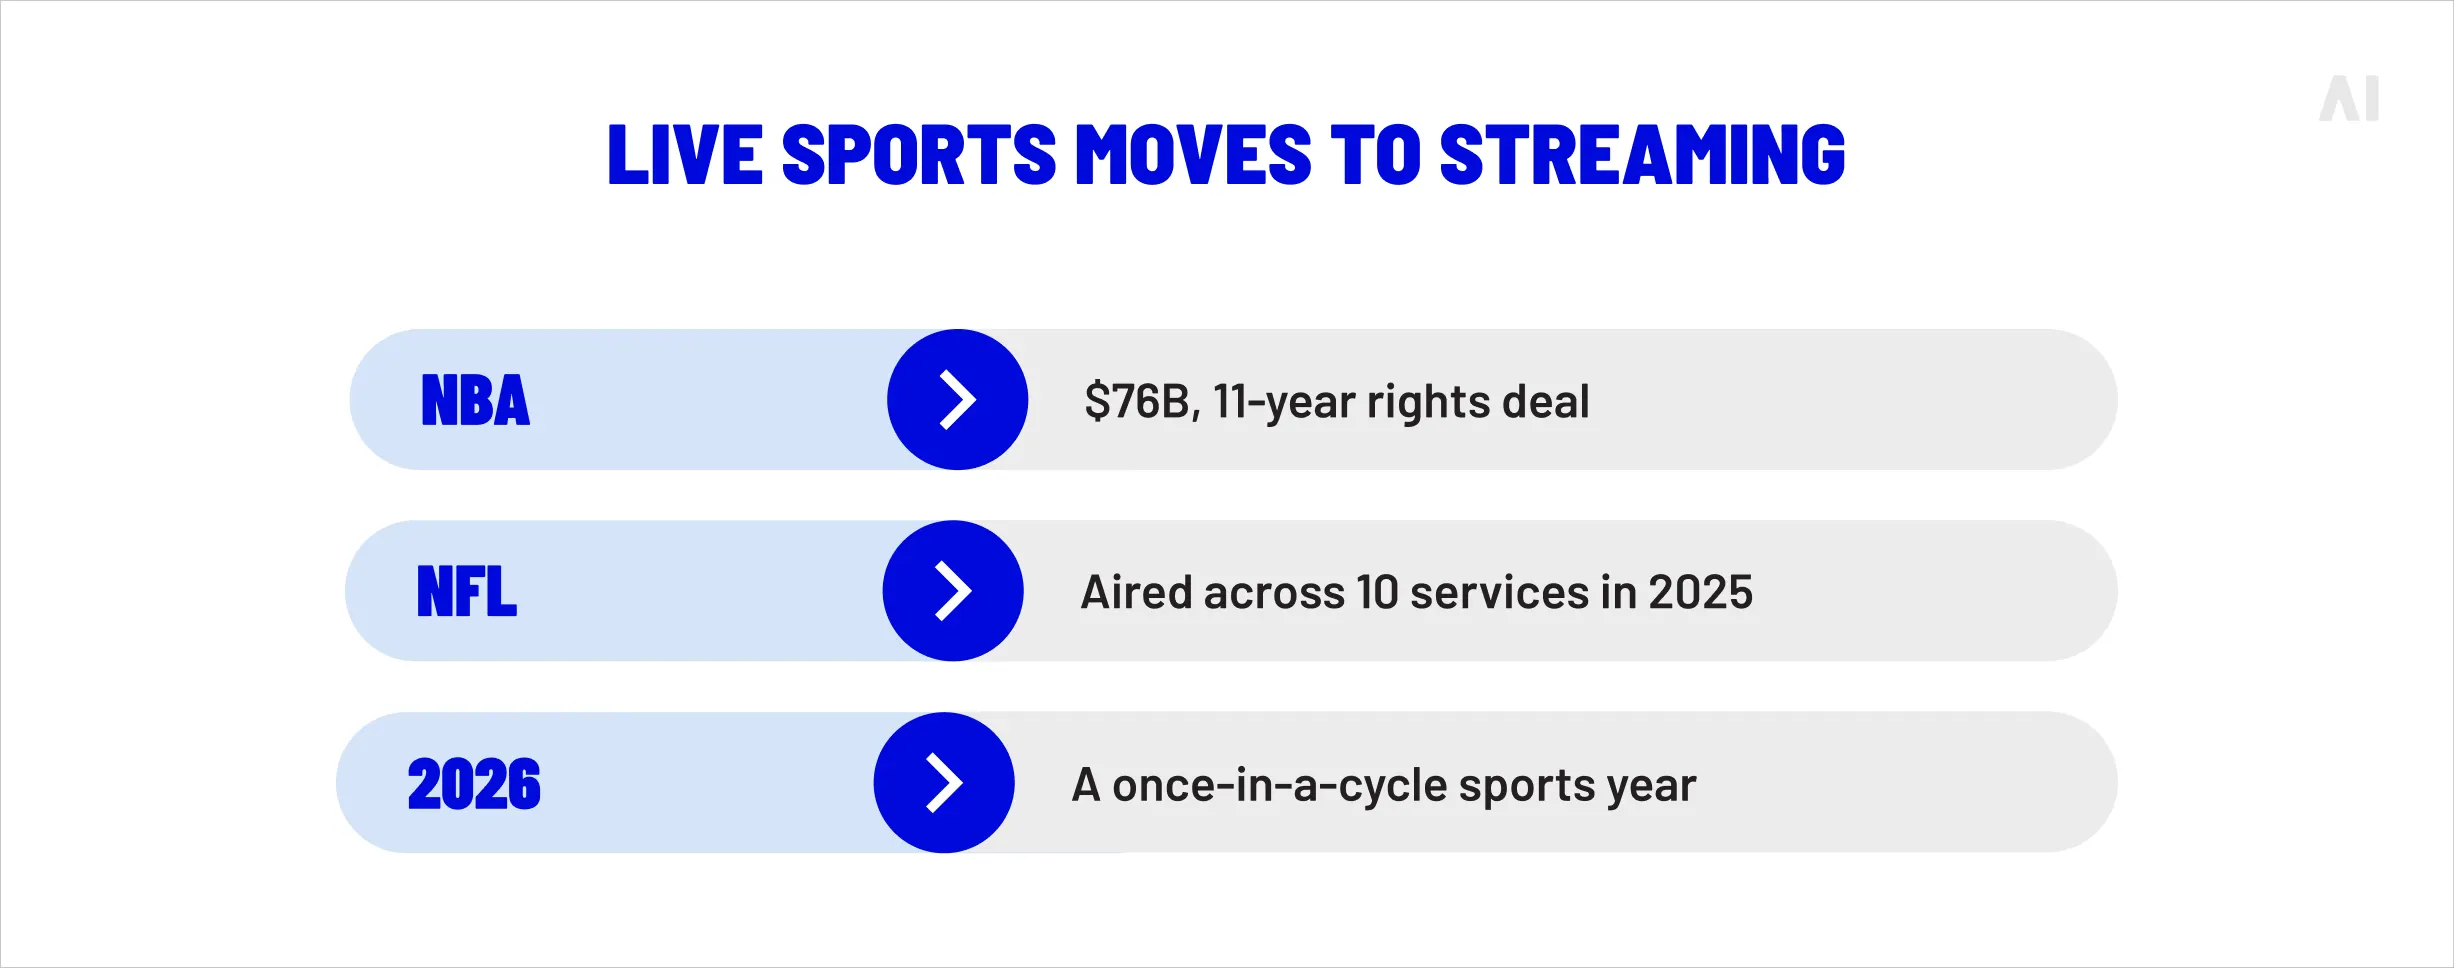
The 2026 FIFA World Cup demonstrated this multi-platform effect. In June, World Cup matches generated more than 84 billion viewing minutes across FOX, Fox Sports 1, and Telemundo. Combined with the NBA Finals, the tournament helped increase broadcast sports viewing by 118% from May and lifted broadcast to 19.8% of total TV viewing.
Streaming platforms are also becoming meaningful sports destinations. In May 2026, Prime Video carried 20 live sporting events, including NBA playoff games, WNBA games, and NASCAR races. Together, those events generated 7.5 billion viewing minutes and helped Prime Video reach a platform high of 4.5% of total TV viewing.
These examples do not prove that one delivery method performs better than another. They show that sports can influence viewing across both environments and cause substantial monthly changes in platform or distributor share. They also demonstrate why one month dominated by a major tournament should not be treated as evidence of a permanent market shift.
What this means for advertisers: Reaching sports audiences increasingly requires following the event and its viewers across platforms. Plans may need to combine linear scale with streaming access, but the mix should reflect the specific sport, distribution arrangement, audience profile, and campaign goal rather than a general assumption that all sports viewing is moving online.
Digital-First Video Is Taking a Larger Share of TV-Screen Viewing
The television screen is no longer reserved for programmes produced and distributed by traditional TV companies. Digital-first platforms—particularly YouTube—now occupy a significant share of living-room viewing alongside broadcast networks, cable channels, and premium streaming services.
In July 2026, YouTube accounted for a record 14.2% of total U.S. TV viewing time, making it the largest individual media distributor in Nielsen’s Media Distributor Gauge that month. Its TV viewing rose 6% from June, extending its lead over the next-largest distributor to five percentage points.
This figure refers to YouTube Main viewed through television screens, not YouTube TV’s live channel bundle. Under Nielsen’s methodology, linear programming watched through YouTube TV is attributed to the relevant broadcast or cable category rather than YouTube’s streaming total.
That distinction reveals how much the meaning of television has changed. A long-form creator video, a music stream, a children’s programme, and a professionally produced series can all appear on the same physical screen. However, they do not necessarily offer the same viewing context, audience attention, advertising formats, content controls, or inventory access.
TV-screen watch time should not be treated as automatically equivalent to available CTV advertising inventory.
What this means for advertisers: The television set should increasingly be treated as a viewing environment rather than one traditional channel. Media plans need to account for digital-first video alongside broadcast, cable, and premium streaming while still evaluating the specific content, ad experience, and measurement framework available in each environment.
TV Viewership Is Not Changing the Same Way for Every Audience
National averages show the direction of the TV market, but they do not describe every audience equally. Age can change the balance between streaming, broadcast, and cable, while content preferences and viewing occasions create further differences within the same age group.
Nielsen’s Q2 2026 Ad Supported Gauge illustrates the effect. Among viewers aged two and older, streaming represented 48.2% of ad-supported TV viewing, compared with 26.6% for broadcast and 25.2% for cable. When Nielsen limited the audience to adults aged 18 and older, streaming declined to 44.4%, while broadcast increased to 28.6% and cable to 27%. The comparison does not isolate every age band, but it shows why an aggregate viewing share should be treated as a market benchmark—not an allocation formula.
Age and Generation Shape the Viewing Mix
Younger audiences generally give streaming and digital-first video a larger role in their viewing. Nielsen’s 2026 Upfront Planning Guide identifies non-FAST ad-supported services, including YouTube and ad-supported subscription platforms, as particularly effective at attracting viewers aged 2–17 and 18–34.
Across the broader 18–49 audience, 63.8% of total TV time is spent with ad-supported content. Within that ad-supported viewing, streaming accounts for 66.7%, while linear TV retains 33.4%. This distinction is important: the 66.7% figure refers specifically to ad-supported viewing, not all television time.
Middle-aged audiences often have a more blended viewing mix. FAST platforms such as Tubi, Pluto TV, and The Roku Channel attract growing attention among viewers aged 35–64. These viewers may use paid streaming services and FAST while continuing to watch broadcast or cable for live sports, news, and familiar entertainment.
Older viewers maintain a stronger relationship with linear TV, but they should not be treated as a linear-only audience. Streaming use extends across age groups, just as younger viewers still watch linear programming around major events. Age therefore indicates where reach may be concentrated; it does not determine every individual’s behavior.
For advertisers, the goal is to use age-specific viewing data to identify incremental reach. Streaming may deserve more weight for younger audiences, FAST can extend reach across middle-aged groups, and linear TV can remain valuable for older viewers and appointment programming. Broad-reach campaigns will often need all three.
Streaming Mix Varies Across Audience Groups
Streaming is not one uniform viewing environment. Audiences move among paid ad-free subscriptions, ad-supported subscription tiers, FAST services, and digital-first video platforms, sometimes within the same household and on the same TV screen.
Nielsen’s 2026 research shows that these options attract different audience profiles. Among adults aged 18–49, 81.1% of ad-supported streaming viewing occurs on non-FAST services and ad-supported subscription tiers, while FAST accounts for approximately 19%. FAST attracts comparatively more attention among viewers aged 35–64, whereas non-FAST ad-supported streaming is particularly strong among younger viewers.
Household adoption adds another layer of fragmentation. Deloitte’s March 2026 research found that 90% of U.S. households had a paid streaming subscription, with subscribing households holding an average of four services. Among households with paid SVOD, 68% also had at least one ad-supported streaming service, up from 54% in March 2025.
However, access does not equal attention. Subscription ownership does not show which service a household actively watches, which person uses it, how long they watch, or whether an advertising impression is available. Sign-up growth therefore should not be presented as evidence of equivalent growth in viewing time or ad exposure.
Advertisers should evaluate paid ad-supported streaming, FAST, and digital-first video separately before combining them into a wider plan. Audience-level viewing, unique reach, frequency, platform overlap, and device data provide a stronger basis for allocation than subscriber totals alone. The objective is not to appear on the largest possible number of services, but to build complementary reach across streaming environments without paying repeatedly to reach the same viewers.
How to Read TV Viewership Data Without Drawing the Wrong Conclusion
Before using a TV statistic to justify a channel or budget decision, marketers should identify the metric, audience universe, geography, device coverage, reporting period, and denominator. They should also confirm whether it measures content viewing, advertising exposure, or service access.
Viewing Share Is Not the Same as Audience Reach
Viewing share divides total watch-time among categories; reach counts unique people or households exposed. Nielsen’s finding that streaming represented 49% of U.S. TV use in July 2026 means streaming generated 49% of TV-screen watch-time among people aged two and older. It does not mean that streaming reached 49% of Americans or TV households.
A platform can accumulate substantial watch-time through heavy users without reaching as many unique people as a channel watched briefly by a broader audience. The Media Rating Council defines reach as unique, deduplicated users, homes, or audiences exposed at least once during a defined period. Additional exposures from the same person increase frequency, not reach.
Marketers should therefore avoid interchanging minutes viewed, share of TV time, unique viewers, households, impressions, and reach percentage. Viewing share shows where time is accumulating; it does not independently establish audience scale.
Monthly Viewing Can Move With Sports, Seasonality, and Major Events
Monthly shares reflect the content and circumstances of a specific period. Sports schedules, holidays, school breaks, major releases, news events, and seasonal routines can temporarily change viewing across platforms.
In June 2026, FIFA World Cup matches generated more than 84 billion viewing minutes across FOX, FS1, and Telemundo. Together with the NBA Finals, the tournament helped drive a 118% monthly increase in broadcast sports viewing, lifting broadcast to 19.8% of total TV time. In July, the final World Cup rounds and streaming’s usual summer lift helped total TV use increase 2.2%, instead of following its typical flat-to-declining seasonal pattern.
A category’s share can even fall while its usage grows if total TV viewing rises faster. Broadcast usage increased 1% in July, yet its share declined by 0.3 percentage points to 19.5%. Direction should therefore be assessed across consecutive months, comparable year-over-year periods, and the relevant event calendar—not inferred from one record month.
Total TV and Ad-Supported TV Answer Different Questions
Total TV includes both ad-supported and ad-free viewing. Nielsen notes that The Gauge and Media Distributor Gauge measure total TV use and are not the currency ratings used for advertising transactions. A platform’s total viewing share is therefore not its share of available advertising inventory.
The Ad Supported Gauge uses a narrower denominator. In Q2 2026, ad-supported content represented 71.5% of total U.S. TV viewing. Within that ad-supported viewing, streaming accounted for 48.2%, broadcast for 26.6%, and cable for 25.2%. Streaming’s 48.2% share of ad-supported TV cannot be compared directly with its 49% share of total TV in July because the periods and denominators differ.
Important percentages should name their period, population, geography, screen coverage, and denominator. These distinctions help explain why TV audience measurement has become more complex.
What 2026 TV Viewership Trends Mean for Advertisers
Viewing trends reveal where audience opportunities may be developing, but they do not determine the right allocation for every advertiser. The media mix should reflect audience composition, geography, campaign scale, content context, objective, and available measurement.
Build Incremental Reach Across Linear and Streaming
Linear and streaming audiences overlap, but differences in age, content, and viewing occasion can allow one environment to reach people missed by the other. Linear TV can still concentrate attention around live programming and major events, while streaming can extend access to audiences spread across on-demand and digital-first services.
However, rising streaming share does not show how many new people a particular streaming buy will add to a linear campaign. Incremental reach requires deduplicated campaign- or audience-level data, using a consistent target definition and reporting period. MRC standards similarly require measurement providers to identify and deduplicate unique devices or, preferably, unique users.
National trends can indicate where additional reach may exist, but measuring incremental reach across channels requires evidence that the added impressions reached new members of the target audience. The appropriate balance will differ by market, audience, scale, content, and campaign objective.
Manage Frequency Across a Fragmented Viewing Environment
A viewer may encounter the same campaign across broadcast television, several streaming services, and multiple connected devices. This can produce duplicated reach and excessive repetition, even when delivery appears controlled within each platform.
Platform-level controls generally cover only the inventory a platform can observe. They do not automatically include exposure on other services or linear TV. Effective frequency capping therefore requires the broadest deduplicated view available, with clear disclosure where cross-platform identity or exposure data is incomplete.
Advertisers should monitor total reach, average frequency, and frequency distribution where measurement permits. An acceptable average can still conceal many underexposed viewers and a smaller group receiving the ad too often.
Adapt Creative and Measurement to the Viewing Environment
A consistent campaign idea may require different executions. Traditional TV and premium streaming often support lean-back, full-screen viewing with sound, while digital-first video competes in faster and more variable contexts. Interactive CTV may support remote actions, overlays, or QR codes, but viewers need clear instructions and a call to action suited to the viewing distance.
Creative should account for screen size, sound state, duration, content context, interactivity, and expected viewer behavior. IAB’s 2026 video-classification framework similarly distinguishes sound, full-screen presentation, device, ad format, and measurability rather than treating every digital video impression as equivalent.
Measurement must also match the environment. A completed view, TV impression, platform reach estimate, and interactive response may use different qualification rules and attribution windows. Comparisons are meaningful only when definitions, audience units, periods, and data coverage align. A unified strategy needs a common campaign objective—not an assumption that every platform-reported metric is interchangeable.
How AI Digital Helps Advertisers Navigate Changing TV Viewership
Fragmented viewing creates two connected challenges: understanding where audiences spend time and accessing suitable inventory efficiently. AI Digital supports both through cross-channel marketing intelligence and programmatic supply solutions. These capabilities inform media decisions, but they do not replace independent audience measurement, syndicated ratings, or advertising currency.
Connect Planning and Performance Data With Elevate
Research, planning, activation, and reporting often rely on information held in separate platforms, making consistent cross-channel analysis difficult.
The Elevate marketing intelligence platform connects fragmented marketing signals within one workflow. Its capabilities support competitive and audience research, cross-channel media planning, optimization, and reporting. Teams can define budgets, channels, timelines, audience segments, and campaign goals while centralizing core metrics across integrated DSPs, search, and social platforms.
For campaigns spanning streaming, digital video, and other media, Elevate can help advertisers evaluate planning scenarios, monitor results, and connect platform information with business KPIs. It is not a television ratings provider: Elevate does not independently measure total U.S. TV audiences or replace the currencies used to transact TV advertising. Its role is to organize and interpret marketing information for more informed allocation and performance decisions.
Improve Programmatic Supply Access With Smart Supply
After identifying where programmatic media can contribute, advertisers still need efficient access to quality supply. Opaque supply paths can add intermediaries and make it harder to understand where impressions are delivered.
Smart Supply gives brands and agencies access to curated programmatic inventory through direct partnerships with premium SSPs. AI Digital builds deal IDs around campaign KPIs, filters fraud, invalid traffic, low-quality placements, and non-brand-safe inventory, and applies real-time performance adjustments. Visibility into placements, traffic sources, and pricing helps buyers evaluate media quality and efficiency.
Smart Supply is a programmatic supply and deal-optimization solution, not a viewership measurement product. Inventory availability depends on current partnerships, markets, campaign requirements, and deal construction; it should not be described as providing universal access to every CTV, OTT, FAST, or live-sports environment.
Plan for Where TV Audiences Are Going, Not Where They Used to Be
Television remains a major viewing environment, but its audience is increasingly distributed across linear channels, streaming services, ad-supported tiers, live programming, FAST, and digital-first video. No single viewing-share headline can determine the right strategy for every advertiser.
AI Digital’s key actions for navigating this shift are:
- Start with current evidence. Confirm the source, period, audience universe, device coverage, and denominator behind every statistic.
- Plan for complementary reach. Use linear, streaming, and digital video according to the audience, geography, content context, and campaign objective.
- Prioritize supply quality. Evaluate inventory access, supply paths, traffic quality, transparency, and suitability alongside audience availability.
- Connect delivery with outcomes. Monitor deduplicated reach and frequency where possible, then interpret platform performance within a shared measurement framework.
The goal is not to move budgets toward whichever channel generated the latest record. It is to combine reliable audience evidence, quality media access, and campaign-level measurement to determine where each investment can add value. Advertisers ready to apply that approach can discuss their cross-channel strategy with AI Digital.