Digital Experience Analytics: How to Turn User Behavior into Revenue
Sarah Moss
May 14, 2026
11
minutes read
Traffic is up, conversions are flat, and nobody in the room can quite say why. Digital customer experience analytics exists to answer that question — and this article is a practical guide to using behavioral data to find the revenue your dashboards are quietly hiding.
The modern customer journey is not so much a funnel as a web. A single buyer may hop between search, social, email, connected TV, a mobile app, a review site and three browser tabs before completing a purchase—and that is on a quiet week. Salesforce's 2026 marketing research puts the average number of customer engagement channels at ten, which is an impressive figure until you consider how few teams can see all ten at once.
Against that backdrop, digital experience analytics has quietly become one of the most consequential disciplines in marketing and product. It is no longer a dashboard exercise or a UX side-project. Powered by AI, cross-channel measurement and real-time data capture, digital customer experience analytics now sits alongside forecasting and financial planning as a senior leadership concern. Done well, it turns observed behavior—every click, hesitation and abandoned basket—into concrete decisions about revenue, retention and growth.
Digital experience analytics is the discipline of capturing and interpreting how users actually behave across a brand's digital footprint and using that understanding to improve the outcomes the business cares about. It is, put plainly, the difference between knowing what happened and knowing why.
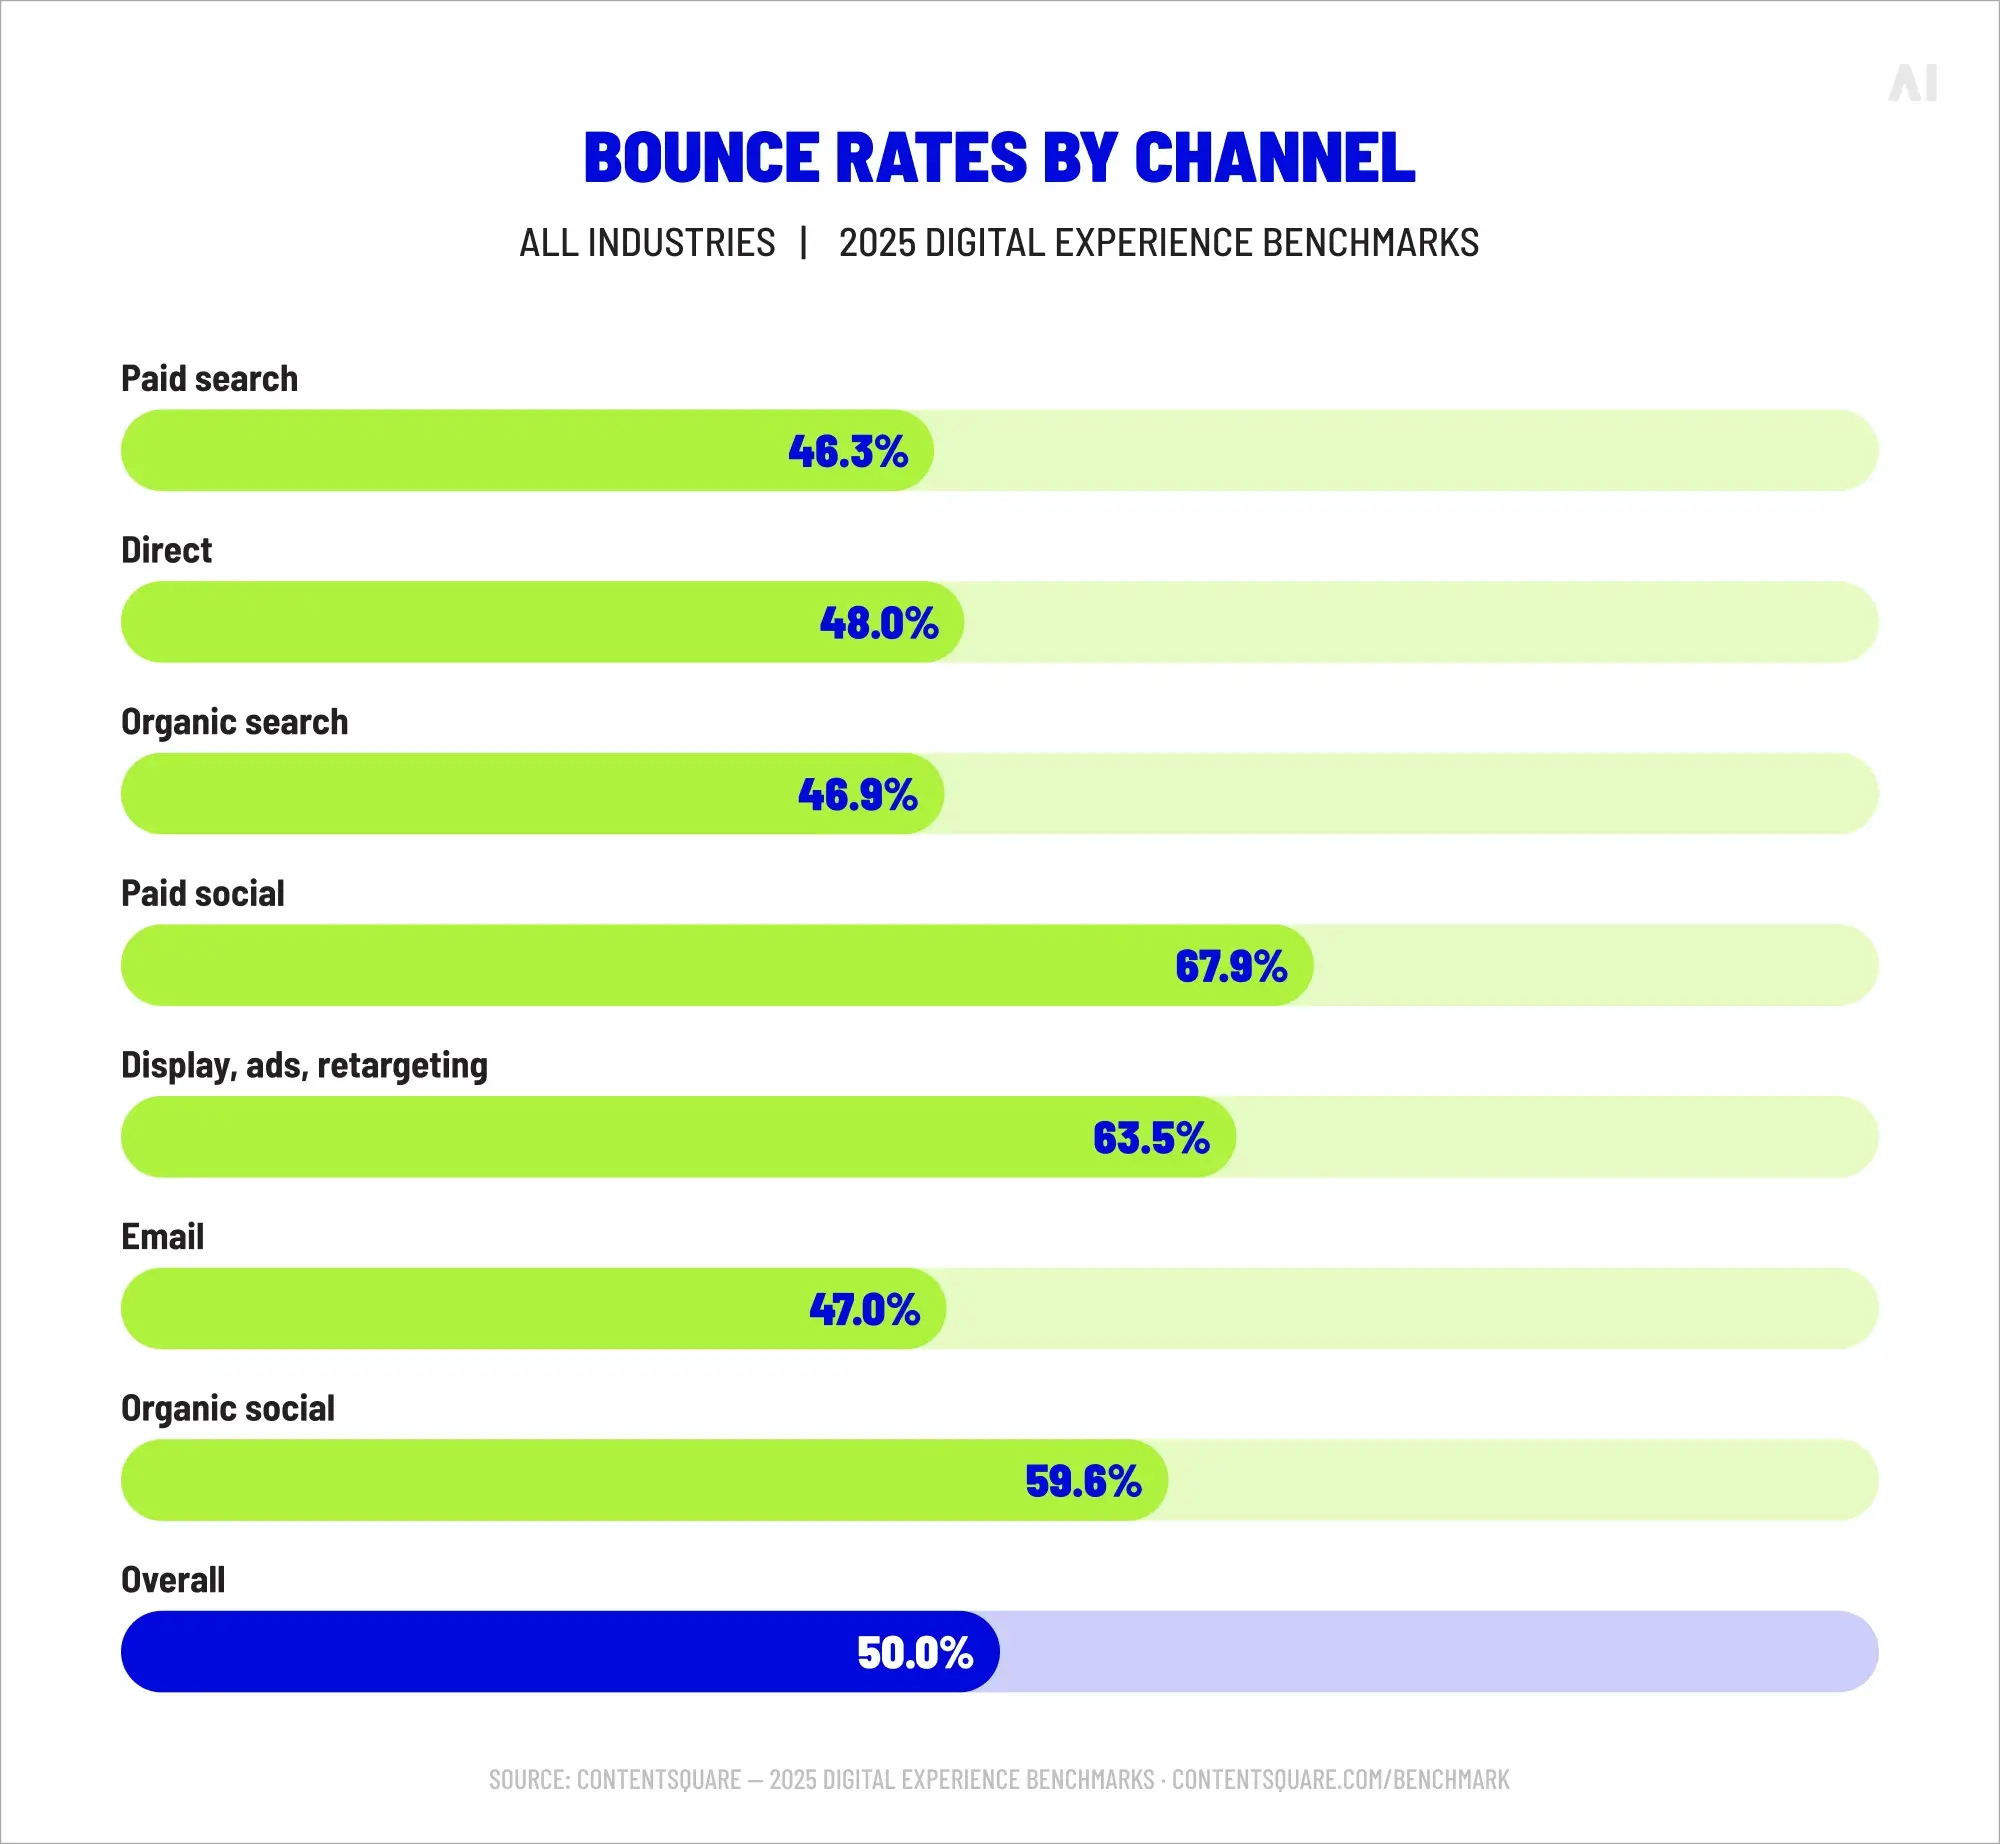
Traditional web analytics tends to report. It tells you that 42,000 people visited the pricing page, that bounce sat at 38%, and that the mobile conversion rate dipped three points quarter on quarter. These are useful facts, but they explain nothing.
Experience analytics supplies the missing layer: where in the page someone hesitated, which field in the sign-up form caused them to leave, which paths the highest-value customers take before they convert. It treats the user journey as evidence rather than as a spreadsheet.
The commercial stakes are considerable. Forrester's 2025 Customer Experience Index found that 25% of US brands saw their CX rankings decline, against only 7% that improved — the second consecutive year of widespread regression. The same research body's work on customer obsession makes the commercial case plain: customer-obsessed organizations report41% faster revenue growth, 49% faster profit growth, and 51% better customer retention than their non-customer-obsessed peers. The gap between leaders and everyone else is not narrowing.
⚡ The advantage, increasingly, does not belong to the companies with the most data. It belongs to the ones asking the most useful questions of data they have had all along.
How digital experience analytics works and reveals insights
Experience analytics operates in three movements: it captures behavioral signals across touchpoints, combines them with quantitative performance data, and applies pattern recognition to turn the resulting picture into decisions. None of the three is especially glamorous on its own. Together, they produce the journey-level intelligence senior teams now depend on.
The simplest way to separate the two is by what each can answer:
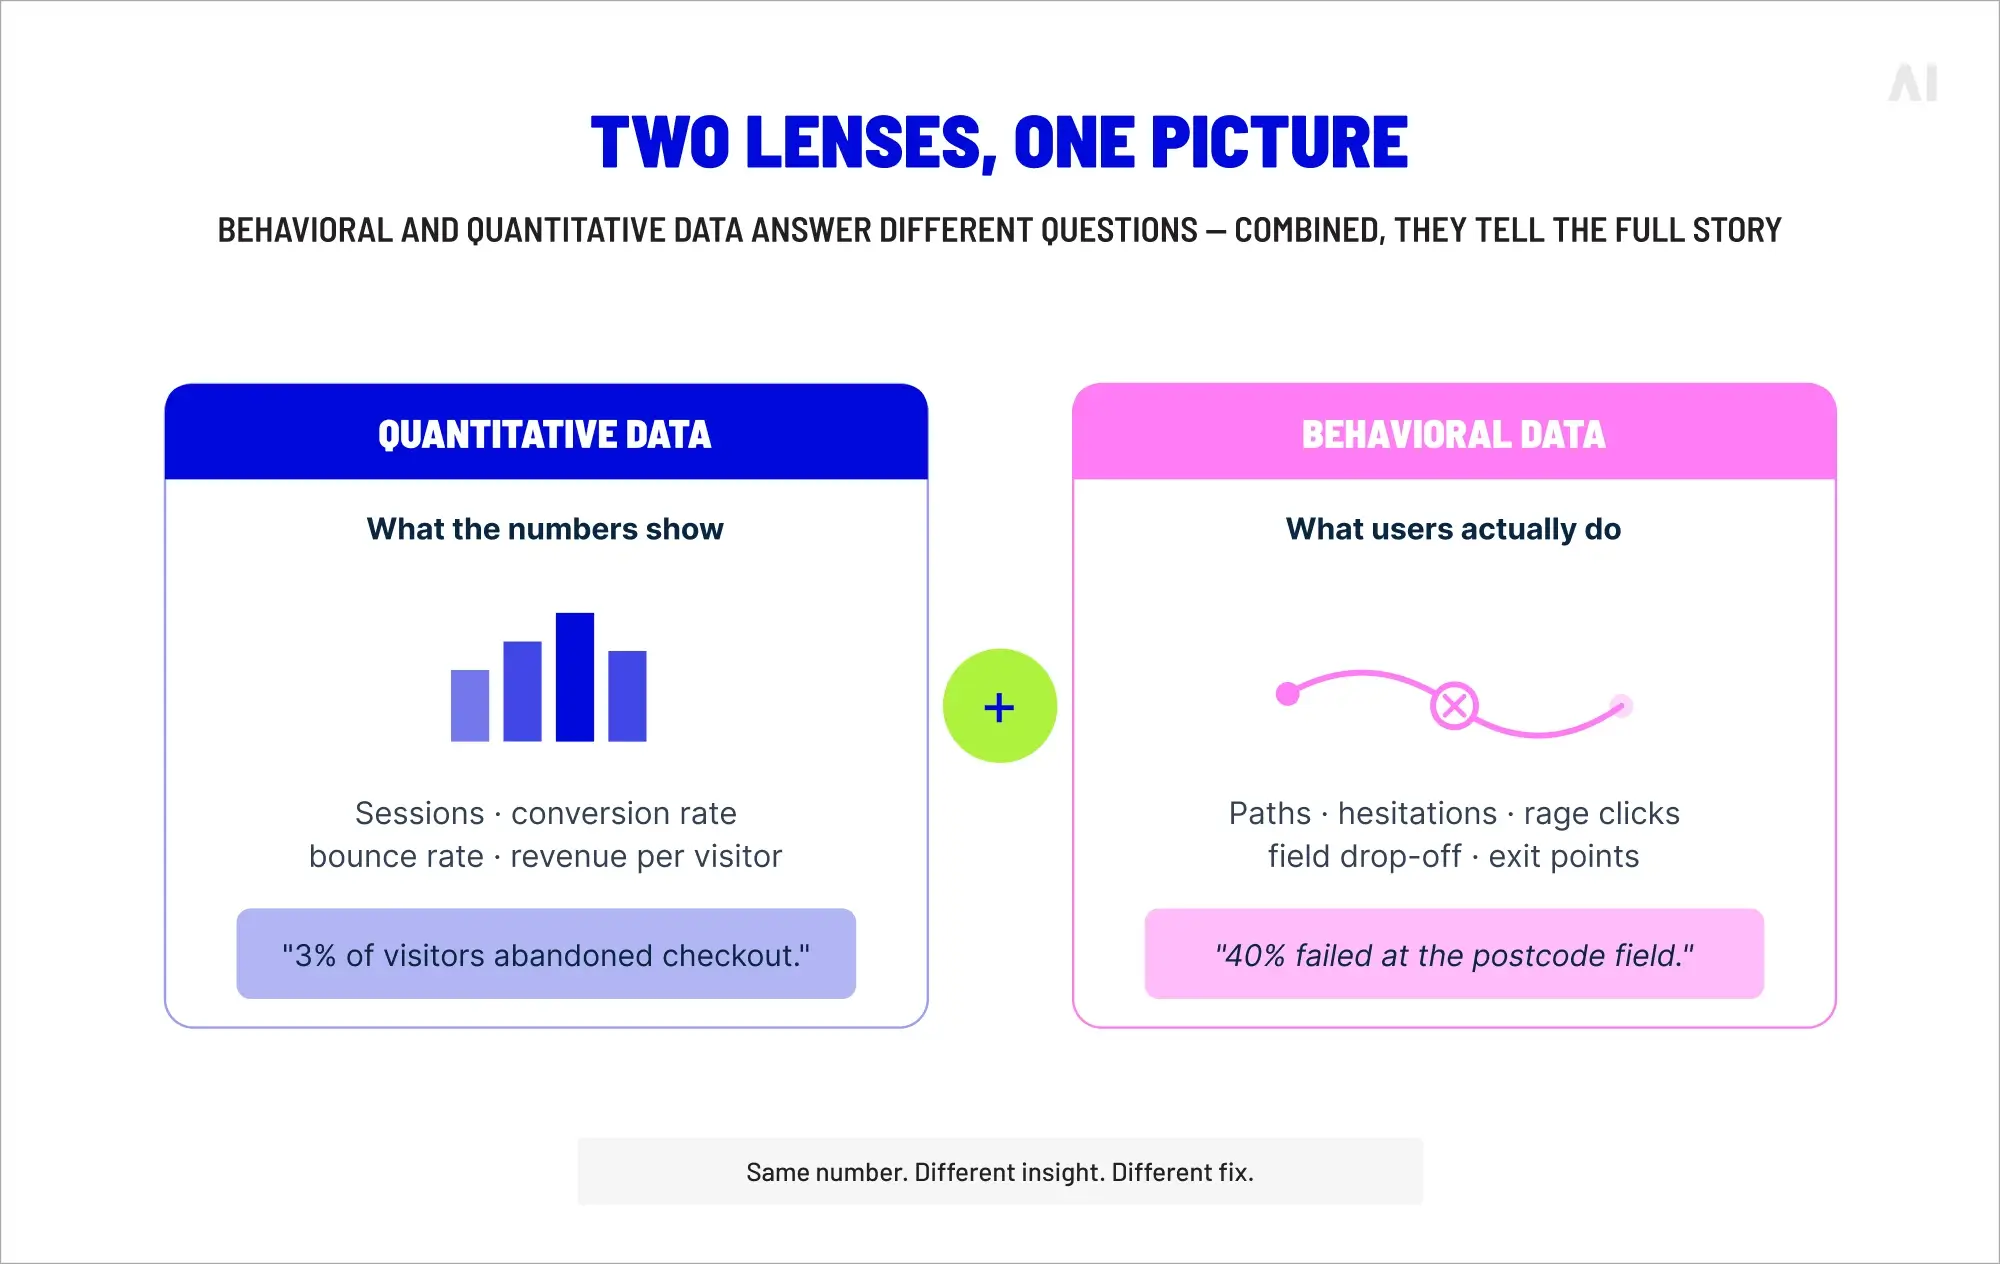
Quantitative data aggregates — sessions, conversion rates, bounce rates, revenue per visitor — and is excellent at showing directional trends.
Behavioral data is granular and contextual: the specific path a user took, the point at which they hesitated, the element they rage-clicked, the form field they abandoned.
Each on its own yields a partial picture:
Quantitative reporting might tell you that 3% of visitors abandoned the checkout, which looks tolerable on a dashboard.
Behavioral data might reveal that 40% of those abandoners did so at the same payment field because the postcode validator was rejecting a common input format.
The number is the same. The insight — and the fix — is entirely different.
A mature experience analytics setup captures signals across several families. Grouped by what they tell you, the most valuable are:
Interaction signals—clicks, scrolls, hovers, rage clicks and dead clicks, which reveal engagement and frustration at the element level
Session signals—visit duration, depth, paths, repeat patterns and exit points, which trace the shape of the journey
Conversion signals—funnel progression, cart behavior, form completion and drop-off at each step
Contextual signals—device, referrer, campaign source, geography and time of day, which explain the conditions around the behavior
The point is not to collect all of them for their own sake. The point is to connect them. A rage click on a landing page is interesting; a rage click on a landing page that correlates with a specific paid campaign source is actionable.
Turning data into actionable insights
The analytical bottleneck today is no longer data scarcity but data overload. Salesforce's 2026 research found that 98% of marketing teams using AI reported at least one data-related barrier to personalization—data silos, sheer volume, and poor quality being the three most common complaints. Even teams with well-instrumented stacks struggle to separate signal from noise.
AI-led analytics systems address this by doing the triage manual analysis cannot scale to: clustering behavioral patterns, detecting anomalies, flagging friction hotspots, and—crucially—ranking what matters. The value is not that the system finds every issue. It is that it tells you which issue, fixed this quarter, is worth the most.
Digital experience analytics platform and how to use it
A digital experience analytics platform is the unified system that captures, processes and surfaces user behavior across a brand's digital estate—web, mobile, app, connected channels—and makes that information usable for decision-making.
Under the hood, such a platform performs four jobs:
Data capture through tags, SDKs and event streams
Processing and stitching, connecting anonymous and known identities across devices and sessions
Visualization and alerting, exposing behavior through dashboards, replay tools and anomaly flags
Experimentation and activation, enabling the testing of hypotheses and the deployment of fixes
In practice, different teams use the same platform differently:
Product teams use it diagnostically: why did this feature's activation rate fall?
Marketing teams use it to optimize: which landing page variant is converting which audience segment?
CX and operations teams use it for reporting: what changed, why, and what do we do next?
The platform's value is less in its technical capabilities than in its ability to give several teams a shared, trustworthy view of what customers are actually doing.
Core digital experience analytics metrics
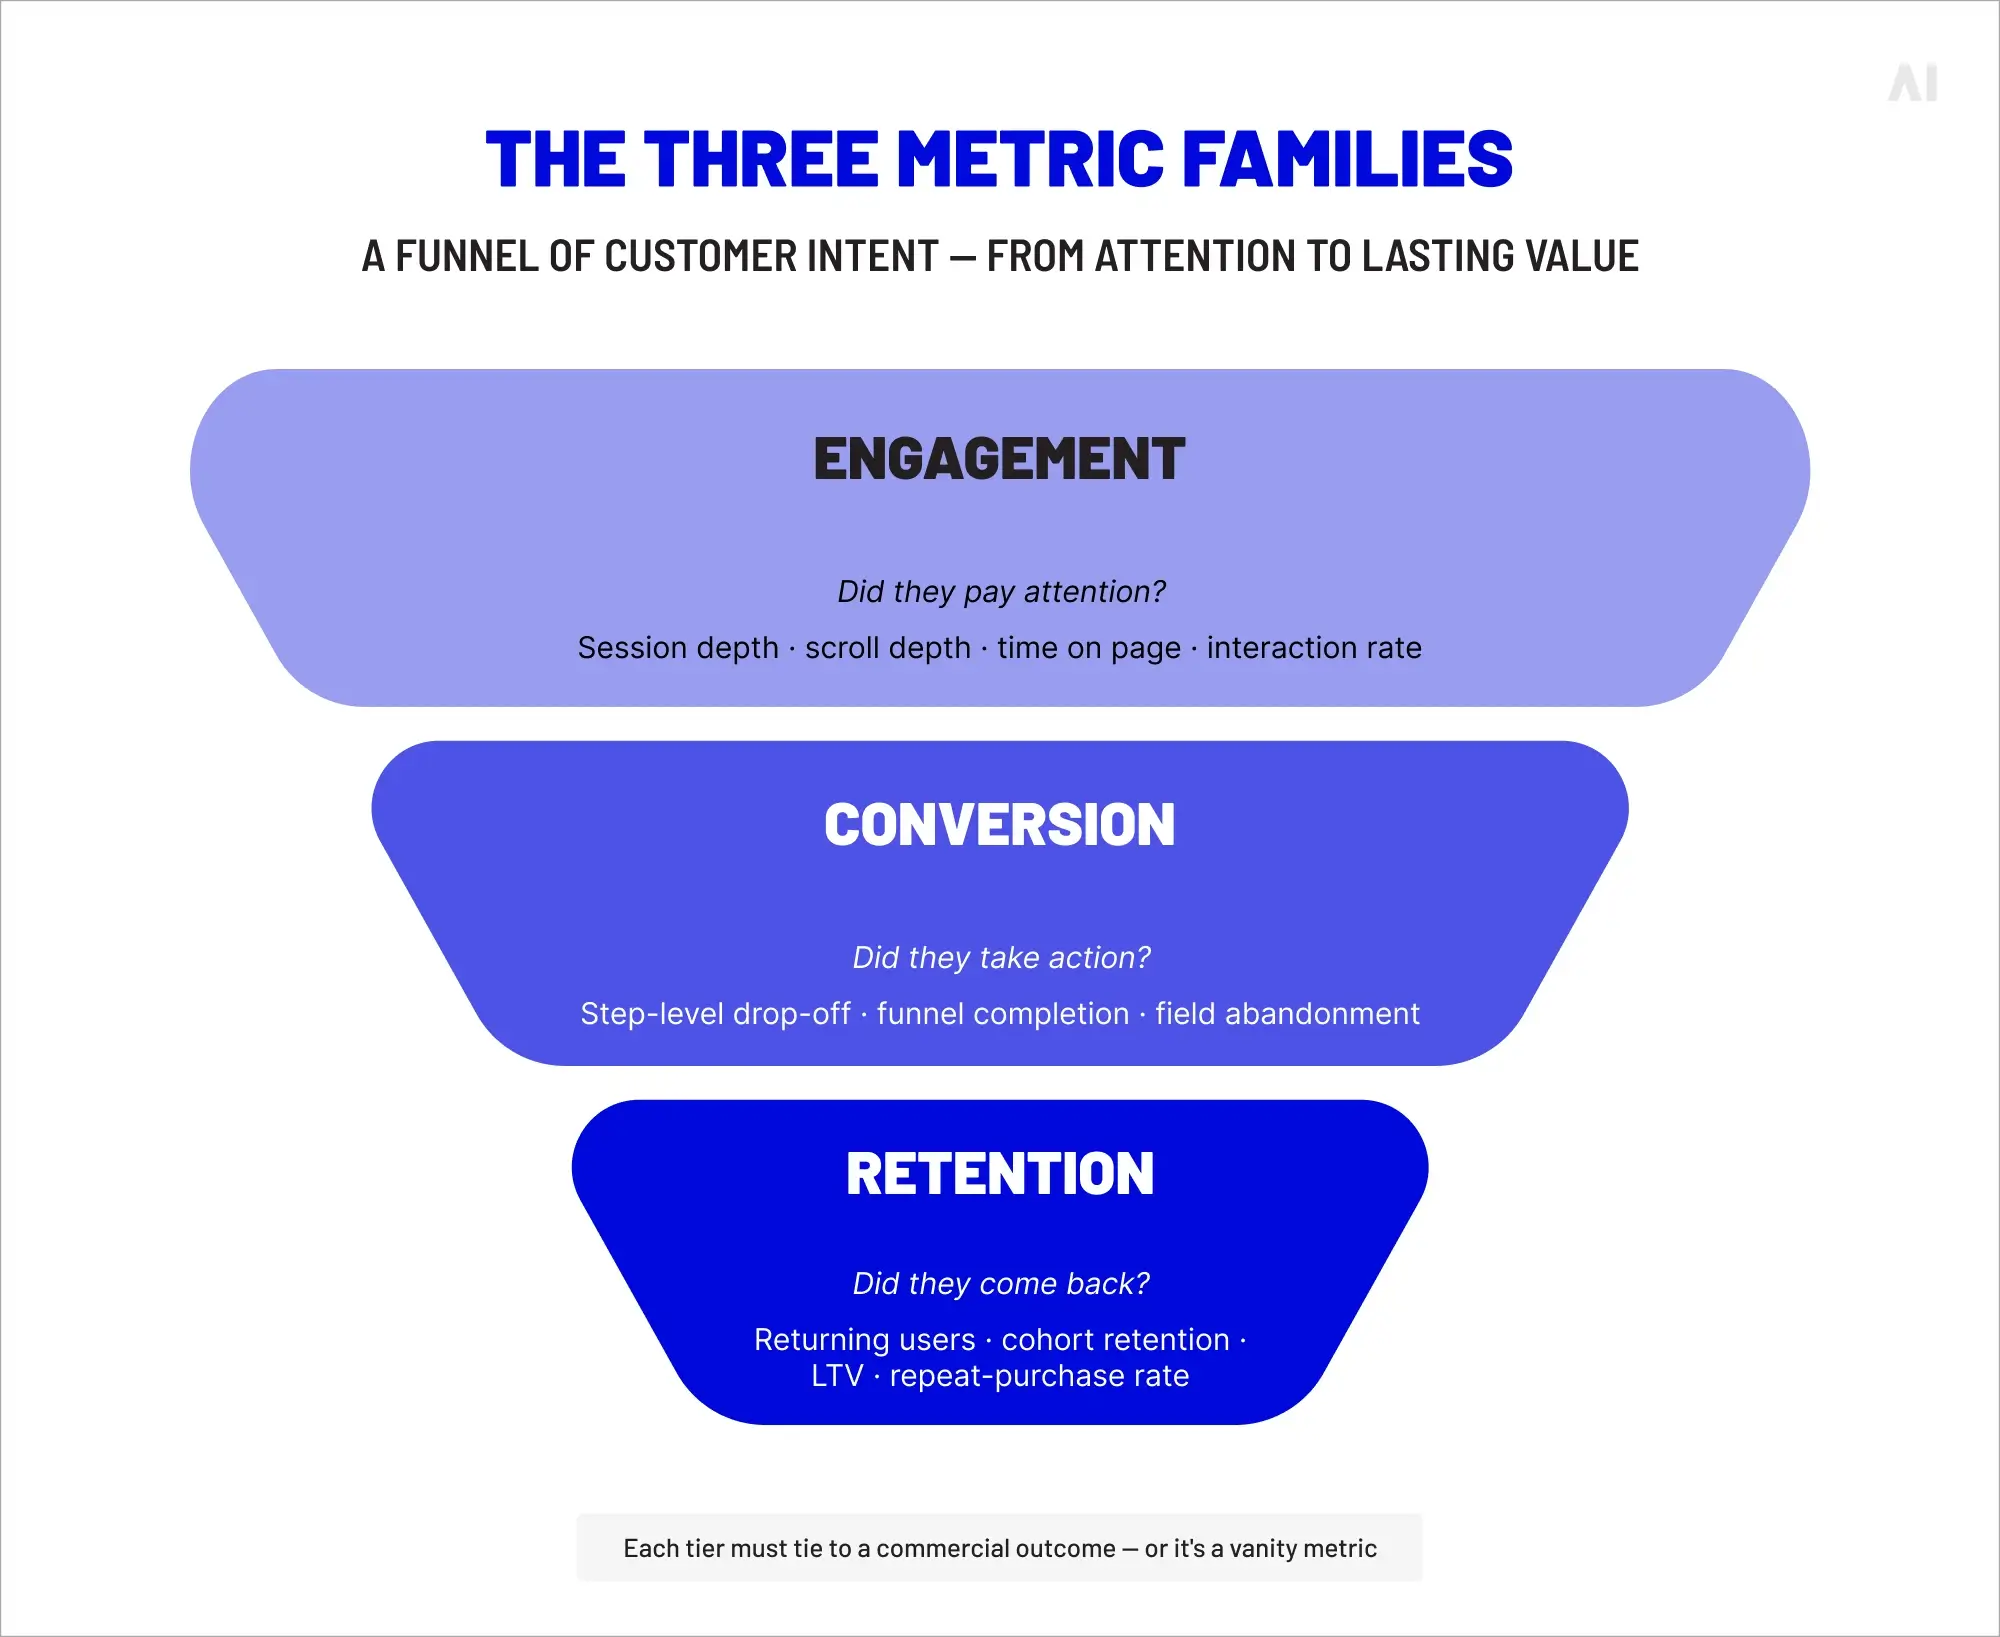
Metrics are not in short supply. The ones worth paying attention to tend to cluster into three families — engagement, conversion, and retention — each corresponding to a different stage of intent. Choosing between them is not really the point. The point is whether any of them, in practice, is tied to an outcome that matters.
The three metric families
Engagement metrics
Engagement metrics describe the quality of a user's attention. The most useful are session depth, scroll depth, time on page, interaction rate and return-session rate. The least useful, if taken in isolation, is time on page—which can mean a user is deeply absorbed or hopelessly confused. All engagement metrics benefit from being read in context: alongside the journey, the segment and the intent.
Conversion and drop-off metrics
Conversion rate is the number most often reported. It is also the number most often misread. A single funnel rate obscures the reality that different user segments, devices and traffic sources convert at wildly different rates—and that the drop-off between specific steps is where actionable insight lives.
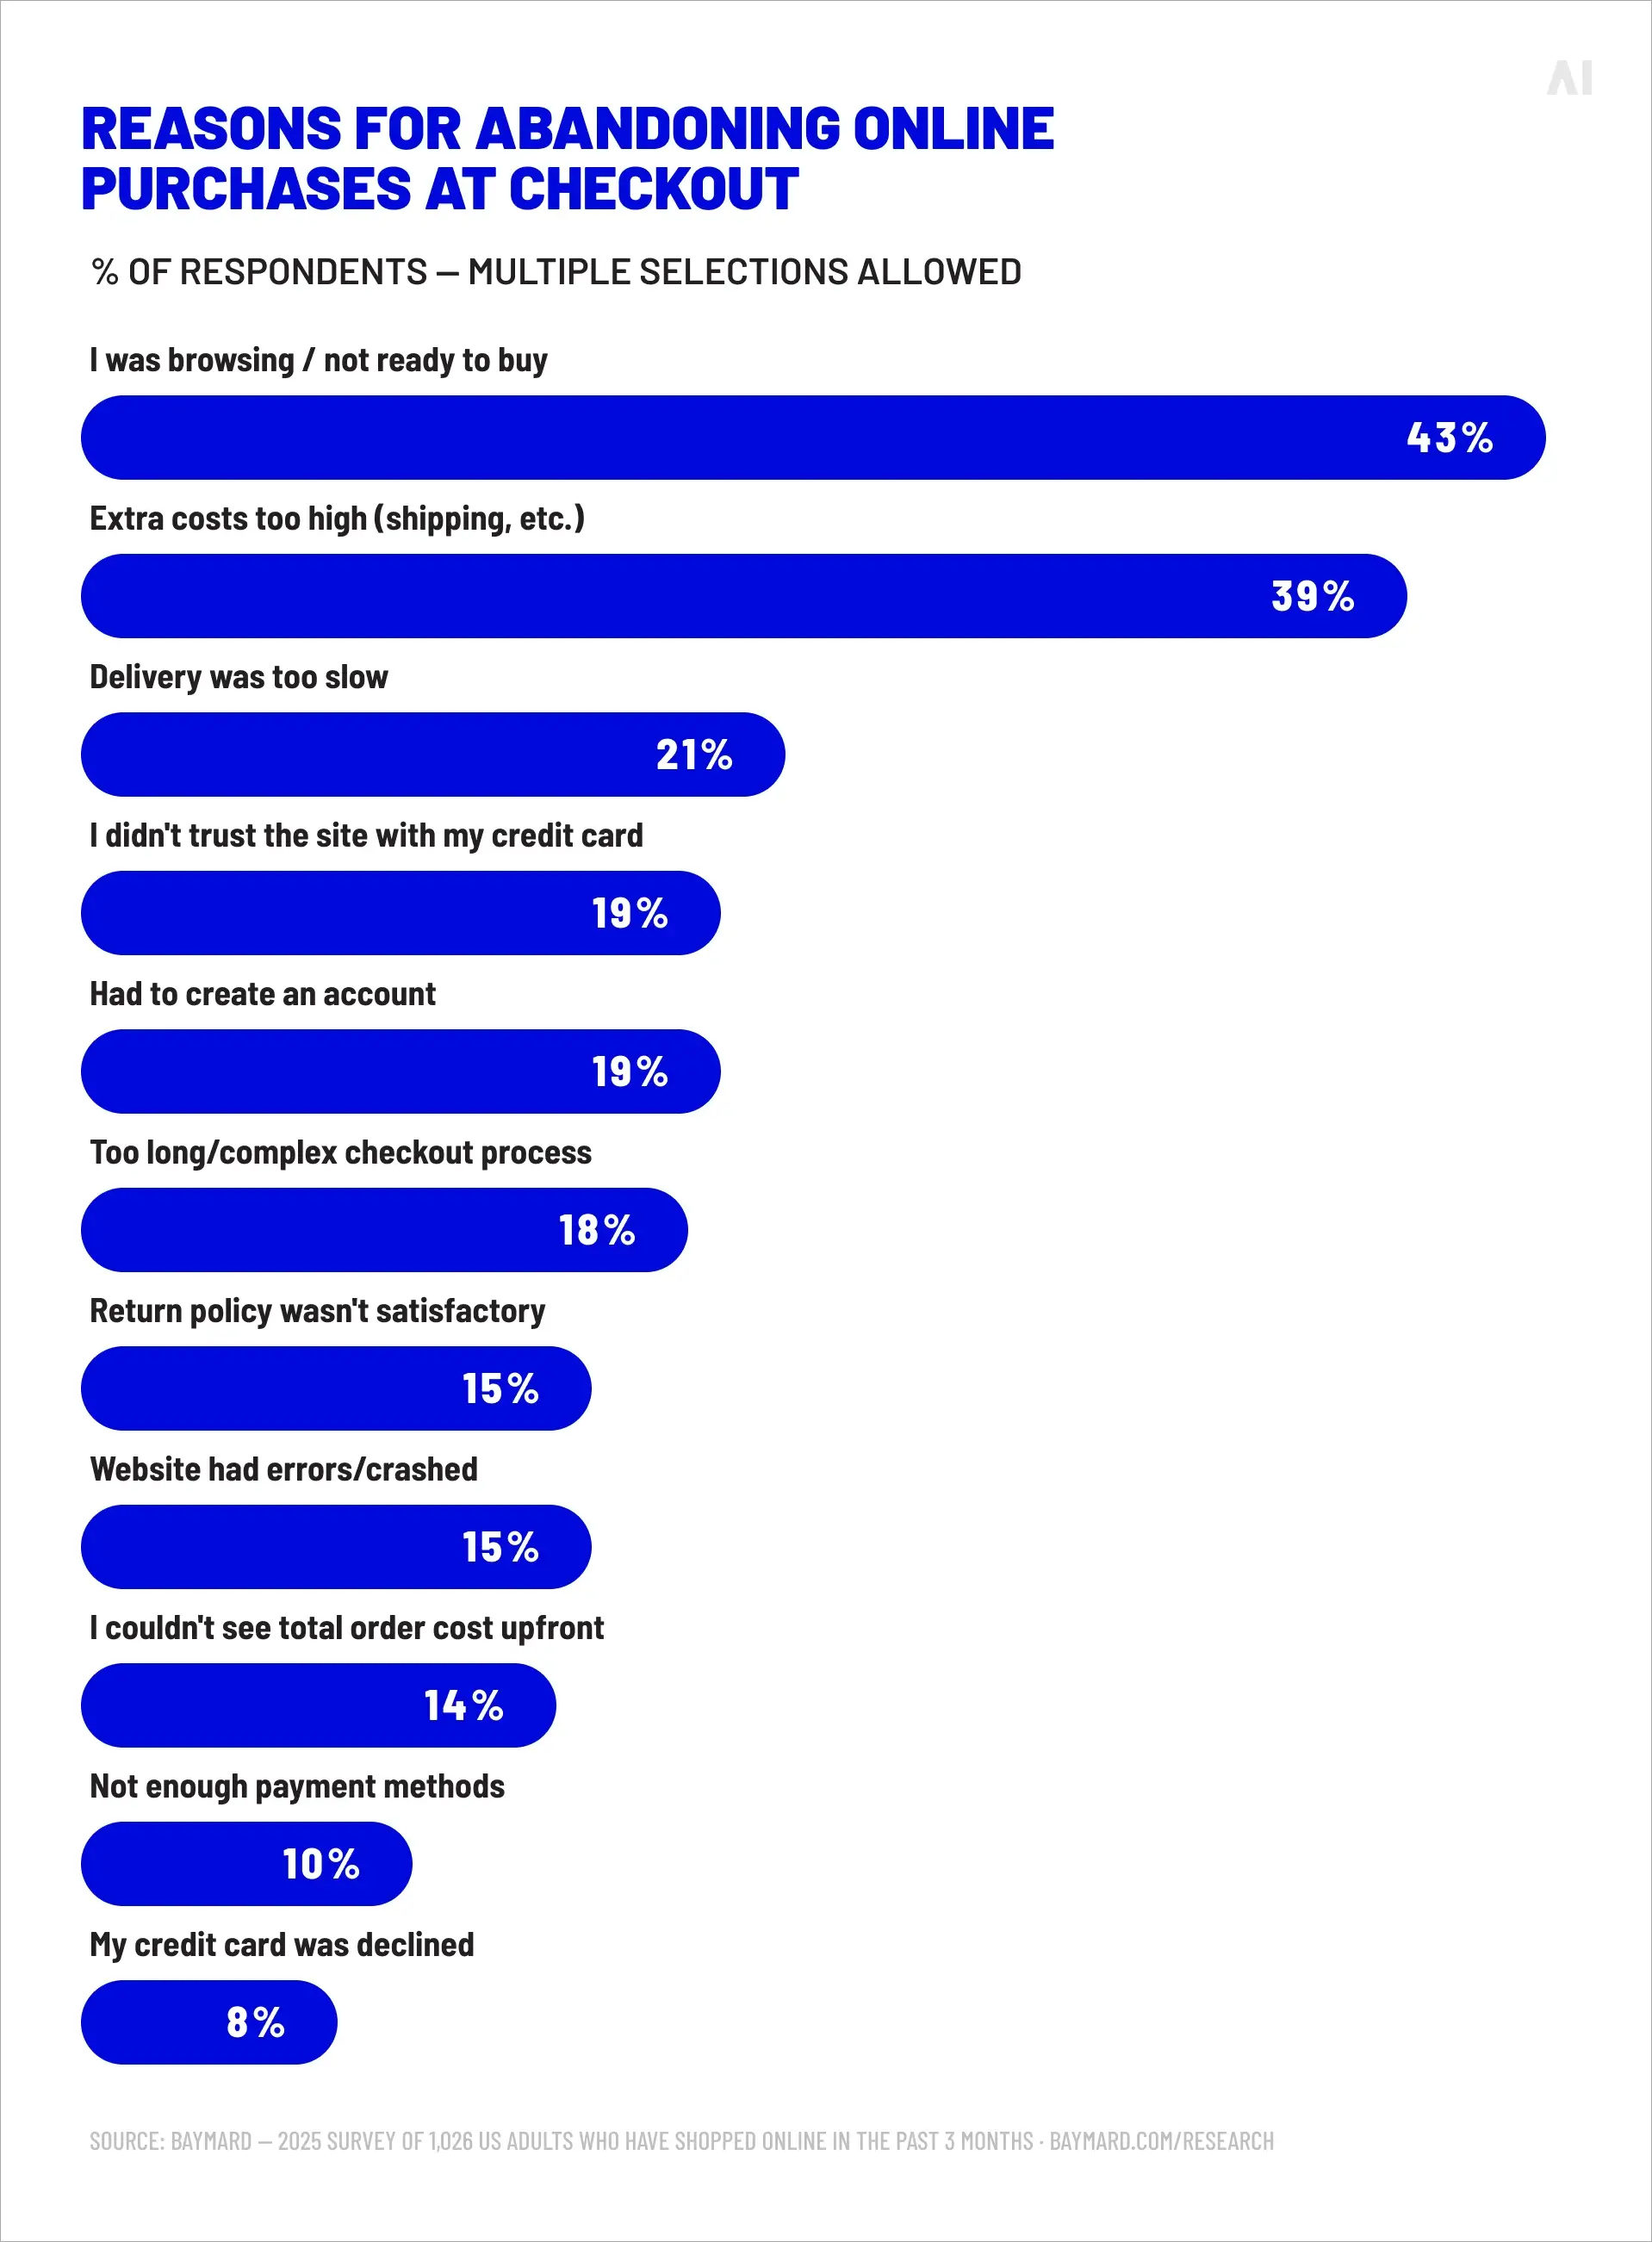
Teams that optimize well track step-level drop-off, segment-specific conversion, funnel completion rate and abandonment by field or action. The headline number is the output; the step-level view is the diagnosis. Research from Baymard Institute puts the global cart abandonment rate at 70.19%—and calculates that better checkout design alone could lift conversion by 35.26%, worth an estimated $260 billion in recoverable orders across the US and EU.
Reasons for abandoning online purchases at checkout (Source)
Retention and customer quality metrics
Acquisition gets attention; retention compounds. The most useful retention-facing metrics are returning user rate, cohort retention curves, customer lifetime value and repeat-purchase rate. Read together, they answer a question that single-session analytics cannot: which users are worth earning back, and what did we do that earned them?
How digital experience analytics tools and methods drive insights
The methods below are not a shopping list so much as a set of complementary lenses. The strongest teams triangulate across several at once—behavioral signals with qualitative feedback, replay with segmentation, heatmaps with experimentation. No single method produces a complete picture.
Session replay and journey analysis
Session replay reconstructs individual user sessions as viewable recordings. Journey analysis aggregates those sessions into path maps, showing the routes users take, where they cluster, and where they leak. Replay is the diagnostic tool—it tells you what a single user experienced. Journey analysis is the strategic view—it tells you whether that experience is typical.
Used together, they answer questions that dashboards cannot: where in the flow people are hesitating, which paths the highest-value customers take, and which detours quietly cost the most revenue.
Heatmaps visualize aggregated interaction—click density, scroll depth, hover concentration—overlaid on the page itself. They are genuinely useful for landing page design, above-the-fold decisions and content prioritization. They are genuinely misleading for complex app UIs where interaction is task-specific rather than attention-driven. A heatmap that shows clicks scattered across a product listing page tells you how users are browsing; the same density on a checkout page usually means something has gone wrong.
Form analytics and conversion optimization
Forms are where experience analytics most reliably pays for itself. Field-level analytics reveals time-per-field, error rates, skip patterns and the precise field at which users abandon. The insights are usually immediate and actionable: a failing validator, a poorly explained field, a required input that should be optional.
Baymard's research, cited above, underscores why this matters. Checkout UX is a conversion lever of the first order, and the gap between the current global average and what is achievable is measured in hundreds of billions of dollars. Form analytics is how that gap gets closed.
Segmentation and behavioral analysis
Demographic segmentation is easy and mostly wrong. Two 35-year-old urban professionals on the same income can behave entirely differently online.
Behavioral segmentation—grouping users by what they actually do, not by what a database says they are—tends to be more predictive and more useful.
The groupings that consistently earn their keep are first-time vs returning, high-intent vs exploratory, and high-engagement vs low-engagement. Layered onto campaign data, they transform both the precision of targeting and the quality of experience design.
⚡ Behavior is the most honest data you can collect about a customer. It's what they do when no one is asking them what they think.
A/B and multivariate testing are the formal mechanisms by which hypothesis becomes decision. Usability testing complements them with qualitative depth. The discipline that separates good experimentation from theater is hypothesis-first thinking: knowing why you expect a change to move a metric before you run it, and resisting the temptation to ship anything that shows a two-day bump without statistical rigor. Significance is necessary; business significance is what counts.
User feedback and qualitative insights
Behavioral data tells you what users did. It rarely tells you why. That is what intercept surveys, NPS, exit-intent questions and open feedback loops are for. Neither channel is sufficient alone—qualitative without behavioral data is selection-biased anecdote; behavioral without qualitative is inference without context. The best teams pair the two.
Best practices for implementing digital experience analytics
There is no great mystery to doing this well. The teams that extract real value from experience analytics do a few things consistently that their peers do inconsistently.
1. Align analytics with business outcomes
Every dashboard should answer a commercial question. If a report does not tie, even loosely, to revenue, retention, acquisition cost or margin, it is information for its own sake. Analytics leaders who win internal budget battles tend to start from the outcome and work backwards to the signal, not the other way around.
2. Focus on high-impact touchpoints
Pareto applies ruthlessly here. A handful of pages and flows—checkout, key landing pages, high-intent search results, the primary activation journey—account for most of the conversion value. Instrumenting those deeply is nearly always more valuable than instrumenting everything shallowly.
Insight built on bad data is worse than no insight at all, because it is trusted. A standardized event taxonomy, shared metric definitions across teams, proper consent management, and regular data QA are not glamorous work. They are the foundation that makes everything above them possible.
4. Avoid vanity metrics
Pageviews, impressions, total sessions and raw traffic flatter reports and rarely move decisions. McKinsey's research on relevance offers a useful corrective: over 75% of consumers are turned off by content that doesn't feel relevant. A metric that cannot distinguish the 25% who might still engage is a metric that will flatter you into irrelevance. The KPIs that matter are the ones tied to outcomes—and owned by someone with the authority to act on them.
How to build a scalable analytics strategy with AI Digital
Experience analytics only pays back when insight can flow all the way through to action—and at scale, that is an infrastructure problem as much as an analytical one. Fragmented data, slow decision-making, and inefficient media execution are the three costs most commonly left on the table. AI Digital's approach addresses each in turn.
Unify fragmented data and improve measurement
The scale of the fragmentation problem is routinely underappreciated. Salesforce's 2025 research found that the average enterprise uses 897 applications, and only 29% of them are connected. The same study estimates that 19% of organizational data is siloed, inaccessible or otherwise unusable—and 70% of data leaders believe their most valuable business insights reside within that inaccessible portion.
Walled gardens compound the problem by locking cross-platform visibility behind proprietary dashboards. AI Digital's Open Garden framework is built specifically to counter this: a DSP-agnostic, cross-platform approach that unifies performance data across 15+ DSPs and 9+ SSPs, so teams can see the whole journey—not just the portion any single platform is willing to show them.
Unified data is necessary but not sufficient. The next constraint is cognitive: there is simply too much of it to analyze manually in the time commercial decisions allow. 84% of data and analytics leaders say their data strategies need a complete overhaul before their AI ambitions can succeed, and 65% of senior executives now identify AI and predictive analytics as primary contributors to growth.
AI Digital's Elevate platform is built for exactly this constraint. Positioned as a marketing intelligence platform covering the full digital landscape—not just programmatic—Elevate unifies research, planning, optimization and reporting in a single intelligence layer. It draws on 150 billion data points monthly and 10,000+ audience attributes to surface AI-ranked insight: audience segmentation, competitive analysis, cookieless targeting, marketing mix modeling, and path-to-conversion attribution among them.
⚡ Generating more data is not the goal. Cutting the time it takes to make a decision, and raising the quality of the decisions that cannot wait, is.
Improve media efficiency and eliminate wasted spend
Behavioral insight only pays back if the media execution on the other side is efficient enough to respect it. That is where supply-side waste—fraudulent inventory, low-quality placements, bloated ad tech chains—quietly erodes value.
AI Digital's Smart Supply is the efficiency layer: direct SSP relationships, AI-powered supply path optimization, and curation that filters low-value impressions before they reach the buy side.
The result is less wasted spend, cleaner measurement and higher-quality engagement—which, crucially, feeds back into cleaner experience analytics.
Read as a loop, the three pillars become more than the sum of their parts. Unified data (Open Garden) feeds AI-driven insight (Elevate); insight informs efficient media execution (Smart Supply); cleaner execution produces better measurement; better measurement feeds the next round of insight. This is the system the best-performing teams are quietly building—and the reason one-off optimization projects so consistently underperform ongoing ones.
The continuous optimization loop
⚡ It is worth being precise about this: continuous optimization is not a better project. It is a different discipline—one that demands different habits, different rhythms, and a different relationship with the data.
Conclusion: Turn user behavior insights into measurable growth
Fragmentation is the condition of modern marketing. Digital experience analytics is the response. Continuous optimization, built on unified data and AI-driven insight, is the discipline that makes the whole thing pay off.
Four takeaways worth holding on to:
Behavioral data matters only when it leads to action. Observation without decision is cost.
Unified measurement is essential for understanding the full customer journey. Without it, every channel looks like it is working, and none of them are talking.
AI-driven insight changes the tempo. When the system prioritizes, human judgment gets applied where it counts.
If your own organization's analytics stack looks closer to the pre-agentic era than it ought to, that is usually the starting point of a worthwhile conversation. AI Digital works with senior marketing, product and CX teams to build the three pieces that turn digital experience analytics into durable commercial outcomes—Open Garden for unified cross-platform measurement, Elevate for AI-driven insight and planning, and Smart Supply for efficient, transparent media execution. If any of that sounds useful, get in touch.
• Platforms own AI models and train on proprietary data • Brands have little visibility into decision-making • "Walled gardens" restrict data access
• Inefficient ad spend • Limited strategic control • Eroded consumer trust • Potential budget mismanagement
Open Garden framework providing: • Complete transparency • DSP-agnostic execution • Cross-platform data & insights
Optimizing ads vs. optimizing impact
• AI excels at short-term metrics but may struggle with brand building • Consumers can detect AI-generated content • Efficiency might come at cost of authenticity
• Short-term gains at expense of brand health • Potential loss of authentic connection • Reduced effectiveness in storytelling
Smart Supply offering: • Human oversight of AI recommendations • Custom KPI alignment beyond clicks • Brand-safe inventory verification
The illusion of personalization
• Segment optimization rebranded as personalization • First-party data infrastructure challenges • Personalization vs. surveillance concerns
• Potential mismatch between promise and reality • Privacy concerns affecting consumer trust • Cost barriers for smaller businesses
Elevate platform features: • Real-time AI + human intelligence • First-party data activation • Ethical personalization strategies
AI-Driven efficiency vs. decision-making
• AI shifting from tool to decision-maker • Black box optimization like Google Performance Max • Human oversight limitations
• Strategic control loss • Difficulty questioning AI outputs • Inability to measure granular impact • Potential brand damage from mistakes
Managed Service with: • Human strategists overseeing AI • Custom KPI optimization • Complete campaign transparency
Fig. 1. Summary of AI blind spots in advertising
Dimension
Walled garden advantage
Walled garden limitation
Strategic impact
Audience access
Massive, engaged user bases
Limited visibility beyond platform
Reach without understanding
Data control
Sophisticated targeting tools
Data remains siloed within platform
Fragmented customer view
Measurement
Detailed in-platform metrics
Inconsistent cross-platform standards
Difficult performance comparison
Intelligence
Platform-specific insights
Limited data portability
Restricted strategic learning
Optimization
Powerful automated tools
Black-box algorithms
Reduced marketer control
Fig. 2. Strategic trade-offs in walled garden advertising.
Core issue
Platform priority
Walled garden limitation
Real-world example
Attribution opacity
Claiming maximum credit for conversions
Limited visibility into true conversion paths
Meta and TikTok's conflicting attribution models after iOS privacy updates
Data restrictions
Maintaining proprietary data control
Inability to combine platform data with other sources
Amazon DSP's limitations on detailed performance data exports
Cross-channel blindspots
Keeping advertisers within ecosystem
Fragmented view of customer journey
YouTube/DV360 campaigns lacking integration with non-Google platforms
Black box algorithms
Optimizing for platform revenue
Reduced control over campaign execution
Self-serve platforms using opaque ML models with little advertiser input
Performance reporting
Presenting platform in best light
Discrepancies between platform-reported and independently measured results
Consistently higher performance metrics in platform reports vs. third-party measurement
Fig. 1. The Walled garden misalignment: Platform interests vs. advertiser needs.
Key dimension
Challenge
Strategic imperative
ROAS volatility
Softer returns across digital channels
Shift from soft KPIs to measurable revenue impact
Media planning
Static plans no longer effective
Develop agile, modular approaches adaptable to changing conditions
Brand/performance
Traditional division dissolving
Create full-funnel strategies balancing long-term equity with short-term conversion
Capability
Key features
Benefits
Performance data
Elevate forecasting tool
• Vertical-specific insights • Historical data from past economic turbulence • "Cascade planning" functionality • Real-time adaptation
• Provides agility to adjust campaign strategy based on performance • Shows which media channels work best to drive efficient and effective performance • Confident budget reallocation • Reduces reaction time to market shifts
• Dataset from 10,000+ campaigns • Cuts response time from weeks to minutes
• Reaches people most likely to buy • Avoids wasted impressions and budgets on poor-performing placements • Context-aligned messaging
• 25+ billion bid requests analyzed daily • 18% improvement in working media efficiency • 26% increase in engagement during recessions
Full-funnel accountability
• Links awareness campaigns to lower funnel outcomes • Tests if ads actually drive new business • Measures brand perception changes • "Ask Elevate" AI Chat Assistant
• Upper-funnel to outcome connection • Sentiment shift tracking • Personalized messaging • Helps balance immediate sales vs. long-term brand building
• Natural language data queries • True business impact measurement
Open Garden approach
• Cross-platform and channel planning • Not locked into specific platforms • Unified cross-platform reach • Shows exactly where money is spent
• Reduces complexity across channels • Performance-based ad placement • Rapid budget reallocation • Eliminates platform-specific commitments and provides platform-based optimization and agility
• Coverage across all inventory sources • Provides full visibility into spending • Avoids the inability to pivot across platform as you’re not in a singular platform
Fig. 1. How AI Digital helps during economic uncertainty.
Trend
What it means for marketers
Supply & demand lines are blurring
Platforms from Google (P-Max) to Microsoft are merging optimization and inventory in one opaque box. Expect more bundled “best available” media where the algorithm, not the trader, decides channel and publisher mix.
Walled gardens get taller
Microsoft’s O&O set now spans Bing, Xbox, Outlook, Edge and LinkedIn, which just launched revenue-sharing video programs to lure creators and ad dollars. (Business Insider)
Retail & commerce media shape strategy
Microsoft’s Curate lets retailers and data owners package first-party segments, an echo of Amazon’s and Walmart’s approaches. Agencies must master seller-defined audiences as well as buyer-side tactics.
AI oversight becomes critical
Closed AI bidding means fewer levers for traders. Independent verification, incrementality testing and commercial guardrails rise in importance.
Fig. 1. Platform trends and their implications.
Metric
Connected TV (CTV)
Linear TV
Video Completion Rate
94.5%
70%
Purchase Rate After Ad
23%
12%
Ad Attention Rate
57% (prefer CTV ads)
54.5%
Viewer Reach (U.S.)
85% of households
228 million viewers
Retail Media Trends 2025
Access Complete consumer behaviour analyses and competitor benchmarks.
Identify and categorize audience groups based on behaviors, preferences, and characteristics
Michaels Stores: Implemented a genAI platform that increased email personalization from 20% to 95%, leading to a 41% boost in SMS click through rates and a 25% increase in engagement.
Estée Lauder: Partnered with Google Cloud to leverage genAI technologies for real-time consumer feedback monitoring and analyzing consumer sentiment across various channels.
High
Medium
Automated ad campaigns
Automate ad creation, placement, and optimization across various platforms
Showmax: Partnered with AI firms toautomate ad creation and testing, reducing production time by 70% while streamlining their quality assurance process.
Headway: Employed AI tools for ad creation and optimization, boosting performance by 40% and reaching 3.3 billion impressions while incorporating AI-generated content in 20% of their paid campaigns.
High
High
Brand sentiment tracking
Monitor and analyze public opinion about a brand across multiple channels in real time
L’Oréal: Analyzed millions of online comments, images, and videos to identify potential product innovation opportunities, effectively tracking brand sentiment and consumer trends.
Kellogg Company: Used AI to scan trending recipes featuring cereal, leveraging this data to launch targeted social campaigns that capitalize on positive brand sentiment and culinary trends.
High
Low
Campaign strategy optimization
Analyze data to predict optimal campaign approaches, channels, and timing
DoorDash: Leveraged Google’s AI-powered Demand Gen tool, which boosted its conversion rate by 15 times and improved cost per action efficiency by 50% compared with previous campaigns.
Kitsch: Employed Meta’s Advantage+ shopping campaigns with AI-powered tools to optimize campaigns, identifying and delivering top-performing ads to high-value consumers.
High
High
Content strategy
Generate content ideas, predict performance, and optimize distribution strategies
JPMorgan Chase: Collaborated with Persado to develop LLMs for marketing copy, achieving up to 450% higher clickthrough rates compared with human-written ads in pilot tests.
Hotel Chocolat: Employed genAI for concept development and production of its Velvetiser TV ad, which earned the highest-ever System1 score for adomestic appliance commercial.
High
High
Personalization strategy development
Create tailored messaging and experiences for consumers at scale
Stitch Fix: Uses genAI to help stylists interpret customer feedback and provide product recommendations, effectively personalizing shopping experiences.
Instacart: Uses genAI to offer customers personalized recipes, mealplanning ideas, and shopping lists based on individual preferences and habits.
Medium
Medium
Share article
Url copied to clipboard
No items found.
Subscribe to our Newsletter
THANK YOU FOR YOUR SUBSCRIPTION
Oops! Something went wrong while submitting the form.
Questions? We have answers
What is digital experience analytics?
Digital experience analytics is the discipline of capturing and interpreting how users behave across a brand's digital touchpoints—and using that understanding to improve engagement, conversion and retention outcomes. It combines behavioral signals (clicks, paths, hesitations) with quantitative metrics (sessions, conversion rates, revenue) to produce a picture that neither can supply alone.
Which digital experience analytics metrics actually matter?
The metrics that matter fall into three families: engagement (session depth, scroll depth, interaction rate, return-session rate), conversion (step-level drop-off, segment-specific conversion rate, field-level abandonment) and retention (returning user rate, cohort retention, customer lifetime value). The common thread is that each, properly tracked, ties to a commercial outcome rather than simply flattering a dashboard.
How do you identify user friction and drop-off points?
Friction is identified by triangulating three methods: funnel analysis to show where users drop off, session replay to show what they were trying to do, and form or element-level analytics to show which specific interaction failed them. A funnel alone tells you that 12% of users left at step three; replay and form analytics tell you why—and therefore what to fix.
What tools are best for digital experience analytics?
The right tool depends on scope. A dedicated digital experience analytics platform handles on-site behavior; a customer journey analytics platform stitches cross-channel interactions together; a marketing intelligence platform such as AI Digital's Elevate connects behavioral insight to media planning and measurement across the full ecosystem. The most important criteria are data stitching quality, cross-channel coverage, and the speed at which insight can be acted on.
How does AI improve digital experience analytics?
AI speeds up the two things humans cannot do at scale: pattern detection across millions of sessions, and prioritization of which insights matter most. AI-led analytics can flag anomalies in real time, rank friction hotspots by revenue impact, surface behavioral segments that would not be obvious manually, and reduce the time between observation and decision from weeks to minutes.
How can digital experience analytics increase conversions?
By revealing where and why users are dropping off, testing fixes, and measuring the impact. Baymard Institute estimates that better checkout UX alone could lift ecommerce conversion rates by more than 35%. Most of those gains come from the kind of field-level, session-level insight that experience analytics provides and that aggregate reporting misses.
What is the difference between web analytics and experience analytics?
Web analytics reports what happened on a page—sessions, pageviews, bounce rate, conversion. Experience analytics, or digital customer experience analytics, interprets how users behaved across the journey and ties that behavior to outcomes. Web analytics answers the "what"; experience analytics answers the "why" and "what to do about it." The former is a reporting tool. The latter is a decision-making system.
Have other questions?
If you have more questions, contact us so we can help.


.svg)
.svg)