Digital Signage Advertising Networks: How They Work and Generate Measurable Revenue
Sarah Moss
April 7, 2026
19
minutes read
Digital signage advertising networks turn physical screens into measurable media, with targeting, delivery verification, and reporting built in. This guide explains how they work and how they drive revenue and performance visibility at scale.
Digital signage networks sit at a practical intersection: the real-world scale of out-of-home and the operational discipline of digital advertising. For advertisers, the appeal is straightforward. You can reach people when they’re out shopping, commuting, waiting, or moving through venues that matter—and you can do it with tighter control than traditional printed placements.
For media owners (retailers, transit operators, property groups, venue operators), a digital signage network is a monetization engine. It helps you sell “spare minutes” on screens, package impressions across locations, keep creative fresh without manual labor, and prove what ran so buyers keep coming back.
This guide breaks down what a digital signage advertising network is, how it works end-to-end, what infrastructure makes it reliable, and how modern networks drive measurable outcomes through targeting, monetization, and performance measurement. You’ll also get a grounded framework for choosing the right network approach, whether you’re building a small signage network in one location or operating digital signage networks at national scale.
A digital signage advertising network is the combination of people, software, and hardware that (1) packages screen time as ad inventory, (2) sells it to advertisers, (3) delivers creative to the right screens at the right time, and (4) verifies playback and reports performance.
If you already run digital signage for customer messaging (menus, in-store promos, wayfinding), you’re partway there. The difference is that a true signage advertising network behaves like media:
It defines inventory in a consistent way (screens, loops, time slots, rules).
It supports commercial workflows (rates, packaging, approvals, billing).
It provides delivery accountability (proof-of-play, monitoring, make-goods).
It enables measurement and optimization (impression models, pacing, insights).
In the broader DOOH ecosystem, digital signage networks are the “supply side” of physical screens. They connect advertisers to real-world placements in retail, transit, offices, gyms, campuses, healthcare, hospitality, and other venues where people spend time.
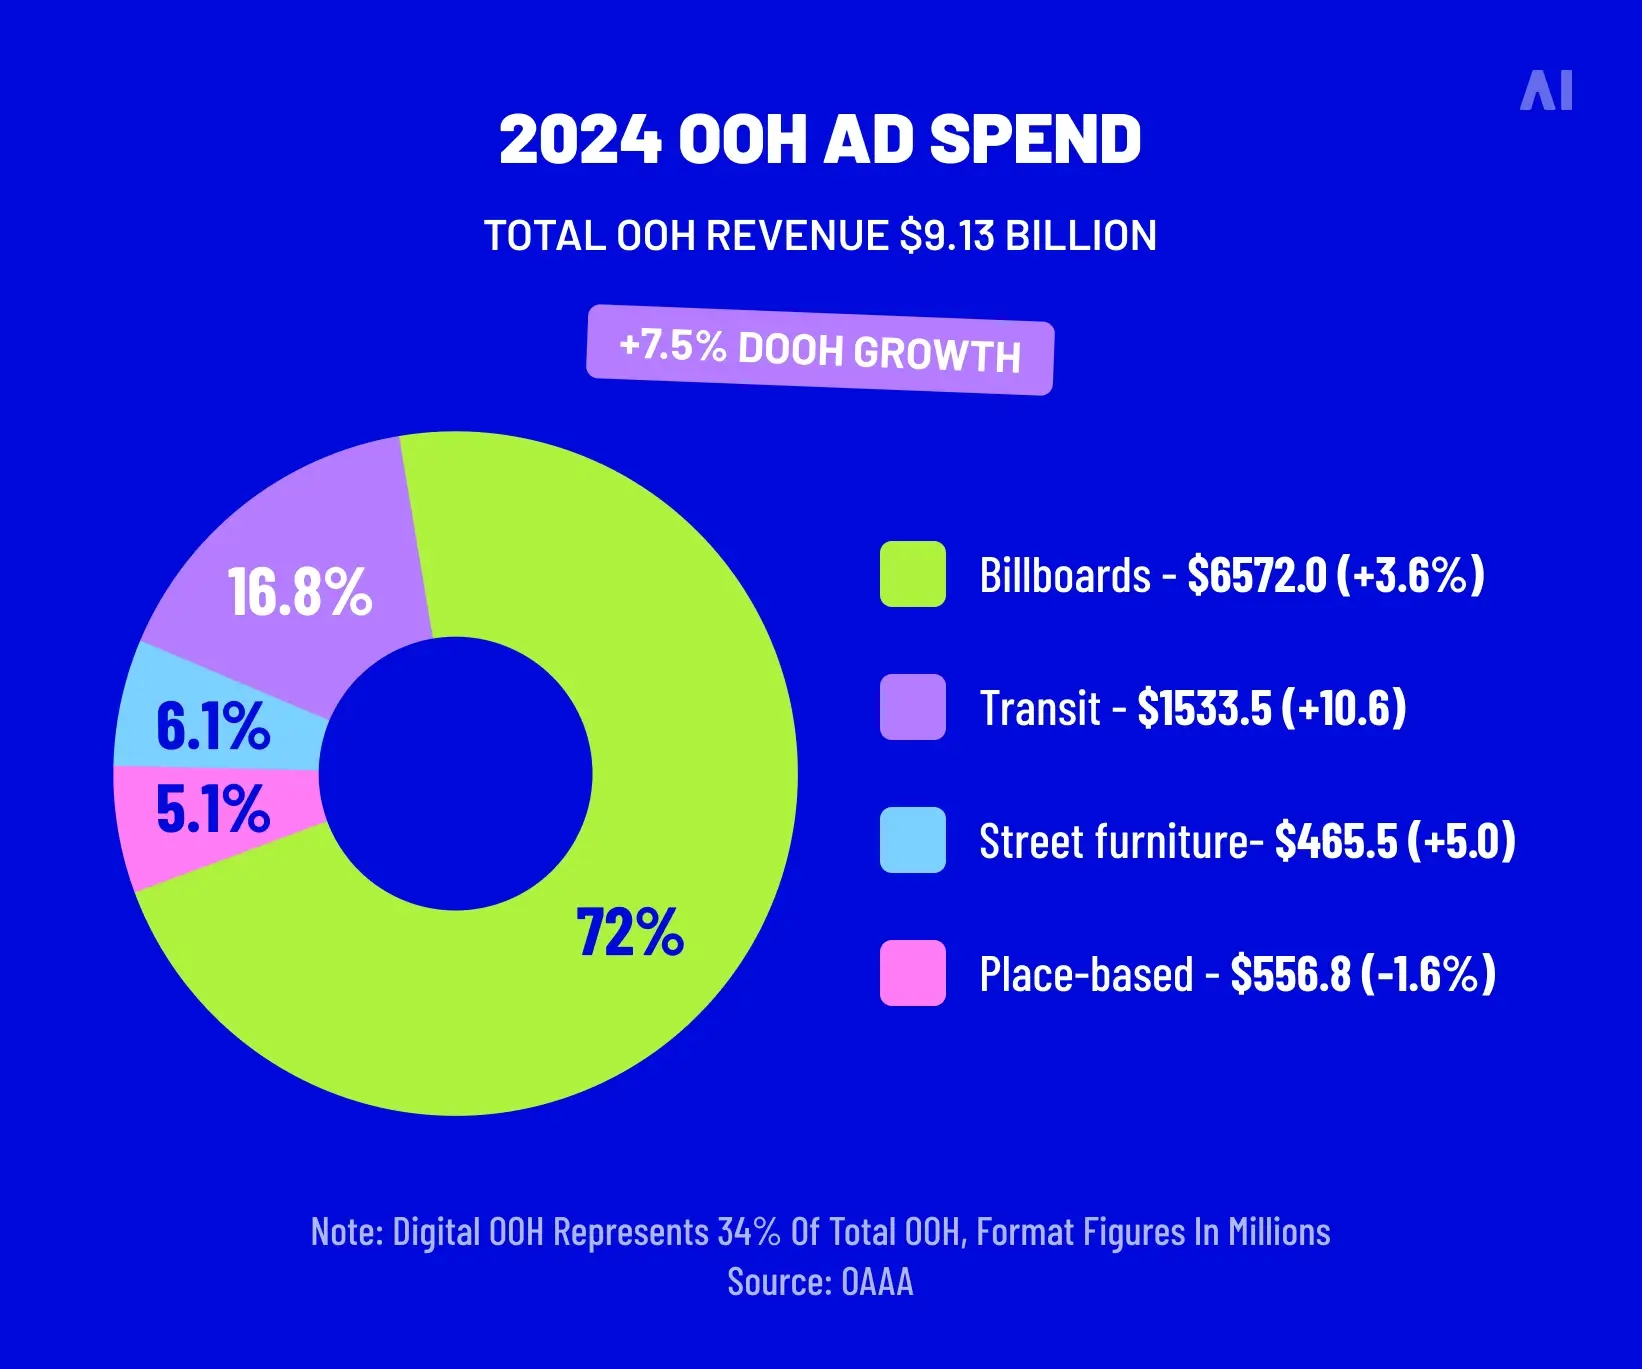
⚡ OOH revenue reached$2.86B in Q2 2025, with 3% year-over-year growth—a useful reminder that “real-world media” is still expanding while other channels fragment.
Who benefits?
Advertisers get context, proximity, and real-world attention moments that complement CTV, mobile, and search.
Retailers and venue operators monetize screen time while also improving in-venue experience.
Transit operators and property groups bring structure and repeatability to media sales across locations.
Publishers and media owners extend their footprint into place-based screens and bundle it with other channels.
At a high level, digital signage networks run on a predictable loop: sell inventory → deliver creative → confirm playback → report → optimize. The mechanics vary by network type (single-location, private multi-location, programmatic DOOH), but the logic stays consistent.
Content adjacency rules (brand safety in physical spaces is still a thing)
Pacing rules (steady delivery vs burst for specific periods)
The key is consistency. If every venue defines “a spot” differently, selling becomes slow, reporting becomes messy, and make-goods become constant.
2. Campaigns are booked (direct or programmatic)
Most digital signage advertising networks support two buying paths:
Direct sales: A buyer agrees on placement, dates, and pricing with the media owner (or sales partner). This is common for high-value locations, sponsorships, seasonal packages, and integrated retail campaigns.
Programmatic: Inventory is made available through automated buying. Buyers can bid and run campaigns with less manual coordination, often using DSP workflows they already know.
Neither is “better” by default. Many networks do best with a hybrid approach: direct for premium and predictable revenue, programmatic to fill unsold time and unlock incremental demand.
DOOH creative still needs operations. Even if the buyer provides “digital files,” the network must confirm:
Correct format and resolution for each screen type
Safe zone and legibility (distance matters more than you think)
File size and codec compatibility (especially for video)
Content approvals (venue restrictions, regulated categories, local policies)
Timing (6s, 10s, 15s) aligned to the inventory product
This is where networks either build trust or lose it. A signage network that catches issues early prevents blank screens, failed playbacks, and campaign refunds.
4. Delivery is orchestrated across CMS and ad serving
This is the part many teams find confusing, so it helps to separate roles.
A Content Management System (CMS) controls what screens show and when. Think scheduling, playlists, daypart rules, local overrides, and screen health monitoring.
An ad server manages campaign logic: which ad should play, how often, and whether pacing is on track. It also helps track delivery (what was served, to where, and when).
In a mature digital signage advertising network, the CMS and ad server cooperate. The CMS provides the “stage” (the screen schedule). The ad server provides the “cast list” (the campaign decisioning).
5. Playback is monitored and verified
This is where digital signage networks become measurable media rather than “we think it ran.”
Verification commonly includes:
Proof-of-play logs: device reports that the creative rendered at a timestamp
Screen health signals: device online/offline, storage, temperature, player status
Exception handling: missed plays due to downtime trigger make-goods or rescheduling
Quality assurance: spot checks, screenshots, or third-party verification (more on this in the FAQ)
A practical point: “verification” in physical environments often needs layers. Logs are important, but so is the ability to detect misconfigurations (wrong playlist, wrong creative version, wrong daypart).
6. Reporting feeds optimization
Once delivery is stable, optimization becomes possible. Depending on sophistication, this can include:
Pacing adjustments (smooth delivery vs burst)
Screen mix refinements (more weight to high-traffic venues)
Creative rotation based on performance signals
Daypart changes aligned to real-world behaviors
⚡ If you can’t prove what played, where, and when, you don’t really have an ad network.
Core components of a digital signage network
When digital signage networks work well, it’s rarely because one tool is “great.” It’s because the infrastructure is designed to scale without falling apart under volume: more screens, more campaigns, more creative versions, more locations, more stakeholders.
Displays and hardware
In a digital signage network, hardware decisions shape revenue. Not because “a nicer screen sells better,” but because reliability and placement determine how much inventory you can confidently sell and fulfill.
Core hardware elements include:
Displays: LCD/LED screens in different brightness levels and sizes, sometimes with outdoor-rated requirements (weatherproofing, high nits, protective enclosures).
Media players: dedicated players, system-on-chip displays, or embedded devices that render content and report back to the network.
Mounting and environment: wall mounts, kiosks, menu boards, window-facing units, transit shelters, elevator banks, and more.
What matters most is not the spec sheet. It’s the operational profile:
Uptime: can the screen reliably play content for long stretches without manual resets?
Remote manageability: can you update, reboot, and troubleshoot without a site visit?
Consistency: are screen formats standardized enough to make creative ops manageable?
Placement strategy: are screens positioned to be seen, not just installed where power was easiest?
If you sell advertising on digital signage, your hardware stack becomes part of your media product. That’s why many teams align hardware decisions with broader planning principles.
A useful way to evaluate readiness is to run a simple hardware checklist. Here’s one that works for both small networks and multi-location builds.
Hardware readiness checklist (what to confirm before you sell at scale):
Screen brightness and viewing angle match the environment (indoor vs window vs outdoor).
Media player supports your creative formats and can cache content for offline playback.
Remote monitoring is in place (online status, storage, playback reporting).
Maintenance responsibility is clear (who replaces, who reboots, who escalates).
Screen grouping is defined (by venue, by zone, by audience flow).
Power, connectivity, and physical security are stable at each location.
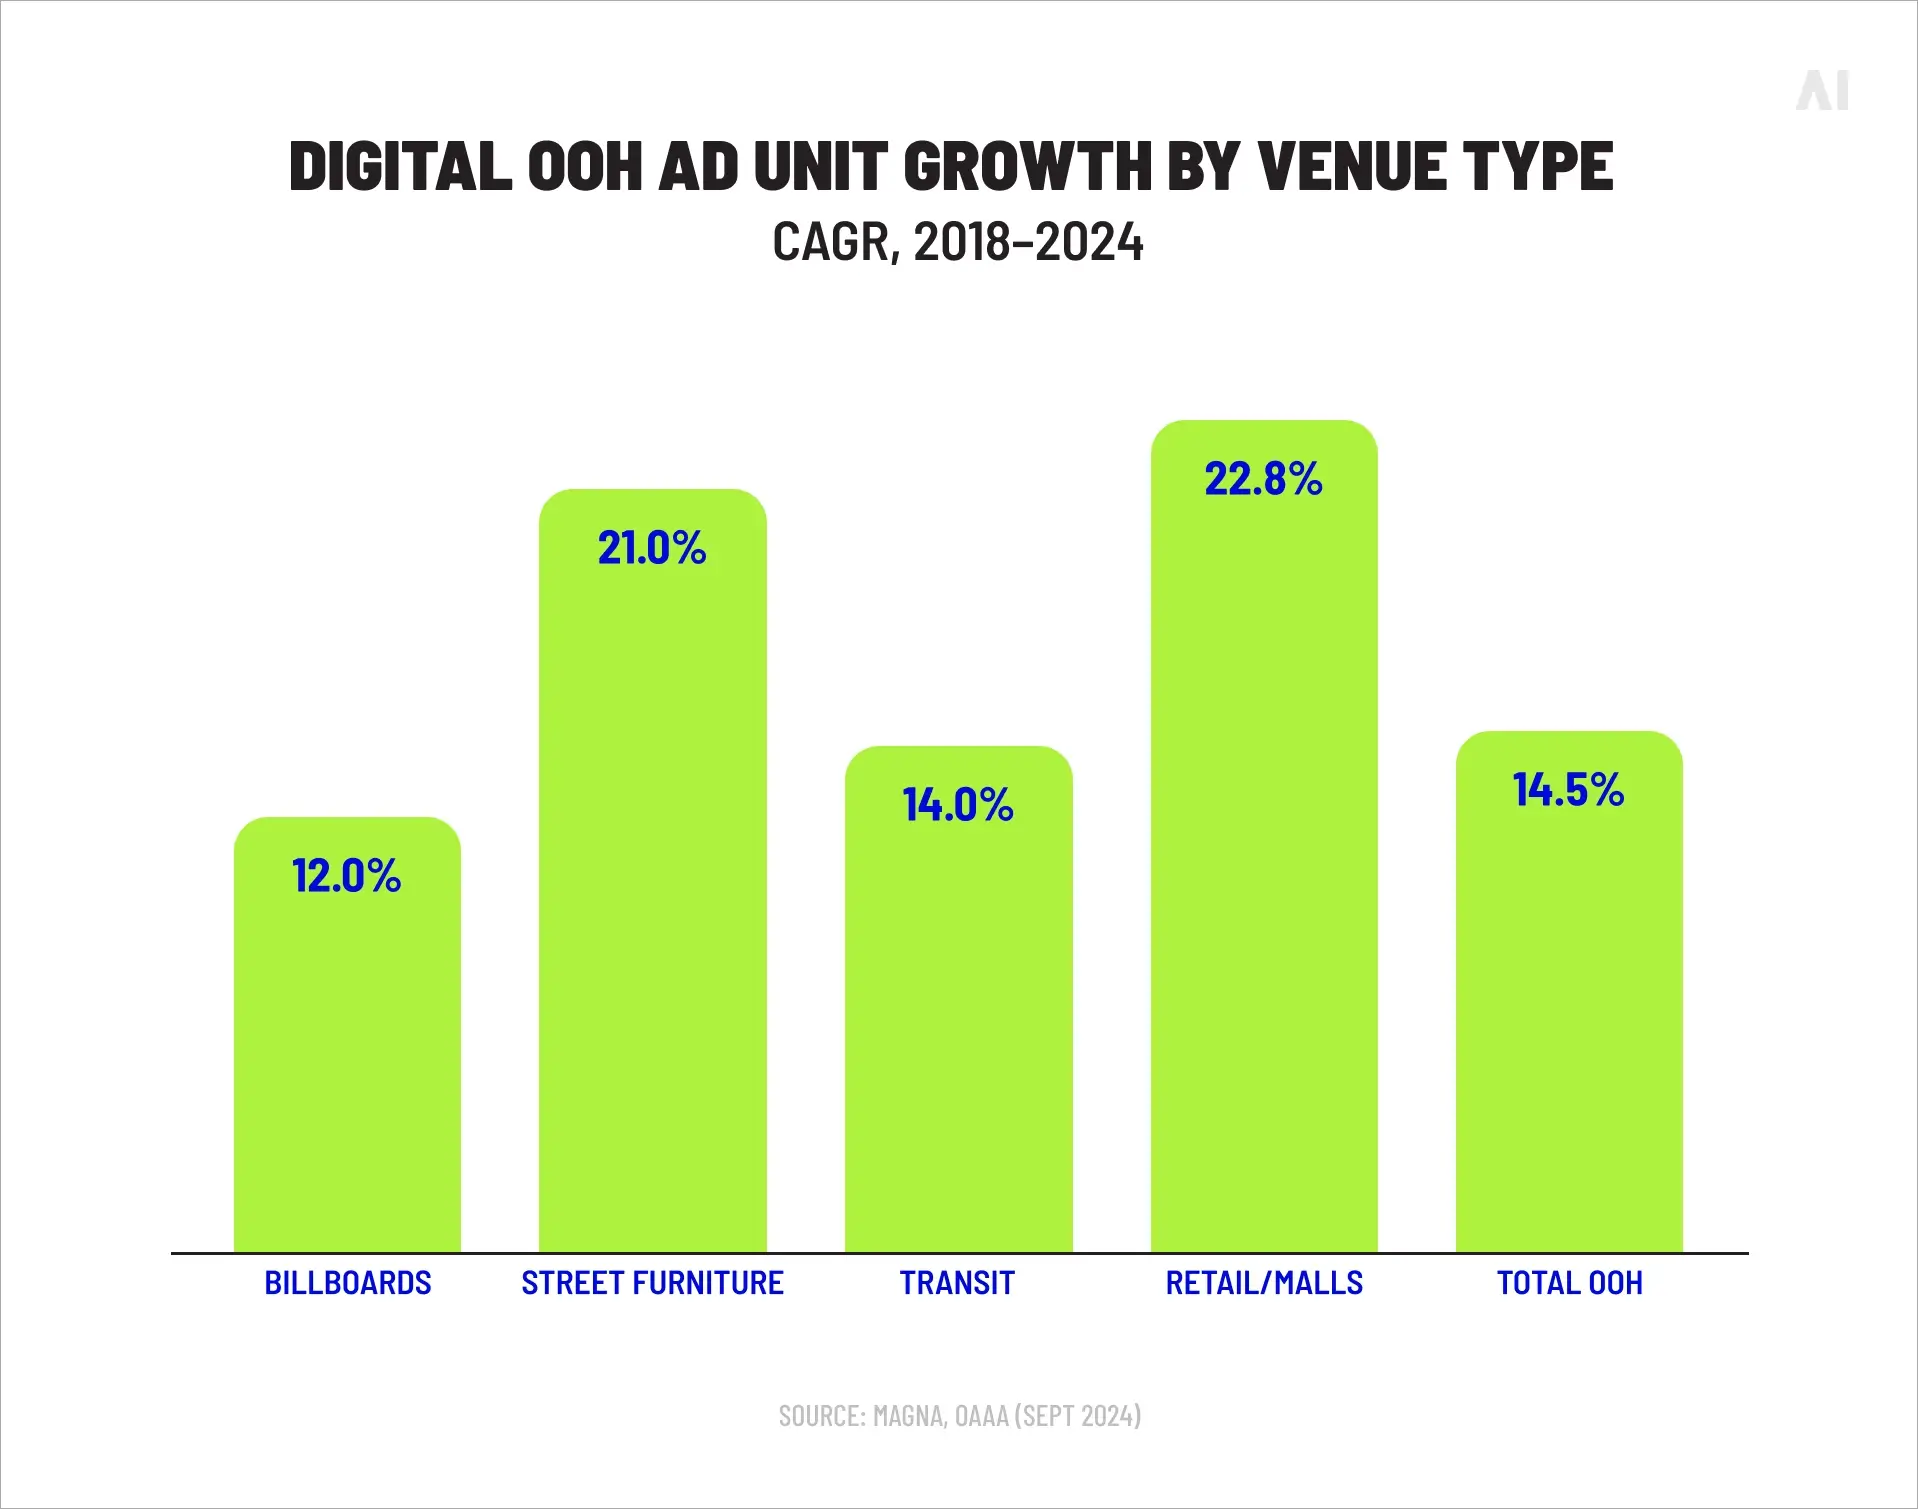
Digital OOH ad unit growth by venue type (CAGR, 2018–2024; Source)
Get these basics right and you reduce the two biggest profit killers in signage advertising networks: downtime and manual labor.
Content Management System (CMS)
A CMS is the operational center of most digital signage networks. It’s how you keep screen content consistent, scheduled, and controllable across locations.
A CMS typically handles:
Central scheduling (playlists, loops, dayparts)
Role-based access (local managers vs central ops)
Content libraries and templates
Approvals and publishing workflows
Screen monitoring and troubleshooting
Local overrides where needed (store-specific messaging, emergencies, local compliance)
For advertising on digital signage, the CMS also needs to behave like a media platform, not just a “content uploader.” That means the CMS should support:
Ad slots inside playlists (so ads can be inserted without rebuilding the whole schedule)
Separation between editorial content and paid content
Consistent rules for duration, frequency, and pacing
Reporting hooks for proof-of-play
One important distinction: a CMS helps you control screens; it does not automatically make you a monetized advertising network. Monetization requires the commercial and ad-tech layer (rates, trafficking workflows, demand connections, delivery accountability).
Network connectivity and cloud architecture
Connectivity is not exciting until it fails. Then it becomes your main operating cost.
Digital signage networks rely on connectivity to:
Distribute creative files at the right time
Update schedules quickly (especially for time-sensitive campaigns)
Report playback logs and health signals back to the platform
Enable remote troubleshooting and device management
Most modern networks use a cloud control plane plus edge playback:
The cloud platform manages assets, schedules, campaign logic, and reporting.
Devices cache content locally so screens can keep playing even if connectivity drops.
When the connection returns, logs sync and schedules reconcile.
From a business perspective, the goal is predictable delivery. That requires:
Caching strategies (so offline time doesn’t equal blank screens)
Bandwidth awareness (so large video files don’t saturate weak connections)
⚡ Programmatic doesn’t replace direct sales. It fills gaps and helps price inventory smarter.
Types of digital signage networks
Different digital signage networks exist because different businesses want different outcomes. Some want an internal network to improve in-venue messaging. Others want a full advertising network with monetization. Others want programmatic scale.
Below are the three common models and how to choose between them.
A single-location signage advertising network is a controlled environment: one store, one gym, one clinic, one office lobby, one venue. It’s often the smartest starting point because you can validate the basics before scaling.
Typical goals include:
Sell local sponsorships (nearby businesses, partners, local services)
Test pricing, creative formats, and operational workflows
Learn what “proof” buyers need to trust your reporting
This model is also where teams realize what they’re really building: not a screen, but an operational system. Even small networks need content checks, scheduling rules, and a way to handle missed plays.
Multi-location private
A private multi-location digital signage advertising network is usually owned by a retailer, a property group, a venue operator, or a transit authority. The defining trait is control: inventory, rules, and data governance remain inside one organization.
This model works well when:
You have consistent venues and want scalable packaging (regional or national buys)
Brand safety and adjacency matter (you control what runs)
You want to build first-party insights from venue behavior
You prefer stable direct revenue over volatile auction dynamics
Private networks also make it easier to standardize creative specs and reporting. That consistency becomes a competitive advantage when advertisers compare options.
Programmatic DOOH
Programmatic DOOH networks connect screen inventory to automated buying. This expands demand beyond direct relationships and makes buying easier for advertisers who already run programmatic media.
⚡ Programmatically traded DOOH is forecast to reach 10.9% of total DOOH revenues in 2025, totaling $2.2B globally—big enough to matter, still small enough that direct sales and sponsorship products remain central.
Programmatic guaranteed (predictability with automation)
For many signage networks, programmatic is an optimization layer rather than the whole strategy. It helps monetize unsold inventory, smooth out seasonality, and bring in buyers who would not negotiate direct buys.
Business benefits of digital signage advertising networks
This section focuses on outcomes. The tech enables these benefits, but the value shows up in revenue, efficiency, relevance, and measurement.
Revenue and monetization opportunities
A digital signage advertising network gives you multiple ways to monetize screen time, and you can mix them without confusing buyers if your products are well defined.
Common monetization models include:
Direct sales: sponsorships, fixed packages, seasonal campaigns, category exclusivity
Programmatic revenue: auction-based demand that improves fill for remnant inventory
Hybrid models: premium screens sold direct, secondary inventory sold programmatically
Bundled offers: signage plus social, email, onsite promotions, or loyalty placements
Performance-linked products: where appropriate, tie pricing to outcomes like store visits or lift (with clear assumptions)
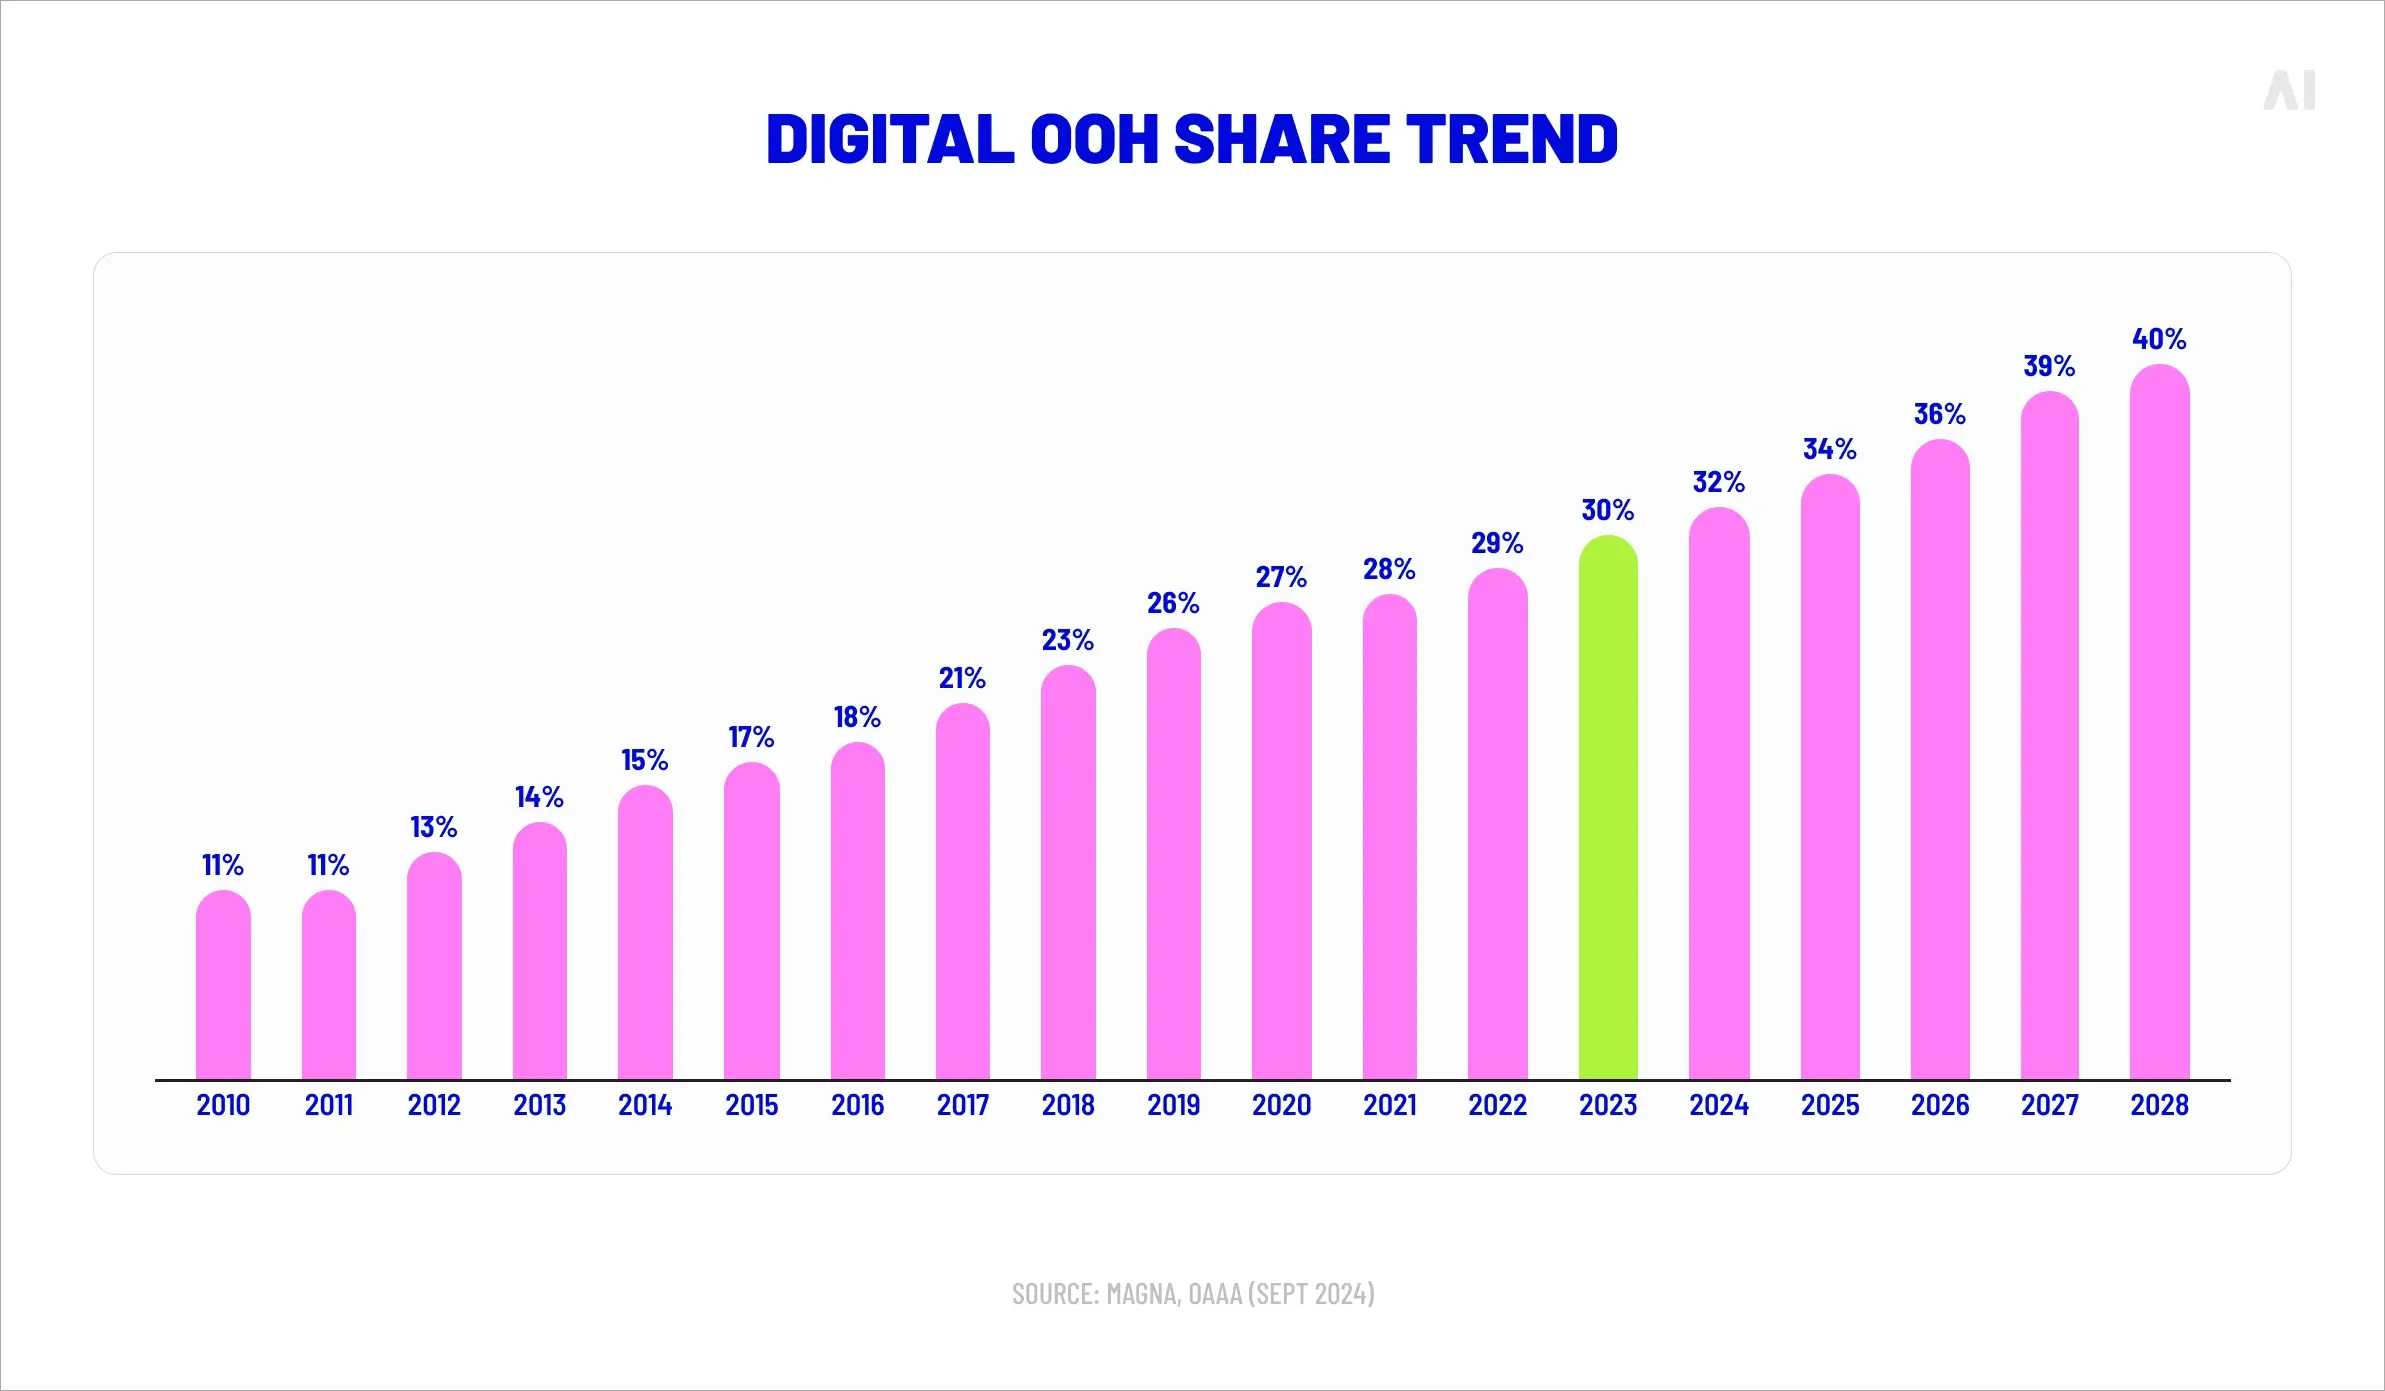
For U.S. market context, MAGNA’s Spring 2025 forecast projected out-of-home sales growing to reach the $10B milestone in 2025, with digital OOH revenue up +12% to $3.5B (35% of total OOH sales). That is not “digital signage only,” but it reflects the broader direction: digital screen-based inventory is where pricing power and growth are concentrating.
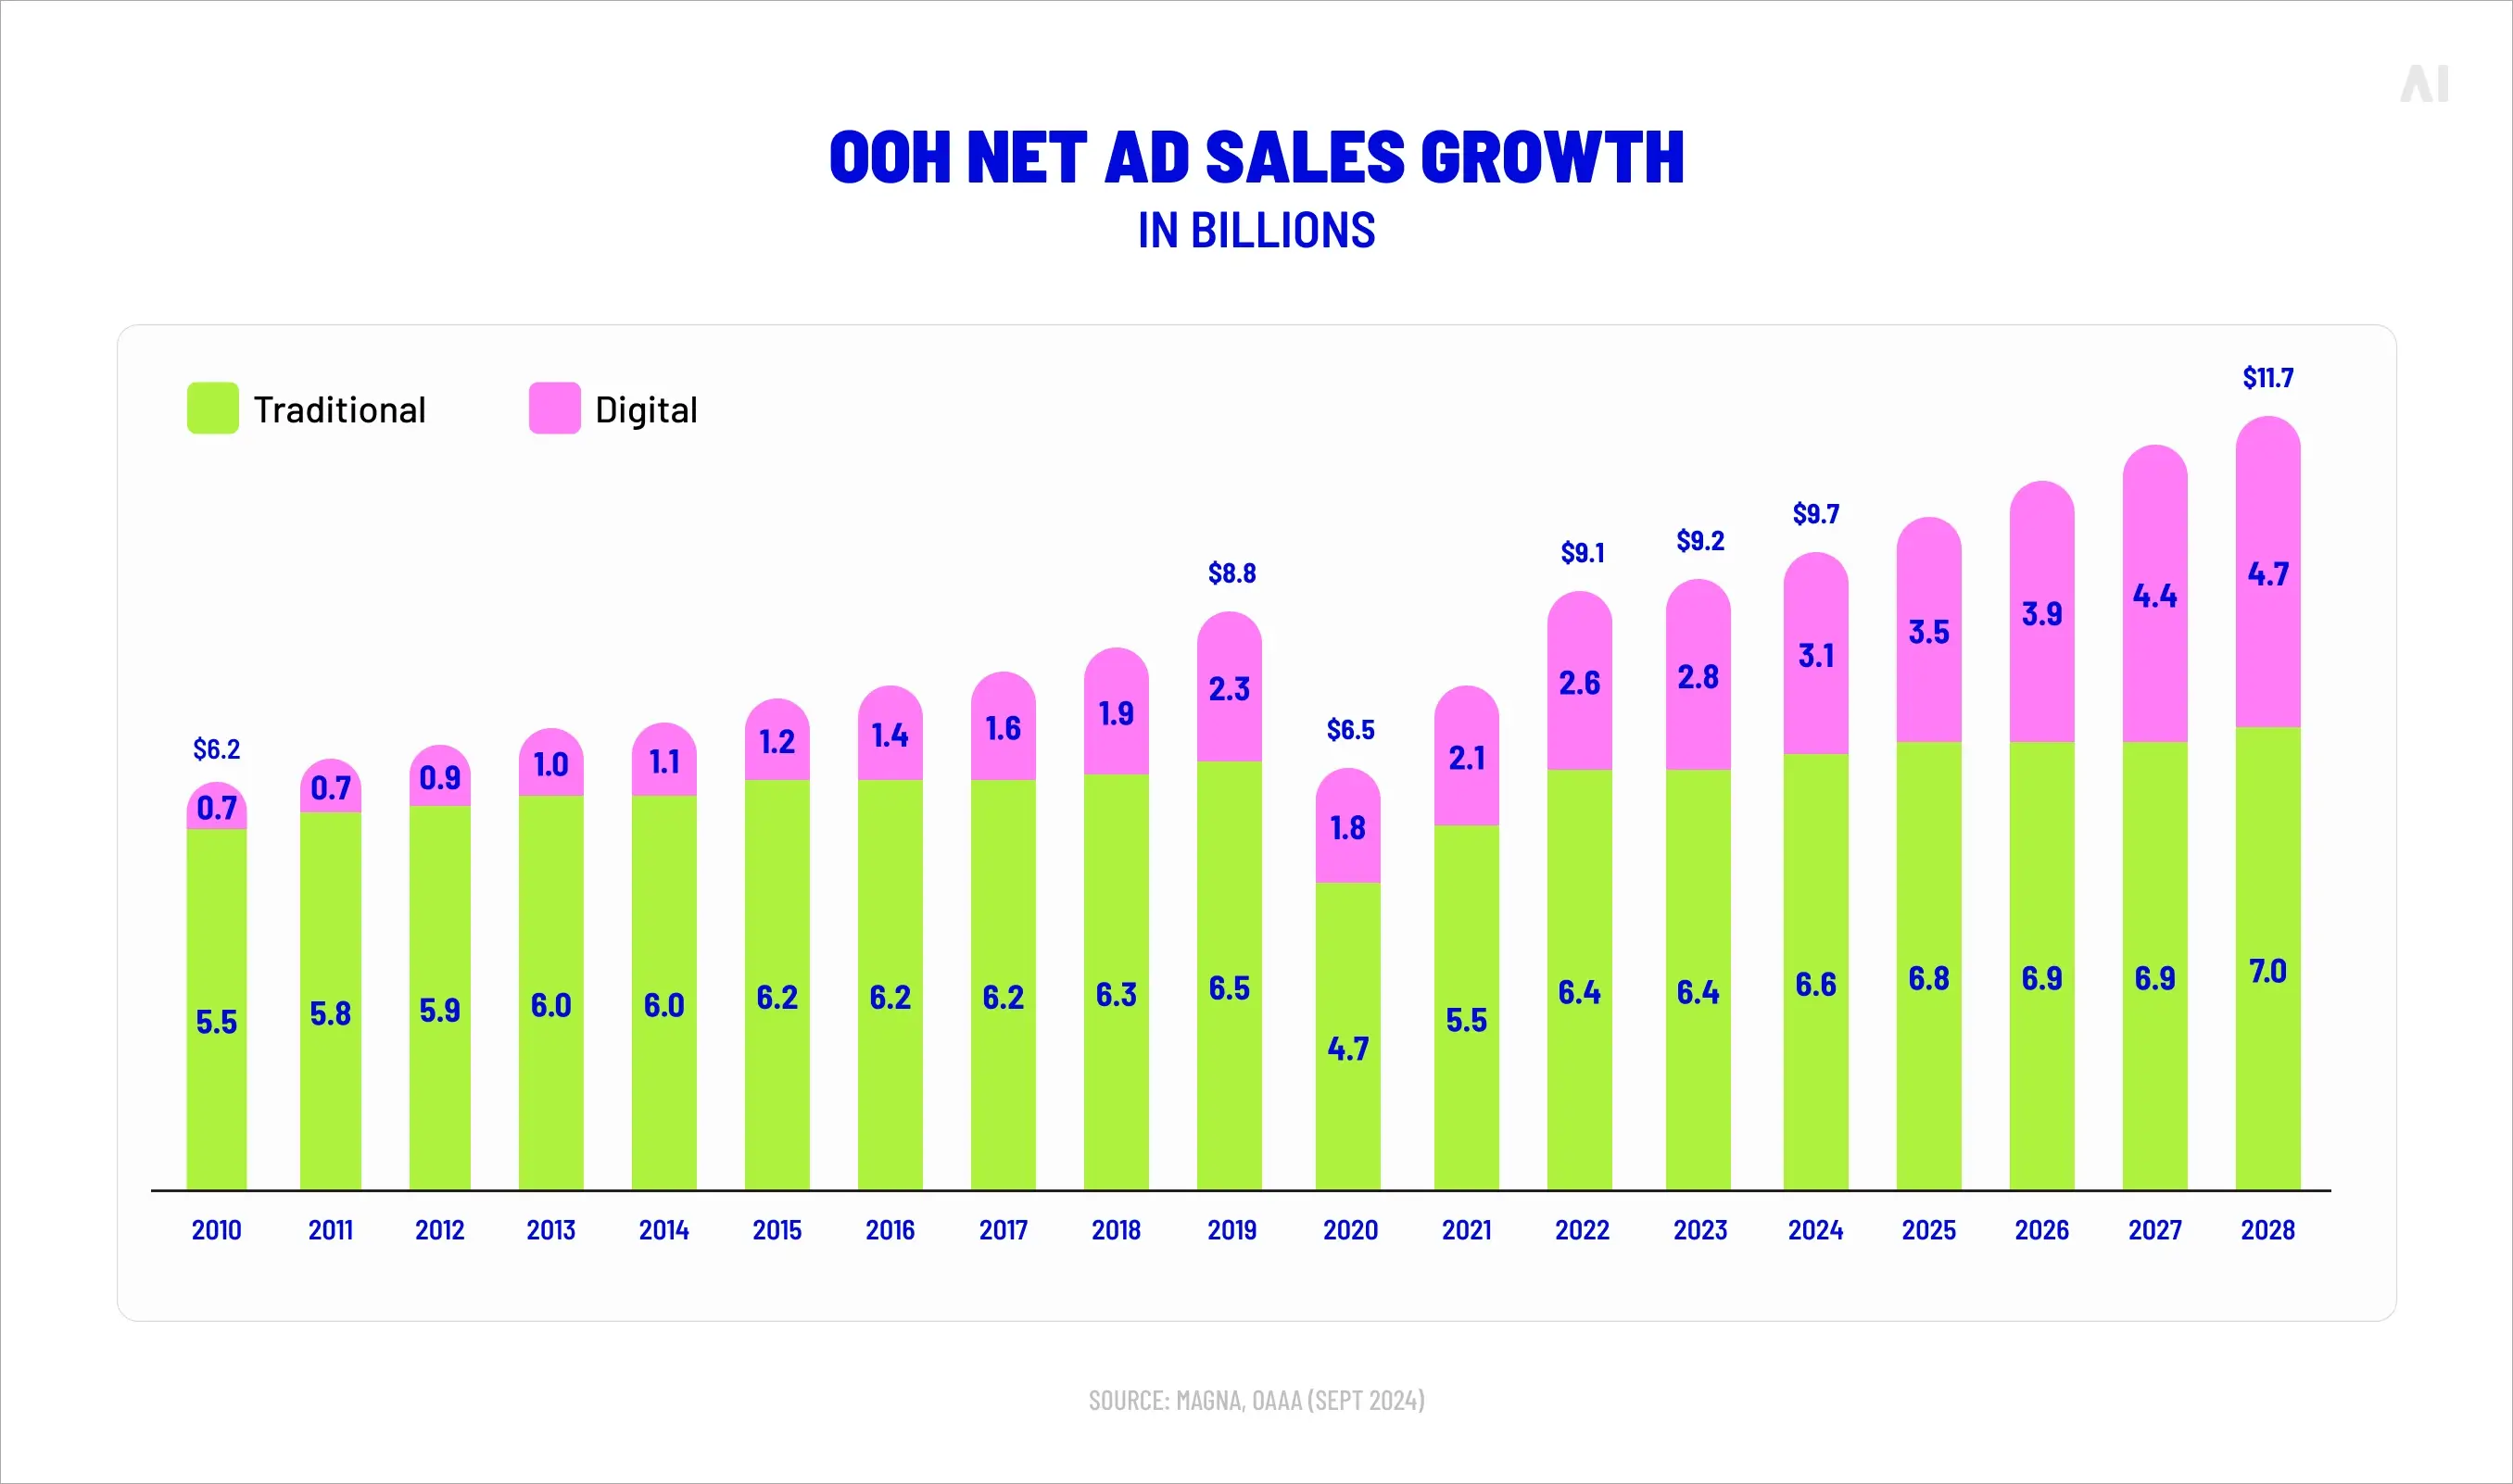
OOH net ad sales growth (traditional vs digital, 2010–2028; Source)
📍 A practical monetization tip: treat your network like a portfolio. Define a small set of inventory products that make buying easy, then offer custom packages only when there’s real incremental value.
A simple starting product set (easy for buyers, manageable for operators):
Always-on reach package (steady pacing across all screens)
Targeting in digital signage networks looks different from cookie-based digital advertising. It’s grounded in place, time, and context. That can be a strength because it forces you to define why the environment matters.
⚡ Personalization works best when it’s built on a small number of repeatable packages. If every campaign needs a bespoke screen list and custom rules, your network becomes expensive to operate and hard to scale.
Common targeting approaches include:
Location targeting: specific venues, neighborhoods, or screen zones within a venue
Context targeting: weather, local events, store conditions (inventory levels, promotions)
Audience-informed targeting: aggregated insights based on venue patterns or modeled audiences (privacy-safe)
Personalization does not always mean “one-to-one.” In most signage advertising networks, personalization means “right message for this context,” repeated reliably across the screens that share that context.
The operational benefit of a digital signage network is that it reduces friction. Once your inventory, workflows, and delivery systems are standardized, scaling becomes a matter of adding screens and demand, not reinventing how everything works.
Flexibility shows up in day-to-day moments:
Creative swaps without reprinting or reinstalling
Fast updates for pricing changes, promotions, or compliance edits
Rapid response to local conditions (weather shifts, event surges, store-level needs)
Ability to run multiple campaigns across the same screen set without chaos
For advertisers, this means campaigns can be adjusted mid-flight. For media owners, it means fewer manual interventions and fewer “sorry, we can’t do that” conversations.
Performance measurement and insights
Measurement is one of the main reasons advertisers treat digital signage advertising as a serious channel rather than a brand-only experiment. But measurement needs discipline to be credible.
Attribution options where appropriate (store visit lift, site search lift, sales correlations)
Industry standards are also tightening. In December 2025, the Media Rating Council published final out-of-home measurement standards (combined phases), outlining requirements and guidance for metrics and methodology, including concepts like rendered impressions, viewability, and the need for disclosure around methodology and limitations.
This is a useful shift for buyers and sellers. It pushes networks to be more transparent about how they calculate performance, what “impressions” mean in physical spaces, and where uncertainty still exists.
Advanced capabilities of modern digital signage networks
Once the basics are stable (inventory definition, delivery reliability, proof-of-play), “advanced” stops meaning flashy tech and starts meaning better control. You’re no longer simply buying or selling screens. You’re buying or selling rules: where an ad is eligible to run, when it should run, and what version of the message makes sense in that moment.
These capabilities tend to matter most when you’re competing for larger budgets, plugging DOOH into omnichannel planning, or trying to prove that performance moves with context, not just spend.
Location-based targeting
Location-based targeting in signage networks is not just “choose the city.” It’s how you slice the screen estate so the environment does more of the work for you.
At the network level, location targeting often happens at the screen-cluster level:
Store format (flagship vs neighborhood)
Placement type (entrance, checkout, aisle endcap, waiting area)
Audience flow (fast-moving corridors vs dwell-heavy zones)
⚡ Targeting fails when “where it can run” is vague. Tight eligibility rules (venue type, placement, daypart, restrictions) keep campaigns clean—and keep your sales team from selling what ops can’t deliver.
A mature network treats location as a signal in two ways:
Operational signal: what screens are available, healthy, and eligible right now (including any brand restrictions).
Strategic signal: what environments match campaign intent (high intent, high dwell, high repeat exposure, proximity to purchase).
In a Broadsign case study, telehealth brand Wisp ran programmatic DOOH across 2,839 screens in the New York DMA, mixing large-format for reach with panels near high-traffic areas and in-pharmacy screens for “high intent” moments. The campaign reported a 4× lift in brand preference vs. top competitors and a +107% lift in purchase consideration—a useful illustration of why “where on the journey” can matter as much as “how many screens.”
📍 Practical setup tip: if you want location targeting to scale, don’t rely on tribal knowledge (“those screens are good”). Tag screens consistently (venue type, placement type, audience flow, nearby POIs). That tagging becomes the foundation for packages, PMPs, and reporting.
Time-based scheduling is a workhorse feature. It’s simple, but it changes results because human behavior changes by hour and day. A coffee message at 8:30 a.m. is not the same as a coffee message at 3:00 p.m.
Contextual scheduling goes further by connecting creative to conditions such as:
Weather (hot drink vs cold drink creative, indoor vs outdoor activity)
Local events (sports games, concerts, conferences)
Store conditions (inventory status, promotions, queue length where available)
Transit context (commuter peaks vs off-peak)
The business advantage is relevance without personal data. You’re matching message to moment.
Sprite’s 2025 “Turn Up Refreshment” campaign usedreal-time data to drive contextual out-of-home placements, combining geo-location with weather/temperature signals to deploy digital creative “when and where people are feeling the heat.” That’s contextual scheduling in plain terms: the ad is eligible only when conditions match the promise.
How this works in practice (without making ops miserable):
You pre-approve a small set of creative variants (hot / mild / fallback).
You define trigger rules (temperature threshold, time window, venue eligibility).
You keep a “default” creative ready, so the campaign still delivers when triggers aren’t met.
Audience targeting in digital signage networks typically relies on aggregated insights rather than individual identity. It can include:
Venue-based audience profiles (who typically visits, when, and for how long)
Modeled segments (built from third-party or first-party patterns)
Performance learnings (which venue clusters consistently drive lift for certain categories)
The best use of this capability is not to claim precision you can’t support. It’s to make planning smarter: choose the right environments, set realistic expectations, then validate with measurement.
Intimissimi worked with Blindspot on a data-driven DOOH effort across major U.S. cities (including New York and Los Angeles), using mobile-location insights to target shoppers likely to visit, and a test-and-control methodology to isolate impact. The case study reports a +53.55% lift in foot traffic among exposed audiences compared to control—an example of audience targeting paired with a measurement design that buyers can actually interrogate.
What this implies for network operators: you need more than a segment label. You need the ability to explain:
what the segment represents (behavioral patterns, not personal identity),
where it’s likely to be present (venue types, dayparts),
and how performance was validated (control design, holdout logic, incrementality framing).
Place Exchange’s H1 2025 trends (shared via OAAA) show programmatic OOH activity spreading across venue types and deal mechanisms. On that platform, private marketplace deals represented 96% of spend, and the number of programmatic screens available grew 16% from H2 2024 to H1 2025—growth driven primarily by new inventory in entertainment, retail, and health locations. That combination (more curated supply + more diverse venues) is a big enabler for audience-based planning.
Dynamic content optimization
Dynamic content optimization (DCO) in digital signage networks often means creative that updates based on data feeds or rules. It’s not “swap the file mid-campaign.” It’s “serve the right approved version when conditions change.”
Typical DCO patterns include:
Price or offer updates pulled from a product feed
Countdown creative for limited-time promotions
Location-specific messaging (“Available in this store today”)
Creative rotation based on response signals (where available)
What DCO changes operationally: you stop building 40 separate creatives for 40 scenarios. You build one modular template with controlled fields (headline, offer, location line, CTA), then govern it with rules and approvals. That usually lowers production overhead while increasing relevance—assuming you’ve done the setup work (data feed quality, fallback logic, approval workflows).
Broadsign’s programmatic DOOH overview describes how campaigns can combine contextual and aggregated signals (time of day, location/environment, weather, events) with dynamic activation and DCO so different approved variants can run based on real-world conditions rather than one static message. The same overview highlights Visit Arizona using programmatic DOOH paired with mobile retargeting and arrival-based measurement and reporting a 30% lift in arrivals.
⚡ A screen network turns location into a media signal and measurement into the differentiator.
Key challenges in operating digital signage networks
None of these challenges are deal-breakers. They’re simply the realities you need to plan for if you want a digital signage advertising network that is scalable, sellable, and credible.
Infrastructure scaling
Scaling screens is not linear. Going from 10 to 100 screens is a different game than going from 1,000 to 10,000.
As networks grow, the main pressure points tend to be:
Device provisioning and lifecycle management
Replacement cycles and hardware standardization
Monitoring volume (alerts can become noise if not managed well)
Service models (who fixes what, and how fast)
A practical mitigation is to treat operations as a product. Define service tiers, uptime expectations, and escalation paths, then align your sales promises to what your ops team can actually deliver.
Content management at scale
Content complexity grows faster than screen count.
Even simple networks run into:
Too many versions (formats, durations, localized variants)
Playlist conflicts (house content vs paid campaigns vs emergency messages)
Creative fatigue (the same ad running too often in a dwell-heavy zone)
One useful discipline is to standardize creative templates and inventory products early. That way, the system shapes the work instead of every campaign creating a new exception.
Connectivity and playback reliability
Connectivity issues rarely show up in sales conversations, but they show up in campaign delivery.
⚡ Every offline hour is unsellable inventory and a reporting headache. Treat uptime like yield: monitor it, quantify it, and build make-goods into the operating model so issues don’t become arguments.
Common failure modes include:
Weak Wi-Fi in venues that were never designed for media delivery
Video file sizes that overwhelm bandwidth
Players that fall behind on updates
Screens that keep playing an old playlist because they can’t sync
The operational solution is a mix of caching, monitoring, and clear make-good policies. Buyers do not expect perfection. They do expect transparency and accountability when issues happen.
Measuring campaign performance accurately
Measurement is where optimism can become overstatement if you’re not careful.
In physical environments, impressions are often modeled. That’s fine, as long as you are clear about:
What you measure directly (proof-of-play, device status)
What you estimate (audience exposure, reach, frequency)
What assumptions you use (traffic counts, dwell time, visibility factors)
What the limitations are (obstruction, multi-person viewing, repeat exposure)
⚡ Start with what you can prove (playback logs and pacing). Then layer audience models and outcomes on top—clearly labeled—so buyers understand what’s measured, what’s estimated, and what’s inferred.
The MRC standards (mentioned earlier) emphasize disclosure and methodological rigor for out-of-home measurement, including definitions and guidance around metrics such as rendered impressions and viewability concepts. You don’t need to be “perfect” to be credible, but you do need to be consistent and transparent.
Hierarchy of OOH measurement” diagram, MRC (Source)
How to choose the right digital signage ads network
Choosing a digital signage advertising network is rarely about one feature. It’s about whether the system fits your business model and whether you can operate it day to day without hidden costs (extra labour, downtime, make-goods, and constant “manual fixes” that don’t show up in the demo).
Technology and integration
Start by mapping your current environment:
Do you already have a CMS for digital signage, and is it stable across all locations?
Do you need advertising functionality, or do you already have an ad server (or a selling workflow) you want to keep?
Do you plan to sell direct only, or do you want programmatic demand as a fill layer?
What reporting do buyers expect (proof-of-play, impression models, verification options), and how frequently do they need it?
Then evaluate integration points. The goal is not “more integrations.” It’s fewer handoffs and fewer places where delivery can break:
CMS and ad server interoperability (slot logic, scheduling rules, reporting hooks)
Data and measurement integrations (traffic feeds, attribution partners, dashboards)
APIs for automation (campaign trafficking, creative updates, device reporting)
A simple litmus test: if you can’t explain, in one sentence, what system is responsible for scheduling, what system is responsible for decisioning, and what system is responsible for verification, you’re likely buying overlap.
Here’s a decision checklist you can use in vendor conversations.
How does the platform verify playback and handle missed delivery (automatic make-goods, re-pacing, alerts)?
What reporting is available by screen, venue, and time window, and can we export it cleanly?
How are impressions calculated, and what inputs are used (traffic counts, dwell models, venue data)?
Can we define inventory products consistently (dayparts, packages, screen clusters) without rebuilding schedules each time?
How does the system manage creative approvals and version control (who can publish, who can override locally)?
What happens when a screen goes offline for 24 hours, and how do we prove delivery recovery?
Can the network support both direct and programmatic without conflicting rules (share of voice, category exclusivity, pacing)?
What security controls exist for devices and user access (SSO, role-based permissions, device authentication)?
A strong vendor will answer these without evasiveness. They’ll also explain what their system does not do, which is often more valuable than a long feature list.
Scalability and costs structure
Most networks underestimate cost structure because they focus on screens, not operations. The hidden costs usually show up as “small” recurring work: troubleshooting, chasing files, fixing schedules, and handling campaign exceptions.
Sales costs (if you sell direct, you will have sales overhead)
The best way to keep scalability predictable is to define a unit economics model: revenue per screen (or per venue) minus operating cost per screen (or per venue). If you can’t model that, scaling becomes guesswork. Even a rough model helps you spot where margin disappears (for example, when “cheap” hardware leads to frequent site visits).
Vendor vs. in-house management
Some organizations want full control and build in-house. Others outsource operations to specialists. Many choose a hybrid: keep strategy and sales internal, outsource parts of technical operations or programmatic plumbing.
A helpful way to decide is to look at what you want to own:
Own the inventory and relationships (usually yes)
Own the data and reporting logic (often yes, especially for private networks)
Own the operational burden (depends on resources and appetite)
Own the programmatic stack (often better to partner, unless you have deep expertise)
In-house can be powerful, but it requires sustained discipline: documentation, governance, and someone accountable for uptime and delivery. Vendor-led can be faster, but you need clarity on control (who can change schedules), transparency (how delivery is measured), and long-term cost (what happens as screens and campaigns scale).
Conclusion: make every screen count with digital signage networks
Digital signage advertising networks turn physical screens into a real media asset because they add the missing layers that advertisers care about: standardized inventory, controlled delivery, and verifiable reporting. When those pieces are in place, screen time stops being “content space” and becomes something you can package, sell, optimize, and defend in a media plan—across one location or thousands.
From a business perspective, the upside is clear. You gain new revenue from direct deals, sponsorships, and programmatic fill. You get more precise targeting by using place, time, and context as signals (not cookies). And you unlock performance visibility through proof-of-play, pacing, and measurement frameworks that make results easier to explain and easier to improve.
If you’re deciding what to build or buy, keep it simple: prioritize operational reliability first (uptime, monitoring, playback verification), then scale with better packaging (screen clusters, dayparts, deal types), and only then lean into advanced features like contextual triggers and dynamic creative. If you want support planning, activating, and optimizing DOOH and programmatic efforts within a transparent model—AI Digital can help through managed service execution, supply curation, and platform-led intelligence.
Blind spot
Key issues
Business impact
AI Digital solution
Lack of transparency in AI models
• Platforms own AI models and train on proprietary data • Brands have little visibility into decision-making • "Walled gardens" restrict data access
• Inefficient ad spend • Limited strategic control • Eroded consumer trust • Potential budget mismanagement
Open Garden framework providing: • Complete transparency • DSP-agnostic execution • Cross-platform data & insights
Optimizing ads vs. optimizing impact
• AI excels at short-term metrics but may struggle with brand building • Consumers can detect AI-generated content • Efficiency might come at cost of authenticity
• Short-term gains at expense of brand health • Potential loss of authentic connection • Reduced effectiveness in storytelling
Smart Supply offering: • Human oversight of AI recommendations • Custom KPI alignment beyond clicks • Brand-safe inventory verification
The illusion of personalization
• Segment optimization rebranded as personalization • First-party data infrastructure challenges • Personalization vs. surveillance concerns
• Potential mismatch between promise and reality • Privacy concerns affecting consumer trust • Cost barriers for smaller businesses
Elevate platform features: • Real-time AI + human intelligence • First-party data activation • Ethical personalization strategies
AI-Driven efficiency vs. decision-making
• AI shifting from tool to decision-maker • Black box optimization like Google Performance Max • Human oversight limitations
• Strategic control loss • Difficulty questioning AI outputs • Inability to measure granular impact • Potential brand damage from mistakes
Managed Service with: • Human strategists overseeing AI • Custom KPI optimization • Complete campaign transparency
Fig. 1. Summary of AI blind spots in advertising
Dimension
Walled garden advantage
Walled garden limitation
Strategic impact
Audience access
Massive, engaged user bases
Limited visibility beyond platform
Reach without understanding
Data control
Sophisticated targeting tools
Data remains siloed within platform
Fragmented customer view
Measurement
Detailed in-platform metrics
Inconsistent cross-platform standards
Difficult performance comparison
Intelligence
Platform-specific insights
Limited data portability
Restricted strategic learning
Optimization
Powerful automated tools
Black-box algorithms
Reduced marketer control
Fig. 2. Strategic trade-offs in walled garden advertising.
Core issue
Platform priority
Walled garden limitation
Real-world example
Attribution opacity
Claiming maximum credit for conversions
Limited visibility into true conversion paths
Meta and TikTok's conflicting attribution models after iOS privacy updates
Data restrictions
Maintaining proprietary data control
Inability to combine platform data with other sources
Amazon DSP's limitations on detailed performance data exports
Cross-channel blindspots
Keeping advertisers within ecosystem
Fragmented view of customer journey
YouTube/DV360 campaigns lacking integration with non-Google platforms
Black box algorithms
Optimizing for platform revenue
Reduced control over campaign execution
Self-serve platforms using opaque ML models with little advertiser input
Performance reporting
Presenting platform in best light
Discrepancies between platform-reported and independently measured results
Consistently higher performance metrics in platform reports vs. third-party measurement
Fig. 1. The Walled garden misalignment: Platform interests vs. advertiser needs.
Key dimension
Challenge
Strategic imperative
ROAS volatility
Softer returns across digital channels
Shift from soft KPIs to measurable revenue impact
Media planning
Static plans no longer effective
Develop agile, modular approaches adaptable to changing conditions
Brand/performance
Traditional division dissolving
Create full-funnel strategies balancing long-term equity with short-term conversion
Capability
Key features
Benefits
Performance data
Elevate forecasting tool
• Vertical-specific insights • Historical data from past economic turbulence • "Cascade planning" functionality • Real-time adaptation
• Provides agility to adjust campaign strategy based on performance • Shows which media channels work best to drive efficient and effective performance • Confident budget reallocation • Reduces reaction time to market shifts
• Dataset from 10,000+ campaigns • Cuts response time from weeks to minutes
• Reaches people most likely to buy • Avoids wasted impressions and budgets on poor-performing placements • Context-aligned messaging
• 25+ billion bid requests analyzed daily • 18% improvement in working media efficiency • 26% increase in engagement during recessions
Full-funnel accountability
• Links awareness campaigns to lower funnel outcomes • Tests if ads actually drive new business • Measures brand perception changes • "Ask Elevate" AI Chat Assistant
• Upper-funnel to outcome connection • Sentiment shift tracking • Personalized messaging • Helps balance immediate sales vs. long-term brand building
• Natural language data queries • True business impact measurement
Open Garden approach
• Cross-platform and channel planning • Not locked into specific platforms • Unified cross-platform reach • Shows exactly where money is spent
• Reduces complexity across channels • Performance-based ad placement • Rapid budget reallocation • Eliminates platform-specific commitments and provides platform-based optimization and agility
• Coverage across all inventory sources • Provides full visibility into spending • Avoids the inability to pivot across platform as you’re not in a singular platform
Fig. 1. How AI Digital helps during economic uncertainty.
Trend
What it means for marketers
Supply & demand lines are blurring
Platforms from Google (P-Max) to Microsoft are merging optimization and inventory in one opaque box. Expect more bundled “best available” media where the algorithm, not the trader, decides channel and publisher mix.
Walled gardens get taller
Microsoft’s O&O set now spans Bing, Xbox, Outlook, Edge and LinkedIn, which just launched revenue-sharing video programs to lure creators and ad dollars. (Business Insider)
Retail & commerce media shape strategy
Microsoft’s Curate lets retailers and data owners package first-party segments, an echo of Amazon’s and Walmart’s approaches. Agencies must master seller-defined audiences as well as buyer-side tactics.
AI oversight becomes critical
Closed AI bidding means fewer levers for traders. Independent verification, incrementality testing and commercial guardrails rise in importance.
Fig. 1. Platform trends and their implications.
Metric
Connected TV (CTV)
Linear TV
Video Completion Rate
94.5%
70%
Purchase Rate After Ad
23%
12%
Ad Attention Rate
57% (prefer CTV ads)
54.5%
Viewer Reach (U.S.)
85% of households
228 million viewers
Retail Media Trends 2025
Access Complete consumer behaviour analyses and competitor benchmarks.
Identify and categorize audience groups based on behaviors, preferences, and characteristics
Michaels Stores: Implemented a genAI platform that increased email personalization from 20% to 95%, leading to a 41% boost in SMS click through rates and a 25% increase in engagement.
Estée Lauder: Partnered with Google Cloud to leverage genAI technologies for real-time consumer feedback monitoring and analyzing consumer sentiment across various channels.
High
Medium
Automated ad campaigns
Automate ad creation, placement, and optimization across various platforms
Showmax: Partnered with AI firms toautomate ad creation and testing, reducing production time by 70% while streamlining their quality assurance process.
Headway: Employed AI tools for ad creation and optimization, boosting performance by 40% and reaching 3.3 billion impressions while incorporating AI-generated content in 20% of their paid campaigns.
High
High
Brand sentiment tracking
Monitor and analyze public opinion about a brand across multiple channels in real time
L’Oréal: Analyzed millions of online comments, images, and videos to identify potential product innovation opportunities, effectively tracking brand sentiment and consumer trends.
Kellogg Company: Used AI to scan trending recipes featuring cereal, leveraging this data to launch targeted social campaigns that capitalize on positive brand sentiment and culinary trends.
High
Low
Campaign strategy optimization
Analyze data to predict optimal campaign approaches, channels, and timing
DoorDash: Leveraged Google’s AI-powered Demand Gen tool, which boosted its conversion rate by 15 times and improved cost per action efficiency by 50% compared with previous campaigns.
Kitsch: Employed Meta’s Advantage+ shopping campaigns with AI-powered tools to optimize campaigns, identifying and delivering top-performing ads to high-value consumers.
High
High
Content strategy
Generate content ideas, predict performance, and optimize distribution strategies
JPMorgan Chase: Collaborated with Persado to develop LLMs for marketing copy, achieving up to 450% higher clickthrough rates compared with human-written ads in pilot tests.
Hotel Chocolat: Employed genAI for concept development and production of its Velvetiser TV ad, which earned the highest-ever System1 score for adomestic appliance commercial.
High
High
Personalization strategy development
Create tailored messaging and experiences for consumers at scale
Stitch Fix: Uses genAI to help stylists interpret customer feedback and provide product recommendations, effectively personalizing shopping experiences.
Instacart: Uses genAI to offer customers personalized recipes, mealplanning ideas, and shopping lists based on individual preferences and habits.
Medium
Medium
Share article
Url copied to clipboard
No items found.
Subscribe to our Newsletter
THANK YOU FOR YOUR SUBSCRIPTION
Oops! Something went wrong while submitting the form.
Questions? We have answers
What industries benefit most from digital signage advertising networks?
Industries that control repeat footfall and high-visibility environments tend to benefit first—retail and retail media, transit, convenience/QSR, gyms and fitness, hospitality, healthcare waiting areas, universities and campuses, and office and residential property groups. They can package inventory across locations, sell dayparts or venue clusters, and deliver campaigns in moments that align with intent (commute, browse, queue, waiting).
How long does it take to launch a digital signage advertising network?
If screens and a stable CMS are already in place, a basic network can be monetized in a few weeks once inventory definitions, creative specs, approval workflows, and proof-of-play reporting are set. Multi-location launches take longer because standardizing hardware, connectivity, monitoring, and support processes is usually the real gating factor, not the ad product itself.
Can small businesses use digital signage advertising networks?
Yes, but the simplest model works best. A single-location operator can sell a small number of sponsorship slots to local partners, keep creative rules tight, and provide clear proof-of-play reporting. The goal is predictable local revenue and better in-venue messaging, not programmatic scale on day one.
How is performance measured in DOOH campaigns?
DOOH measurement usually combines what can be confirmed directly—what played, where, and when—with modeled metrics such as impressions, reach, and frequency based on audience and traffic inputs. Where available, campaigns can add outcome measurement like store visit lift or brand search lift, ideally using a control/holdout approach so results are directional but credible.
How is ad performance measured on digital signage networks?
Performance on digital signage networks typically starts with delivery and compliance reporting (proof-of-play, pacing, uptime), then moves to audience estimates and comparisons by location cluster, daypart, and creative version. More advanced programs layer in verification, brand lift studies, or footfall attribution to connect exposure to outcomes, while being clear about what’s measured directly versus modeled.
Can businesses verify that ads are displayed correctly?
Yes. Most networks provide proof-of-play logs from the player or CMS, plus health monitoring that confirms screens were online and schedules were applied. For higher-stakes buys, verification can be strengthened with screenshots, audit trails, third-party verification partners, and clear make-good rules for any missed delivery.
Have other questions?
If you have more questions, contact us so we can help.

.svg)
.svg)


_%20How%20It%20Works%20%26%20How%20to%20Drive%20Real%20Performance.webp)