
.webp)
Marketers have never had more data: impressions, sessions, view-through rates, dashboards refreshing by the minute. What most teams lack is a dependable way to tie that activity to revenue and profit. Fragmented attribution, incomplete cost tracking, and inconsistent measurement leave marketing ROI measured in pieces that never quite reconcile.
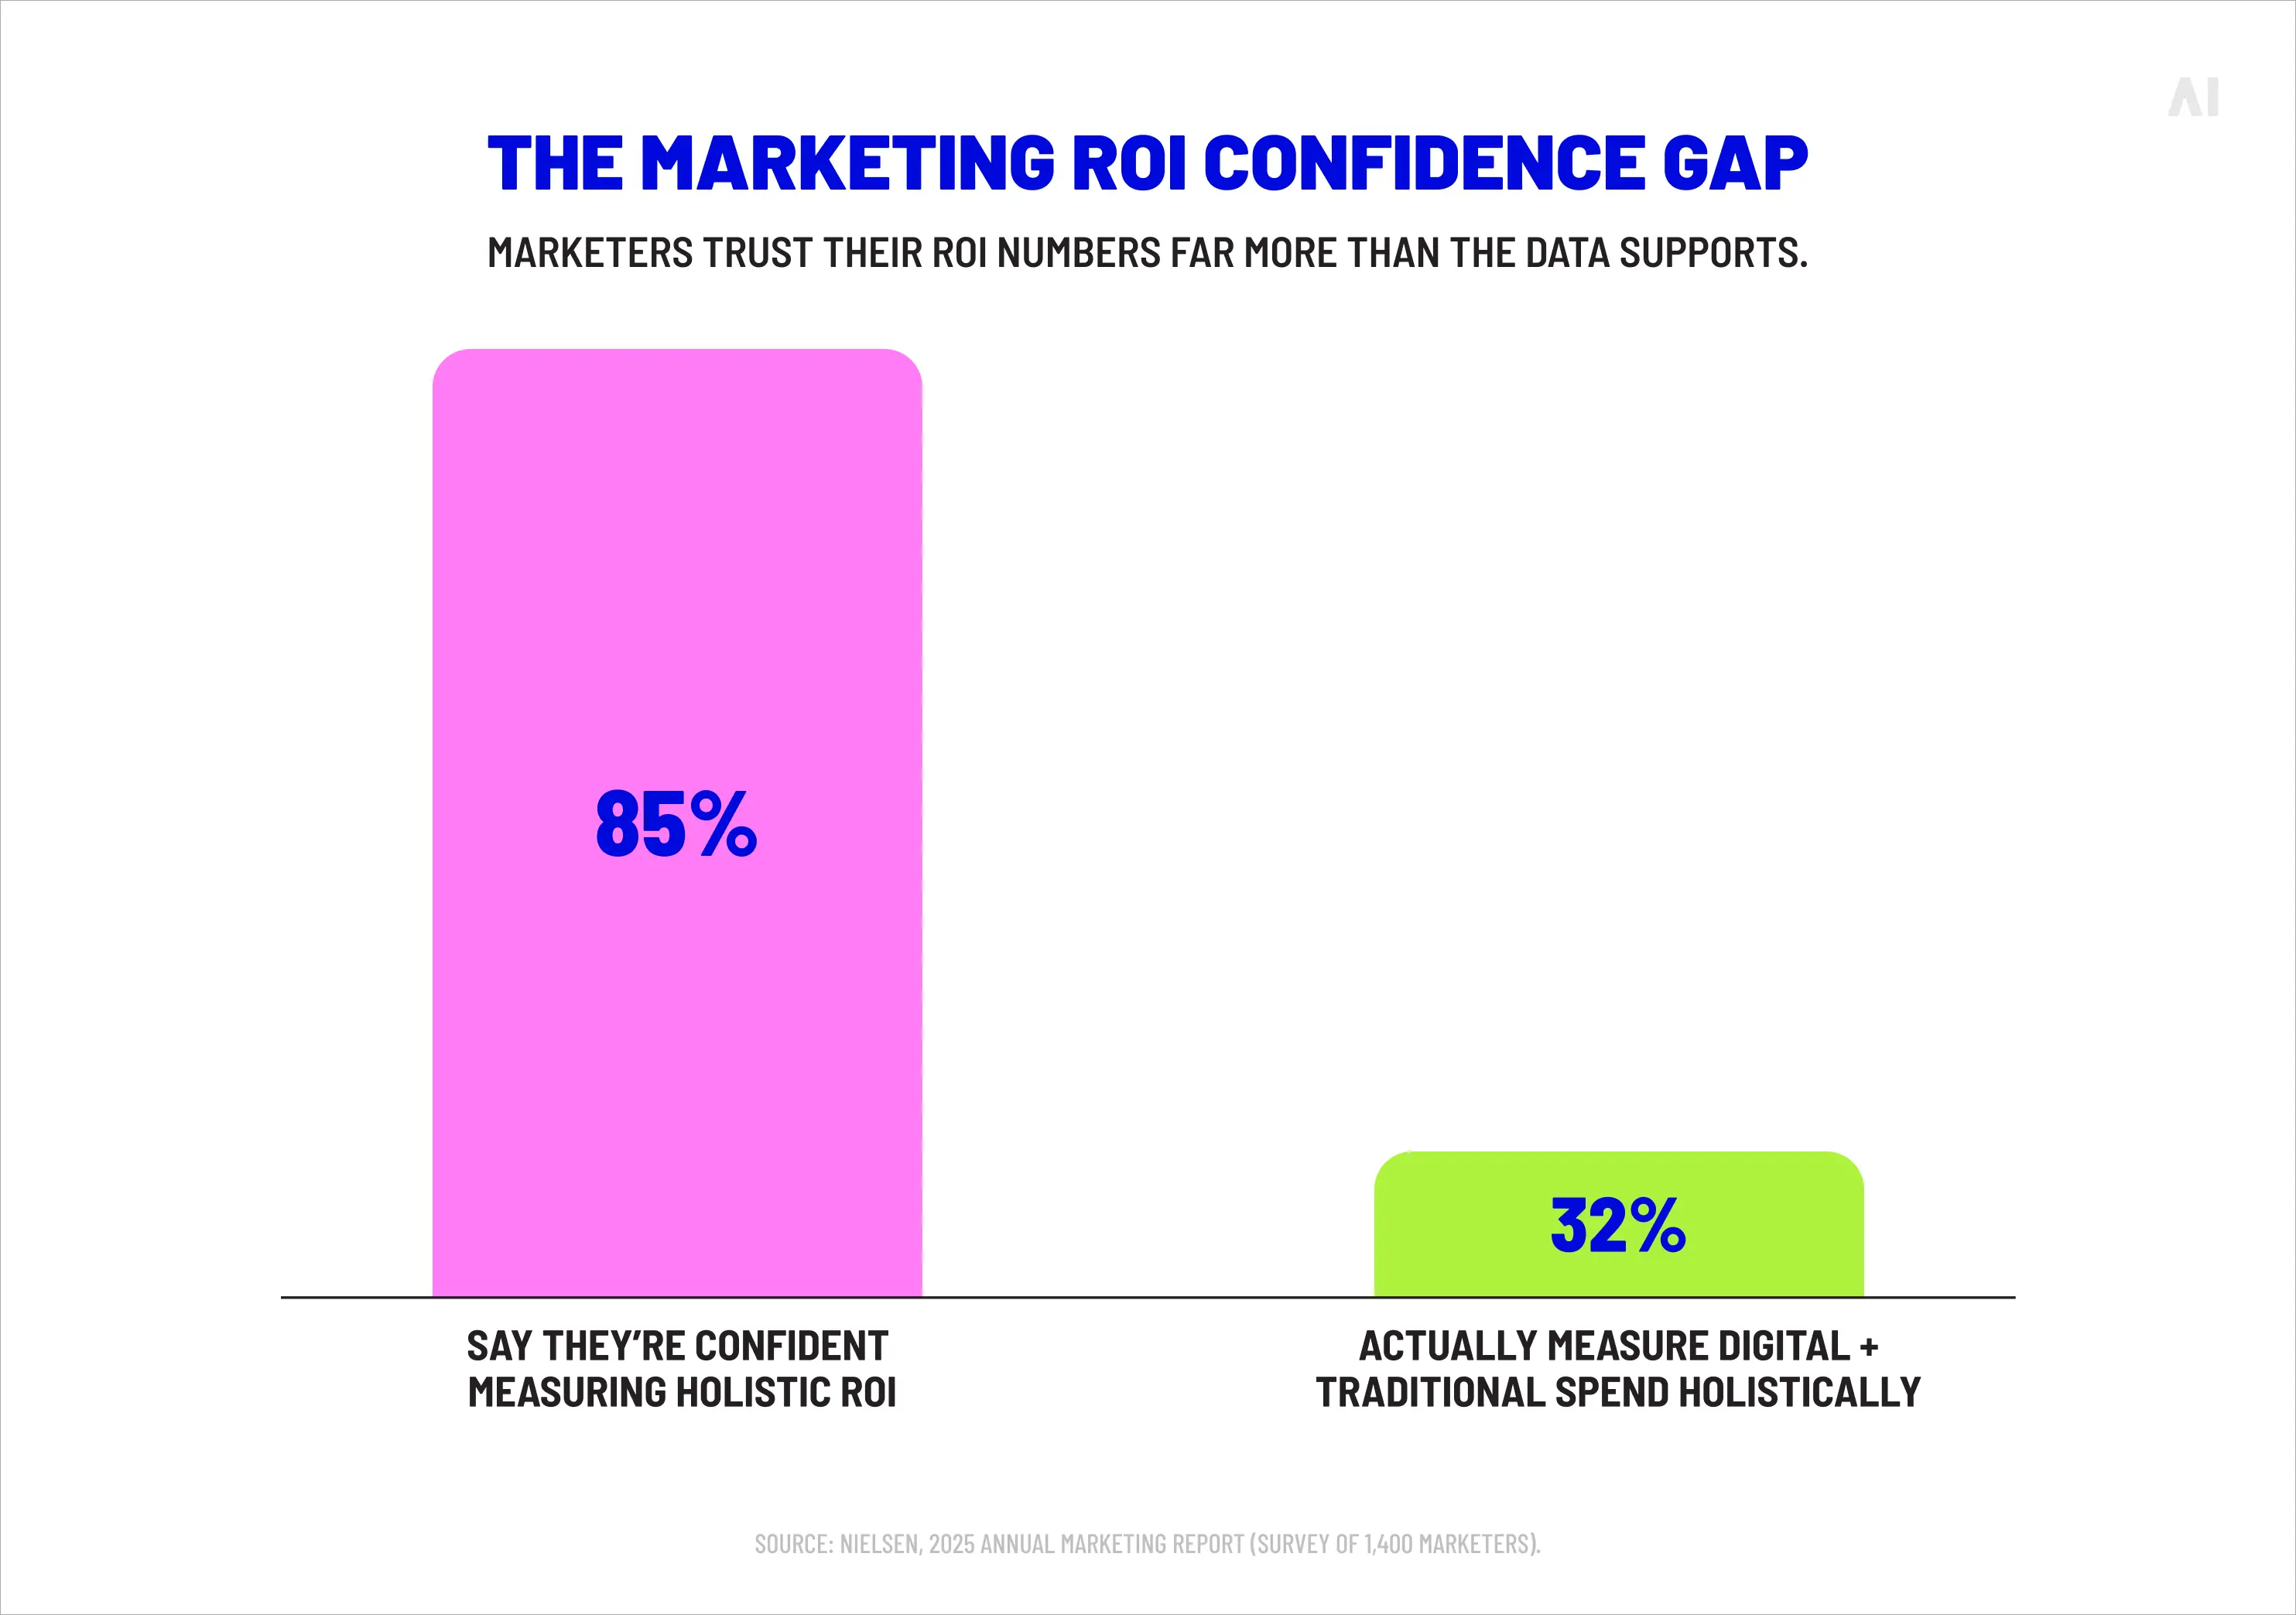
The research bears this out. In Nielsen's 2025 Annual Marketing Report, 85% of marketers said they were confident in their ability to measure holistic ROI—while only 32% measured their digital and traditional spend in a truly holistic way. Confidence runs well ahead of capability.
This guide is built to close that gap. It covers the marketing ROI formula and how to apply it without flattering the result, real calculation examples by channel, what a good return looks like, and the structural factors that make calculating ROI on marketing spend harder than the arithmetic suggests.
What is marketing ROI, and why it counts
Marketing ROI is the profit generated by marketing, expressed as a return on what you spent to generate it. It answers the question finance actually asks: for every dollar put into marketing, how many came back?
Businesses use it for three jobs—
- deciding where budget goes,
- judging which campaigns earned their keep, and
- proving marketing's contribution to revenue in terms the rest of the C-suite recognizes.
That last job has grown teeth. With budgets under pressure—54% of marketers told Nielsen they planned to cut ad spending—proving return is now the difference between defending a budget and losing it. More than a third rank sales or ROI as their most or second-most important metric, up sharply as boards ask marketing to account for itself like every other line of the P&L.
ROI is not the only number worth watching, and it gets confused with metrics that look similar but answer different questions. Before the formula, it's worth separating the three that most often get used interchangeably.
ROI vs. ROAS vs. revenue attribution
ROI measures profitability, ROAS measures advertising efficiency, and attribution is the method that decides which channel gets credit for a conversion in the first place. Mix them up and you can celebrate a strong ROAS while the campaign underneath it loses money.
Sequence is everything. Attribution comes first, because both ROI and ROAS inherit whatever assumptions the model makes. Pick the wrong model and every number downstream is confidently wrong.
The marketing ROI formula (and how to apply it correctly)
Marketing ROI calculation formula is as follows:
Marketing ROI (%) = (Marketing-attributed revenue − Marketing cost) ÷ Marketing cost × 100
Read the result as a percentage return on what you spent.
- Above 0%, marketing generated more than it cost.
- Below 0%, it lost money.
- At 0%, it broke even.
A marketing ROI of 100% means every dollar returned two—your original dollar plus a dollar of profit on top.
Simple arithmetic, and that's the trap. The formula is only as good as the two numbers you put into it, and both are easy to get wrong in ways that flatter the result.
What to include in your marketing ROI measurement
A marketing ROI calculation is only as honest as its inputs. Most inflated ROI numbers trace back to a thin cost base—teams count the media and forget everything wrapped around it. A complete calculation includes:
- Media spend—the working dollars that buy impressions or clicks.
- Agency and management fees—retainers, commissions, and the overhead of running the work.
- Technology costs—the DSP, analytics, measurement, and martech subscriptions the campaign depends on.
- Creative production—concepting, design, video, and the cost of every version and resize.
- Internal resources—the salaried hours your own team spends planning, trafficking, and reporting.
On the revenue side, the default is marketing-attributed revenue, and two refinements make it far more trustworthy.
- Use gross profit instead of revenue when margins vary, because a high-revenue, low-margin campaign can post a handsome ROI while adding little real profit.
- And where you can isolate it, use incremental revenue—the sales that wouldn't have happened without the campaign—rather than every sale the model happens to touch.
⚡ A marketing ROI calculation is only as honest as the inputs you feed it.
Marketing ROI formula examples
Two campaigns can post identical revenue and very different returns, depending on which inputs you use. Take one campaign, measured two ways.
Revenue-based:
- Marketing cost: $50,000 (media $38K + fees, tools and creative $12K)
- Attributed revenue: $150,000
- ROI = ($150,000 − $50,000) ÷ $50,000 × 100 = 200%
Gross-profit-based (same campaign, 40% gross margin):
- Gross profit on that revenue: $150,000 × 40% = $60,000
- ROI = ($60,000 − $50,000) ÷ $50,000 × 100 = 20%
Same top line, same spend, and a return that falls from a triumphant 200% to a slim 20% once margin enters the math. The revenue-based figure isn't wrong, but for any business that doesn't sell at 100% margin, the gross-profit version is the one to take into a budget meeting. Use revenue-based ROI for quick comparisons between channels with similar margins; use gross-profit ROI whenever you're comparing across categories or deciding where money actually goes.
Calculate marketing ROI in Excel
You don't need a dedicated tool—four cells will do it. Set the spreadsheet up like this:
- B1—Attributed revenue: 150000
- B2—Marketing cost: 50000
- B3—Marketing ROI: =(B1-B2)/B2
Format B3 as a percentage and it returns 200%. To switch to the gross-profit version, add a margin cell and adjust the formula:
- B4—Gross margin %: 40%
- B5—Gross-profit ROI: =((B1*B4)-B2)/B2 → 20%
To recreate it: enter your revenue and cost, divide the difference by cost, format as a percentage, then layer in margin once the basic version works. For one-off checks, a free online marketing ROI calculator does the same job. For anything you'll revisit—monthly reporting, budget planning—a spreadsheet you control beats a black-box calculator, since you can see and adjust every input.
Marketing ROI calculation examples by channel
Toy examples are easy. Real ones are messy, and the mess is where the useful lessons hide. Three enterprise-scale scenarios—programmatic media, content marketing, and a cross-channel campaign—show how the same formula behaves when the inputs get complicated and the attribution gets contested.
Programmatic campaign ROI
Consider a quarter of programmatic display and video: $400,000 in media, plus $60,000 in DSP, verification and data fees, plus $40,000 in creative and management. Total cost, $500,000. The campaign is attributed $1.4 million in revenue.
- Revenue-based ROI = ($1,400,000 − $500,000) ÷ $500,000 = 180%.
- Gross-profit-based ROI (35% margin) = (($1,400,000 × 35%) − $500,000) ÷ $500,000 = −2%.
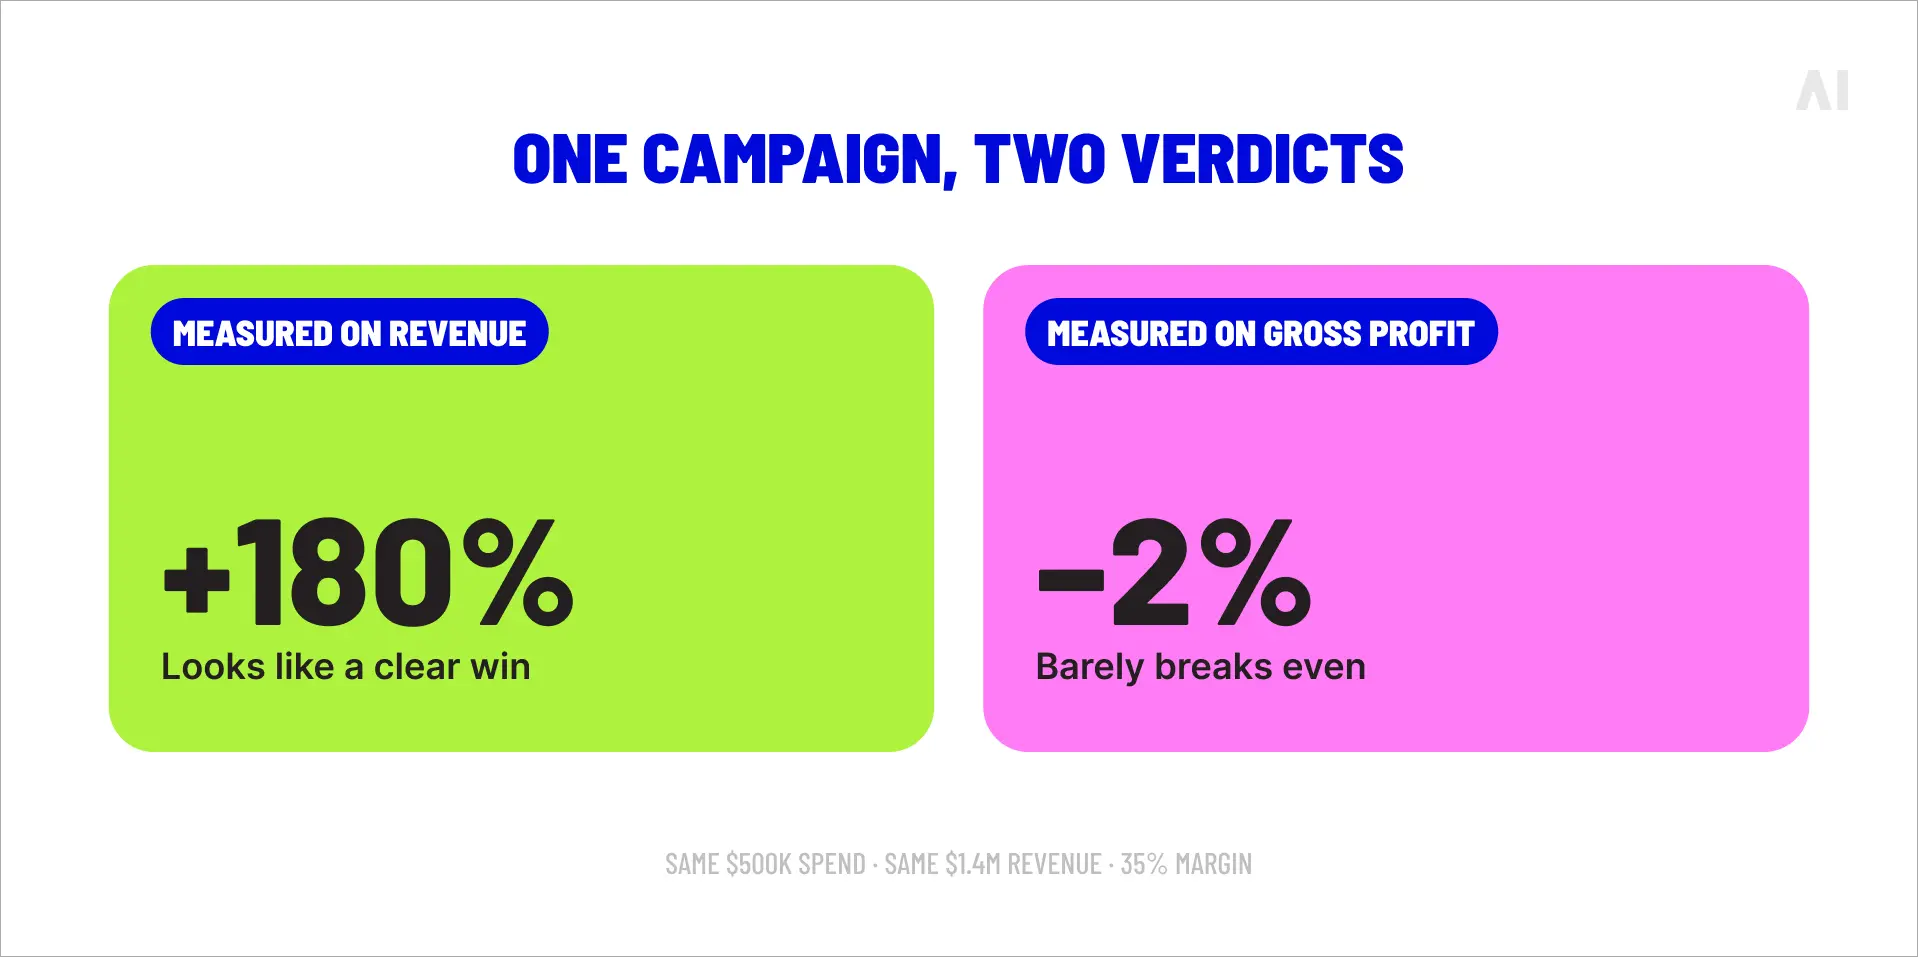
A campaign that looks like a clear winner on revenue barely breaks even on profit. Which number you trust changes the decision entirely—and it gets worse once you ask where the $1.4 million came from. Much of it was likely credited by the platform that sold the media. Every ad platform grades its own homework, and the marks run high. Independent measurement—verified against a control, not the seller's own conversion count—is the only way to know whether that attributed revenue is real or borrowed from channels that would have converted anyway.
Content marketing ROI
Content spreads its costs and its payoff over time, which makes its ROI both harder to calculate and easier to undersell. A year of content might cost $180,000—writing and editing, SEO, design and distribution—against $540,000 in content-influenced revenue, for a headline ROI of 200%. Defensible, but almost certainly conservative.
The problem is timing. Content rarely closes a sale on the first visit; it seeds one that lands weeks or months later. Analytic Partners' ROI Genome finds that roughly two-thirds of advertising's impact registers after the first week—which means any last-click model, measuring only the final touch before conversion, systematically undercounts content's contribution. The blog post that started the journey gets none of the credit the closing email collects. Measure content on last-click alone and you'll defund the very thing that fills the top of your funnel.
The fix is to measure content with a model that can see its early influence—a multi-touch or data-driven approach—or, better, to run an incrementality test that isolates the revenue content genuinely caused. Either way, the headline 200% is a floor, not a ceiling.
Cross-channel campaign ROI
Now combine them. A prospect sees a display ad, later clicks a retargeting unit, searches the brand, and finally converts from an email. Four channels, one sale—and if each platform counts it, four claims on a single conversion. Sum the channel-reported ROIs and you'll "prove" a return the business never earned.
This double-counting is worst inside walled gardens, where each platform measures conversions with its own tools and its own incentives. The ROI Genome puts a number on the leakage: about 30% of paid-search clicks are actually driven by other advertising, much of it video the search platform never credits. The only honest cross-channel ROI comes from measurement that sits above the platforms and de-duplicates their overlapping claims—which is exactly the problem attribution is supposed to solve, and often doesn't.
💡 Related reads: Walled gardens vs. the open internet
What is a good marketing ROI?
The honest answer: it depends, and anyone quoting a universal number is selling something. A "good" marketing ROI shifts with industry, channel, campaign objective, sales-cycle length and business model.
- A brand-awareness push and a bottom-funnel retargeting campaign shouldn't be held to the same return, because they're doing different jobs on different timelines.
- The retargeting campaign harvests demand that already exists and should post a high, fast ROI.
- The awareness campaign creates demand that pays off months later, and judging it on next week's numbers guarantees you'll cut the thing feeding your pipeline.
- A high-margin subscription business and a low-margin retailer can run the identical campaign and reasonably call very different returns a success.
A rough convention holds that a 5:1 revenue-to-cost ratio (a 400% ROI) is strong and 2:1 is often the floor once costs are fully loaded—but treat that as a starting point. The benchmark that matters is your own trend line: this quarter against last, this channel against its own history.
Why marketing ROI benchmarks can mislead
Published benchmarks invite a comparison they can't support. Two "email ROI" figures can differ wildly because one uses last-click and the other multi-touch, one counts a 7-day window and the other 30, one loads in salaries and tools and the other counts media only. You're not comparing performance but methodologies wearing the same label.
The distortion can be enormous. Analytic Partners finds brands overstate some channels' impact by as much as 2–10x once independent measurement strips out borrowed credit. Against that kind of variance, an industry-average benchmark is noise.
Intuition about which channels "win" is often wrong, too. Nielsen's Global Compass benchmarks rank radio second only to social media on global ROI—even though fewer than half of marketers rate it effective—a reminder that a channel's reputation and its real contribution can sit far apart. Build internal benchmarks on consistent inputs, and judge ROI by its direction over time, not against a number scraped from someone else's spreadsheet.
Advanced marketing ROI metrics
The basic formula tells you whether a campaign paid off. It won't tell you whether you're building a profitable business or renting short-term revenue at a loss. Three metrics separate rigorous measurement from surface reporting: the LTV:CAC ratio, blended ROAS, and marketing efficiency ratio.
LTV:CAC ratio
Customer lifetime value (LTV) is the gross profit a customer delivers over the whole relationship. Customer acquisition cost (CAC) is the fully loaded cost of winning them. The ratio between them is the strategic counterweight to single-campaign ROI, because it asks not "did this campaign pay off?" but "are the customers we're buying worth what we pay?"
The widely cited healthy ratio is 3:1, and real-world data sits near it: Benchmarkit's 2025 data puts the median private B2B SaaS LTV:CAC at 3.6:1, while Bessemer's 2026 State of the Cloud puts top-quartile performers at 4:1 to 6:1 with acquisition costs recovered inside a year. (These are SaaS figures; healthy ratios vary by model.)
The strategic trap is that optimizing purely for short-term ROI can quietly starve high-LTV acquisition channels—the ones with slower payback but far better customers—and hollow out long-term profit to flatter this quarter's return.
Blended ROAS vs. channel ROAS
Channel ROAS is what each platform reports for its own media. Blended ROAS is total revenue divided by total ad spend across everything. The two often tell different stories, and the blended number is usually the more honest one, because it can't be gamed by a platform claiming conversions its neighbors created.
The scale of that inflation is easy to underestimate. The ROI Genome finds that up to 70–90% of Amazon display advertising's impact actually drives sales off Amazon—value the platform's own ROAS quietly folds into its own column. Sum your channel ROAS figures and you'll always overshoot the revenue the business actually booked. Blended ROAS is the reconciliation: one denominator, one numerator, no double-claims.
Marketing efficiency ratio (MER)
MER—total revenue divided by total marketing spend—is the executive-level health check that sidesteps attribution entirely. It doesn't care which channel gets credit; it asks whether the whole marketing engine is producing return. That makes it increasingly valuable as channel-level attribution frays.
And it is fraying, though not the way the industry predicted. Google confirmed in April 2025 that it won't deprecate third-party cookies in Chrome after all—but that's cold comfort, since Safari and Firefox have blocked them by default for years, covering roughly 30% of web traffic, and Google wound down its Privacy Sandbox alternatives later that year. The signal loss is real and permanent even if the cookie itself lingers.
For DTC and e-commerce brands especially, MER has become a north-star metric precisely because it holds steady while channel-level measurement gets noisier.
Marketing ROI limitations (and how to overcome them)
Every formula so far assumes clean inputs. Practice rarely obliges. Marketers name the culprits themselves: in the same Nielsen research, 22% cite poor stakeholder alignment as their single biggest measurement challenge and 19% point to data that simply can't be compared across channels. Neither is a maths problem—and neither is fixed by a better spreadsheet. Three structural issues sit underneath them.
The attribution gap: when credit doesn't match reality
The longer and more scattered the buying journey, the wider the gap between what happened and what your model can see. B2B sales cycles run for months. Conversions close offline, over the phone, in a room. Influence spreads through dark social—the Slack DM, the forwarded email—that no tracker captures. One buyer touches six devices. Every one of those creates distance between marketing activity and measurable revenue.
- Attribution models paper over the gap, each with a bias.
- First-touch overcredits discovery and ignores everything that closed the deal.
- Last-touch does the reverse, handing the trophy to whichever channel happened to be standing there at conversion.
- Data-driven models distribute credit statistically and get closest to reality—but need volume and clean data to work.
The rule of thumb: last-touch for short, simple journeys; data-driven for long, multi-touch ones; first-touch only when you're deliberately measuring demand creation. And remember advertising's effects bleed across channels—the ROI Genome attributes about 45% of advertising's impact to lifting other channels' performance, an effect no single-channel model can see at all.
Platform-reported data vs. independent measurement
Google, Meta and Amazon each measure conversions with methods tuned to favor their own inventory—and each is both the seller and the scorekeeper. The result is inflated performance numbers, and the same conversion claimed several times over. A platform reporting on its own effectiveness has every incentive to count generously and none to check whether the sale would have happened anyway.
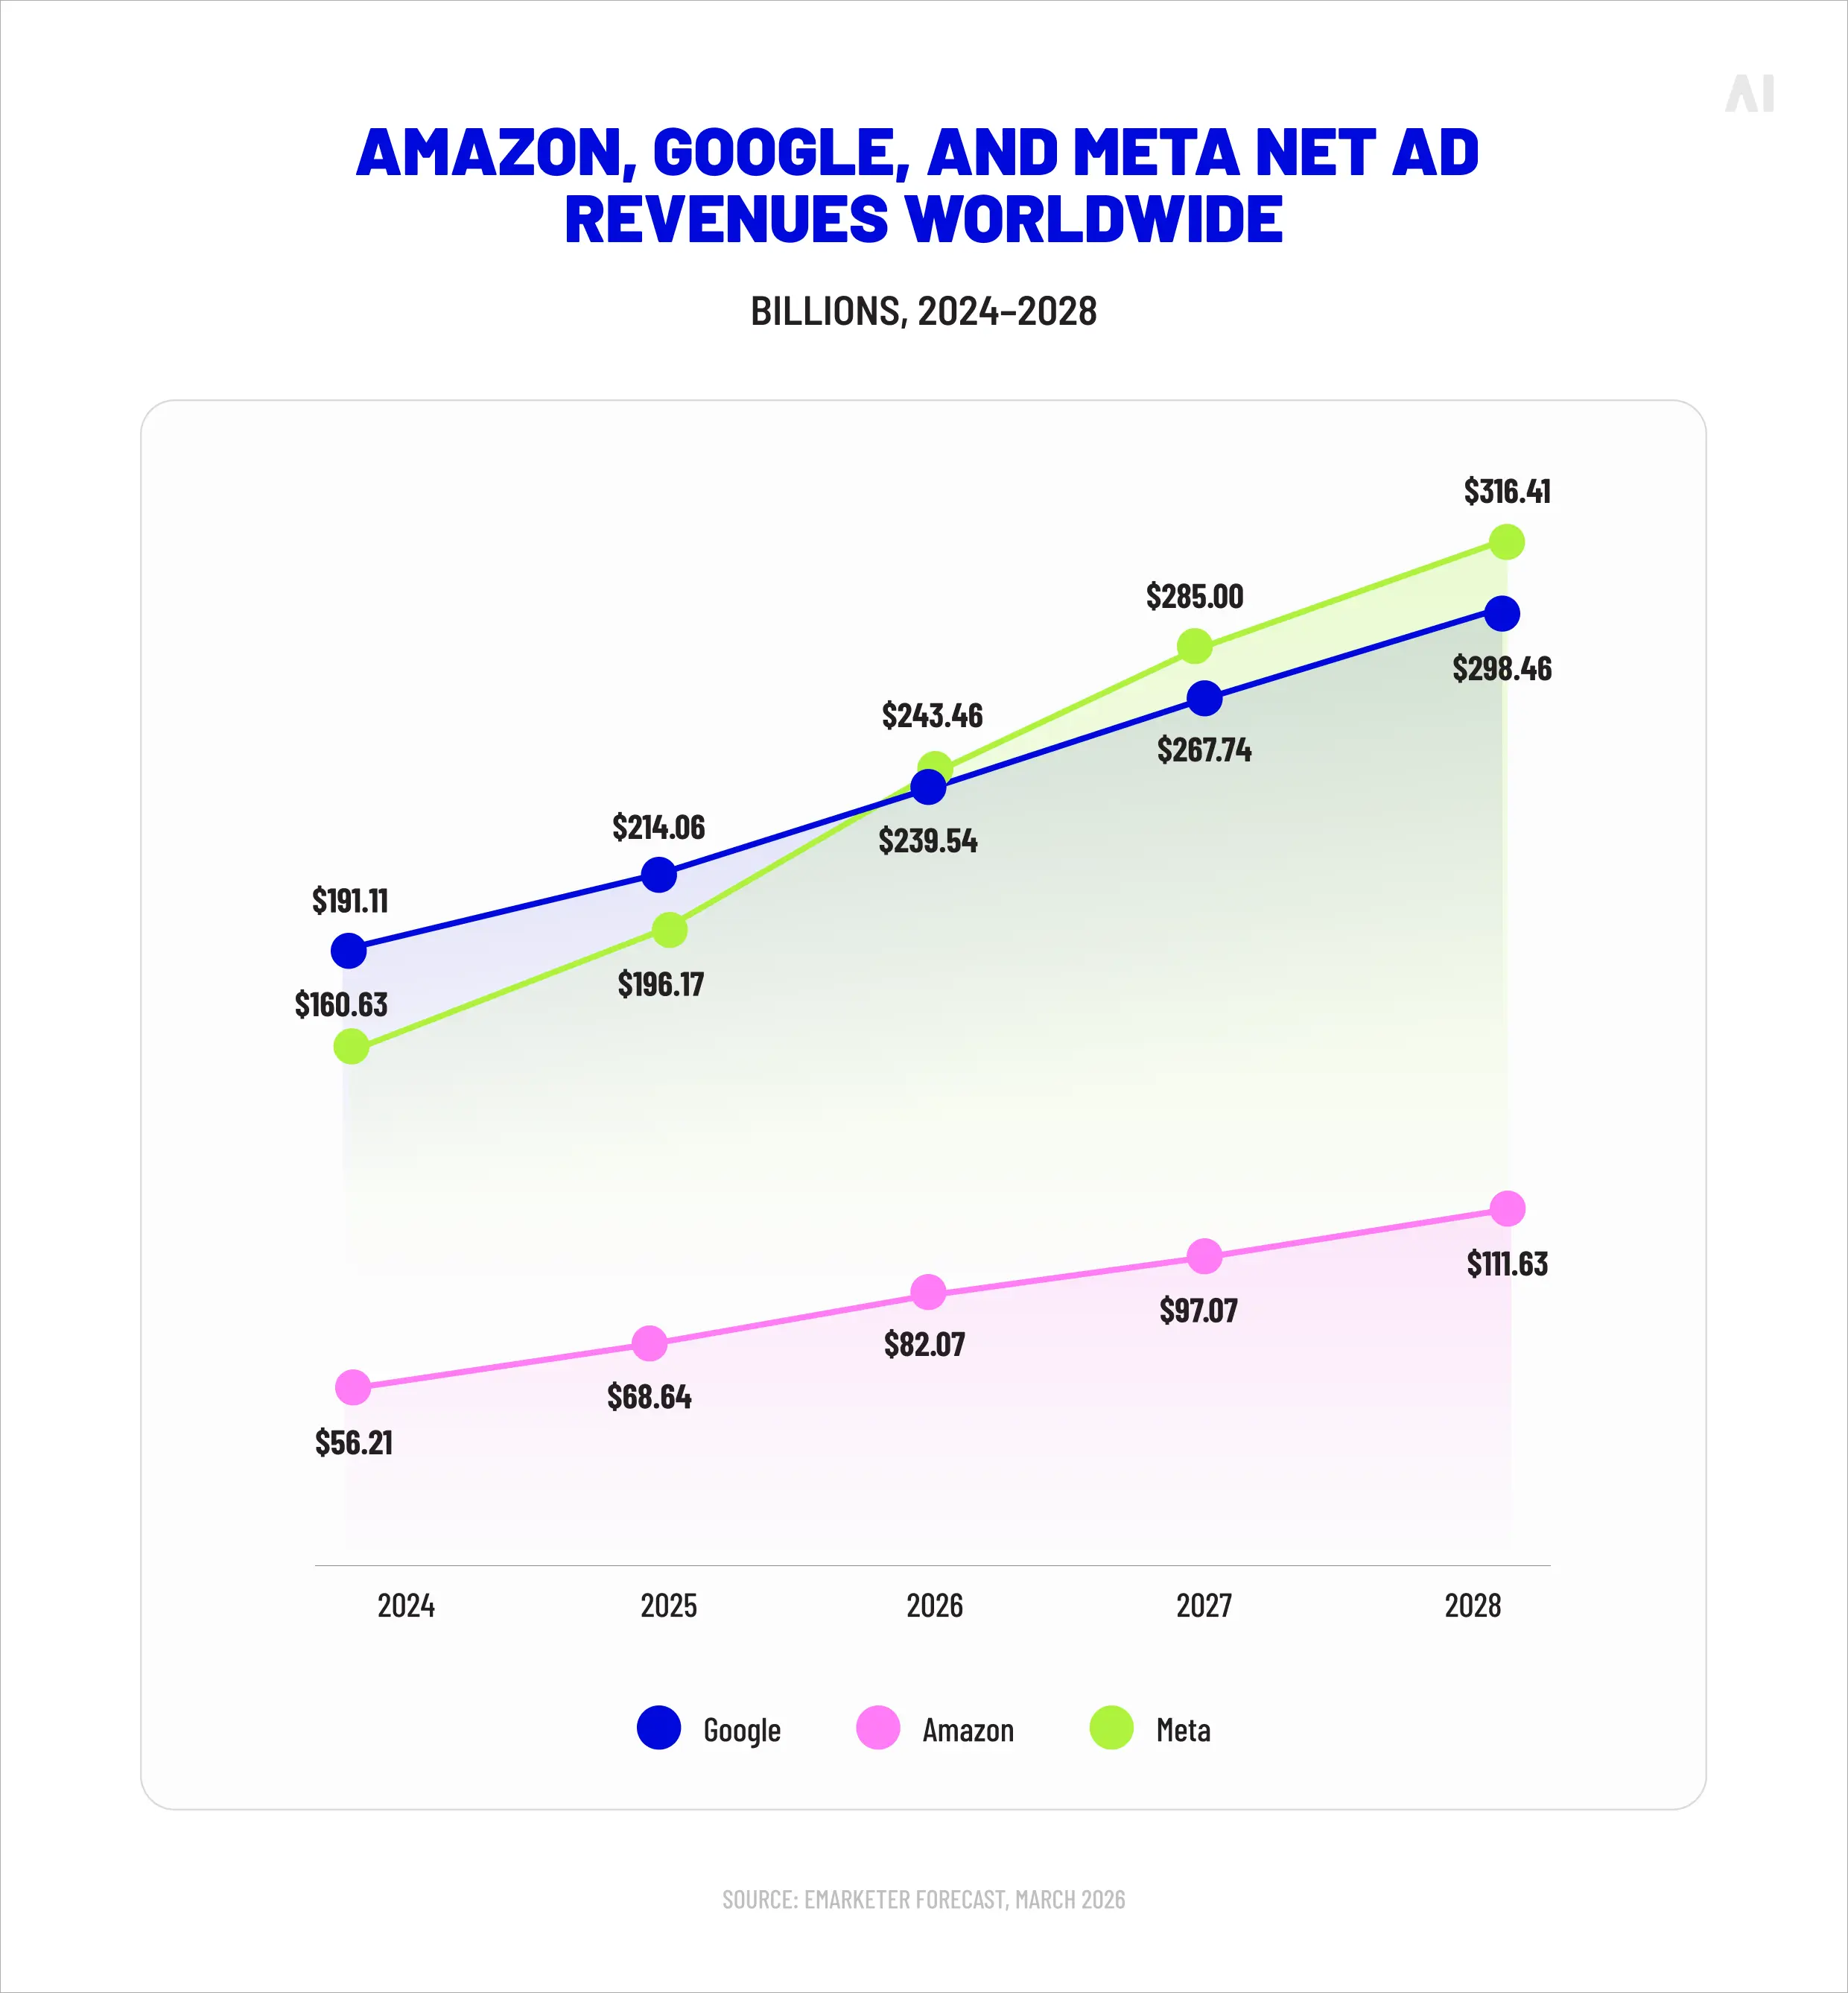
Independent, third-party measurement is the only reliable baseline for comparing ROI across channels, because it applies one consistent standard to all of them and answers the question platforms won't: what was incremental? Without it, cross-channel budget decisions rest on numbers each vendor scored in its own favor.
Hidden costs that inflate your ROI
The fastest way to a flattering ROI is an incomplete cost base, and most teams keep one without realizing it. The line items that go missing are —
- data infrastructure and warehousing,
- the ad-operations labor that traffics and monitors campaigns,
- creative iteration cycles,
- measurement and analytics subscriptions, and
- the agency-management overhead of coordinating it all.
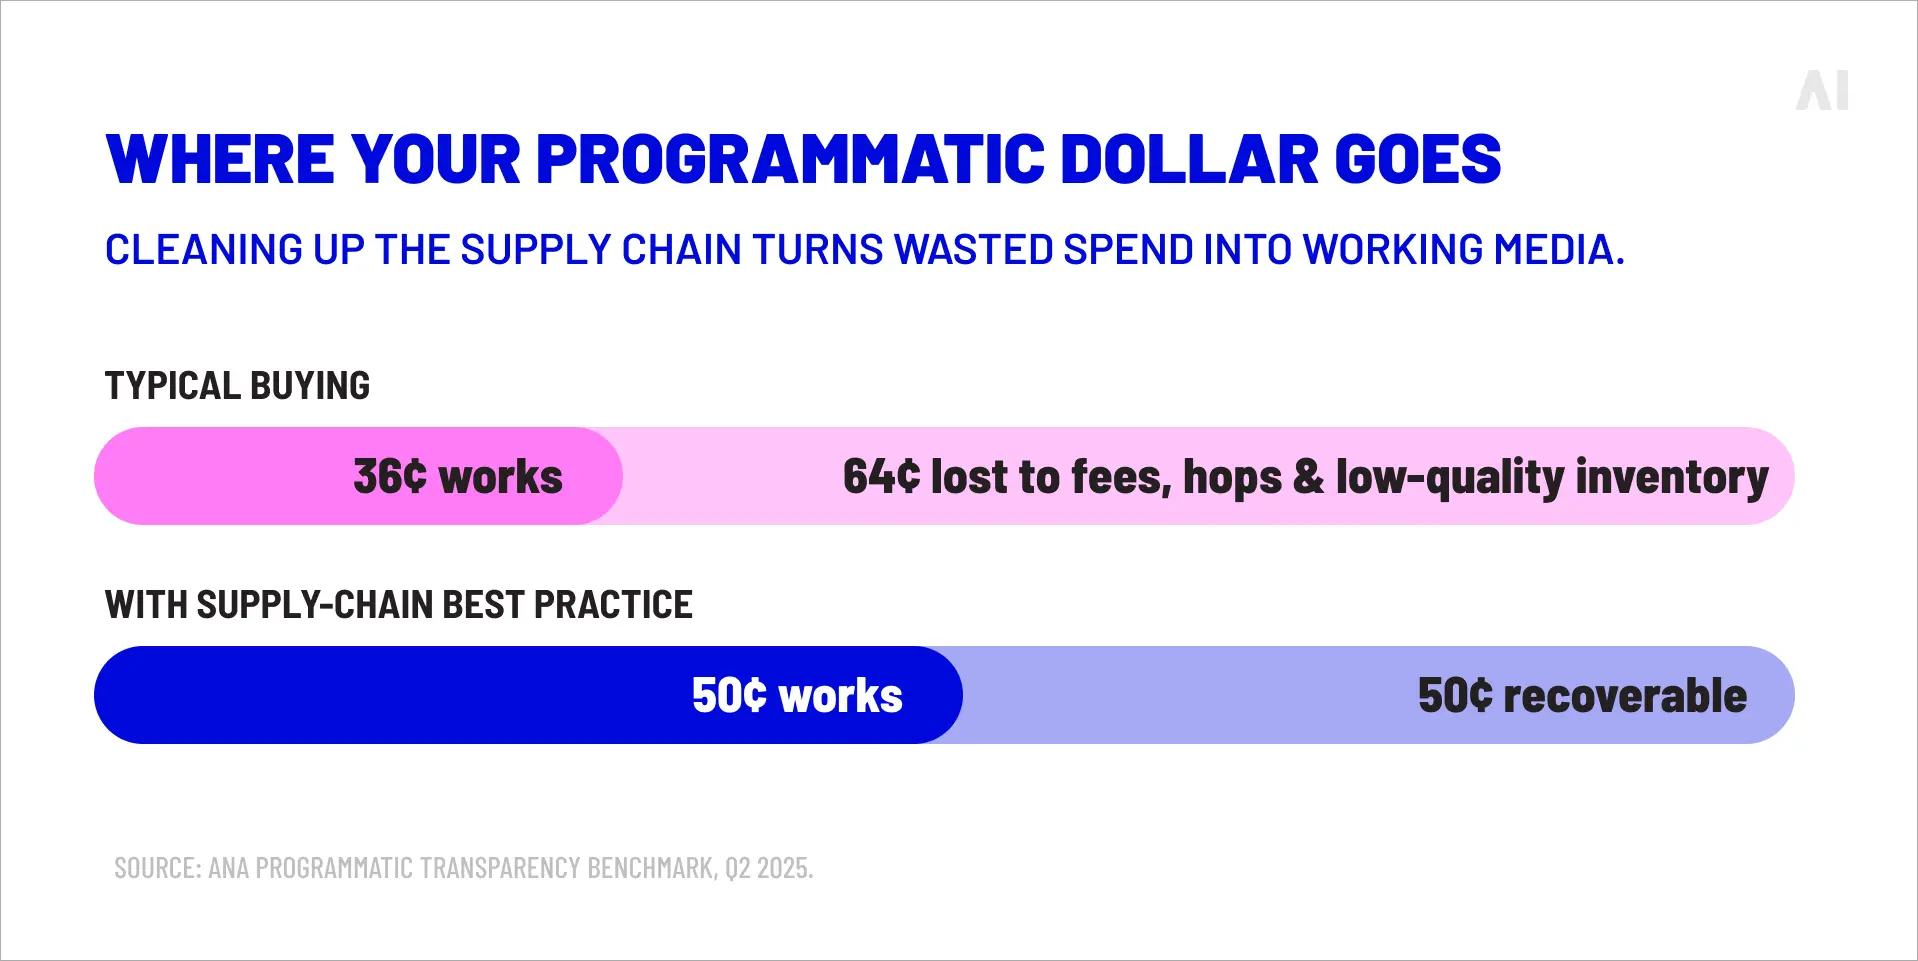
Leave them out and every ROI you report is overstated by whatever you forgot to count. There's a working-media version of the same problem: the ANA's 2025 benchmark finds that following supply-chain best practices can lift the effective value of programmatic spend from about 36 cents on the dollar to 50—meaning a large share of "media cost" never reaches a real person at all. Count every cost, and count whether each dollar actually worked.
⚡ The fastest route to an impressive ROI is an incomplete list of costs.
How to turn marketing ROI insights into action
The point of measuring marketing ROI is to redirect money, effort and attention toward what works—and away from what only looks like it does.
Use ROI insights to optimize budget allocation
Comparing ROI across channels shows where the next dollar earns most—but only if the comparison is fair. Reallocate on platform-reported numbers and you'll pour budget into whichever channel lies best about itself. Validate first.
Incrementality testing—holding out a control group to isolate what marketing truly caused—is the cleanest check on whether a high-ROI channel is creating demand or just harvesting it. Shift budget on incremental return, not attributed return.
Identify creative performance gaps
ROI analysis, taken to the asset level, exposes the creative that's dragging a campaign down. Two ads can run identical targeting and budget and return wildly different profit, and the difference is almost always the creative.
Reading ROI by asset—not just by campaign—tells you which concepts to retire, which to scale, and what to test next, before the underperformers quietly tax the whole program.
The action is straightforward once the data is: move budget out of the bottom quartile of creative and into the top, then feed what you learn back into the next round of concepts. Because creative effects compound—a stronger asset lifts every impression it runs against—small, consistent gains here often beat a larger swing in targeting or bidding.
Identify media efficiency opportunities
Some of the biggest ROI gains come not from better targeting but from cutting waste in the plumbing. Poor media quality, low viewability, invalid traffic and bloated supply paths all drain return before a campaign has a chance.
The scale of the waste is well documented: the ANA has found the average programmatic campaign running across some 44,000 websites when a few hundred would reach roughly 95% of the target audience. Trimming that sprawl raises working-media efficiency and profitability at once—the same result as a budget increase, at no extra cost.
How AI Digital supports accurate marketing ROI
Accurate ROI depends on trustworthy inputs and a single, consistent view across channels—exactly the two things fragmented, platform-reported measurement can't provide. AI Digital's tools are built to supply them, not as standalone products but as the measurement backbone beneath better investment decisions.
Elevate: independent campaign measurement
Elevate is AI Digital's vendor- and DSP-agnostic marketing intelligence platform, sitting across 12+ DSPs and the wider digital ecosystem rather than serving ads itself. For ROI, that independence is the point: through modules like Path to Conversion and marketing mix modeling, Elevate measures campaign performance against a consistent, platform-neutral standard—separating incremental impact from conversions a platform merely claimed. The result is an ROI calculation built on verified return, not seller-reported numbers.
Open Garden framework: unified data for accurate ROI
Fragmented data is where accurate ROI goes to die. The Open Garden framework—AI Digital's DSP-agnostic approach spanning 15+ DSPs—connects campaign, audience and conversion data into one measurement layer instead of a dozen incompatible ones. Consistent cross-channel data means attribution is applied the same way everywhere, which is the precondition for ROI numbers that can actually be compared across channels.
Smart Supply: cutting waste to improve working-media ROI
You can improve ROI by earning more revenue or by wasting less spend, and the second is faster. Smart Supply improves the denominator—supply selection and optimization that removes made-for-advertising inventory, enforces brand safety and streamlines supply paths so budget reaches quality environments. The stakes are large: the ANA puts annual programmatic waste at $26.8 billion, up 34% in two years, even as made-for-advertising exposure has fallen to under 1% of spend for disciplined buyers. Cleaner supply lifts ROI without a dollar of extra budget.
AI Creative Studio: faster, better-performing creative
Creative is one of the largest levers on ROI and one of the hardest to scale. AI Creative Studio—"AI Scale. Human Taste."—pairs AI-native production with human creative judgment across four areas: AI creative production, adaptation at scale, interactive formats, and creative intelligence.
That last one matters most for ROI: tools like Synthetic Focus flag the strongest-performing creative before it goes live, so spend backs winners rather than discovering losers in-flight. It's a direct lever, given the ROI Genome's finding that roughly two-thirds of a video ad's effectiveness comes down to the creative itself. More tested variants, produced faster, mean a lower cost per outcome and a higher creative ROI.
Conclusion on how to calculate ROI marketing: start with better measurement
The marketing ROI formula is genuinely simple—revenue minus cost, over cost. What's hard is trusting the numbers you put into it. Reliable ROI depends on complete costs, consistent attribution, and revenue that reflects incremental impact rather than borrowed credit. Get those right and the arithmetic takes care of itself; get them wrong and no formula will save you.
The through-line of this guide is one shift in habit: stop taking platform-reported metrics at face value, and move toward independent, cross-channel measurement that applies one standard to every dollar. That's how measuring marketing ROI turns from a reporting exercise into a decision-making one.
To see how AI Digital's marketing intelligence tools help organizations measure, optimize and improve marketing ROI with more confidence, get in touch.


.webp)