Customer Journey Analytics Explained: Data, Touchpoints, and Cross-Channel Insights

Modern customer journeys are no longer simple or linear. A customer may first see a brand through paid media, compare products on mobile, ask for opinions in a private community, read reviews, receive an email, return through search, speak with sales, and only then make a purchase. These touchpoints often happen across disconnected systems, including web analytics, mobile apps, CRM platforms, ad networks, call centers, offline sales data, and dark social channels.
💡This fragmentation makes customer journey analytics essential. Businesses need to understand not only where conversions happen, but also how customers move toward them over time.
Traditional analytics tools often show only part of the journey. Web analytics can track sessions, clicks, and conversions, but it may miss what happened before the visit or after the sale. Attribution models can assign credit to marketing channels, but they often oversimplify journeys that involve multiple devices, long decision cycles, offline interactions, and privacy-related signal loss.
In 2026, this gap is becoming harder to ignore. Salesforce reports that 83% of marketers recognize the shift toward personalized, two-way customer engagement, yet only one in four are satisfied with how they use data to support those moments. Adobe’s 2026 research also shows that only 39% of organizations have a shared customer data platform capable of supporting large-scale AI-driven engagement.
Customer journey analytics helps close this gap by connecting fragmented customer data into a clearer view of behavior across channels, sessions, and lifecycle stages. Instead of treating each touchpoint as a separate event, it shows how interactions work together over time.
For enterprise marketers, analytics leaders, ecommerce teams, and SaaS companies, this makes it easier to identify behavioral patterns, improve personalization, reduce churn, optimize acquisition paths, and make faster decisions based on real customer journeys rather than partial channel reports.
What is customer journey analytics?
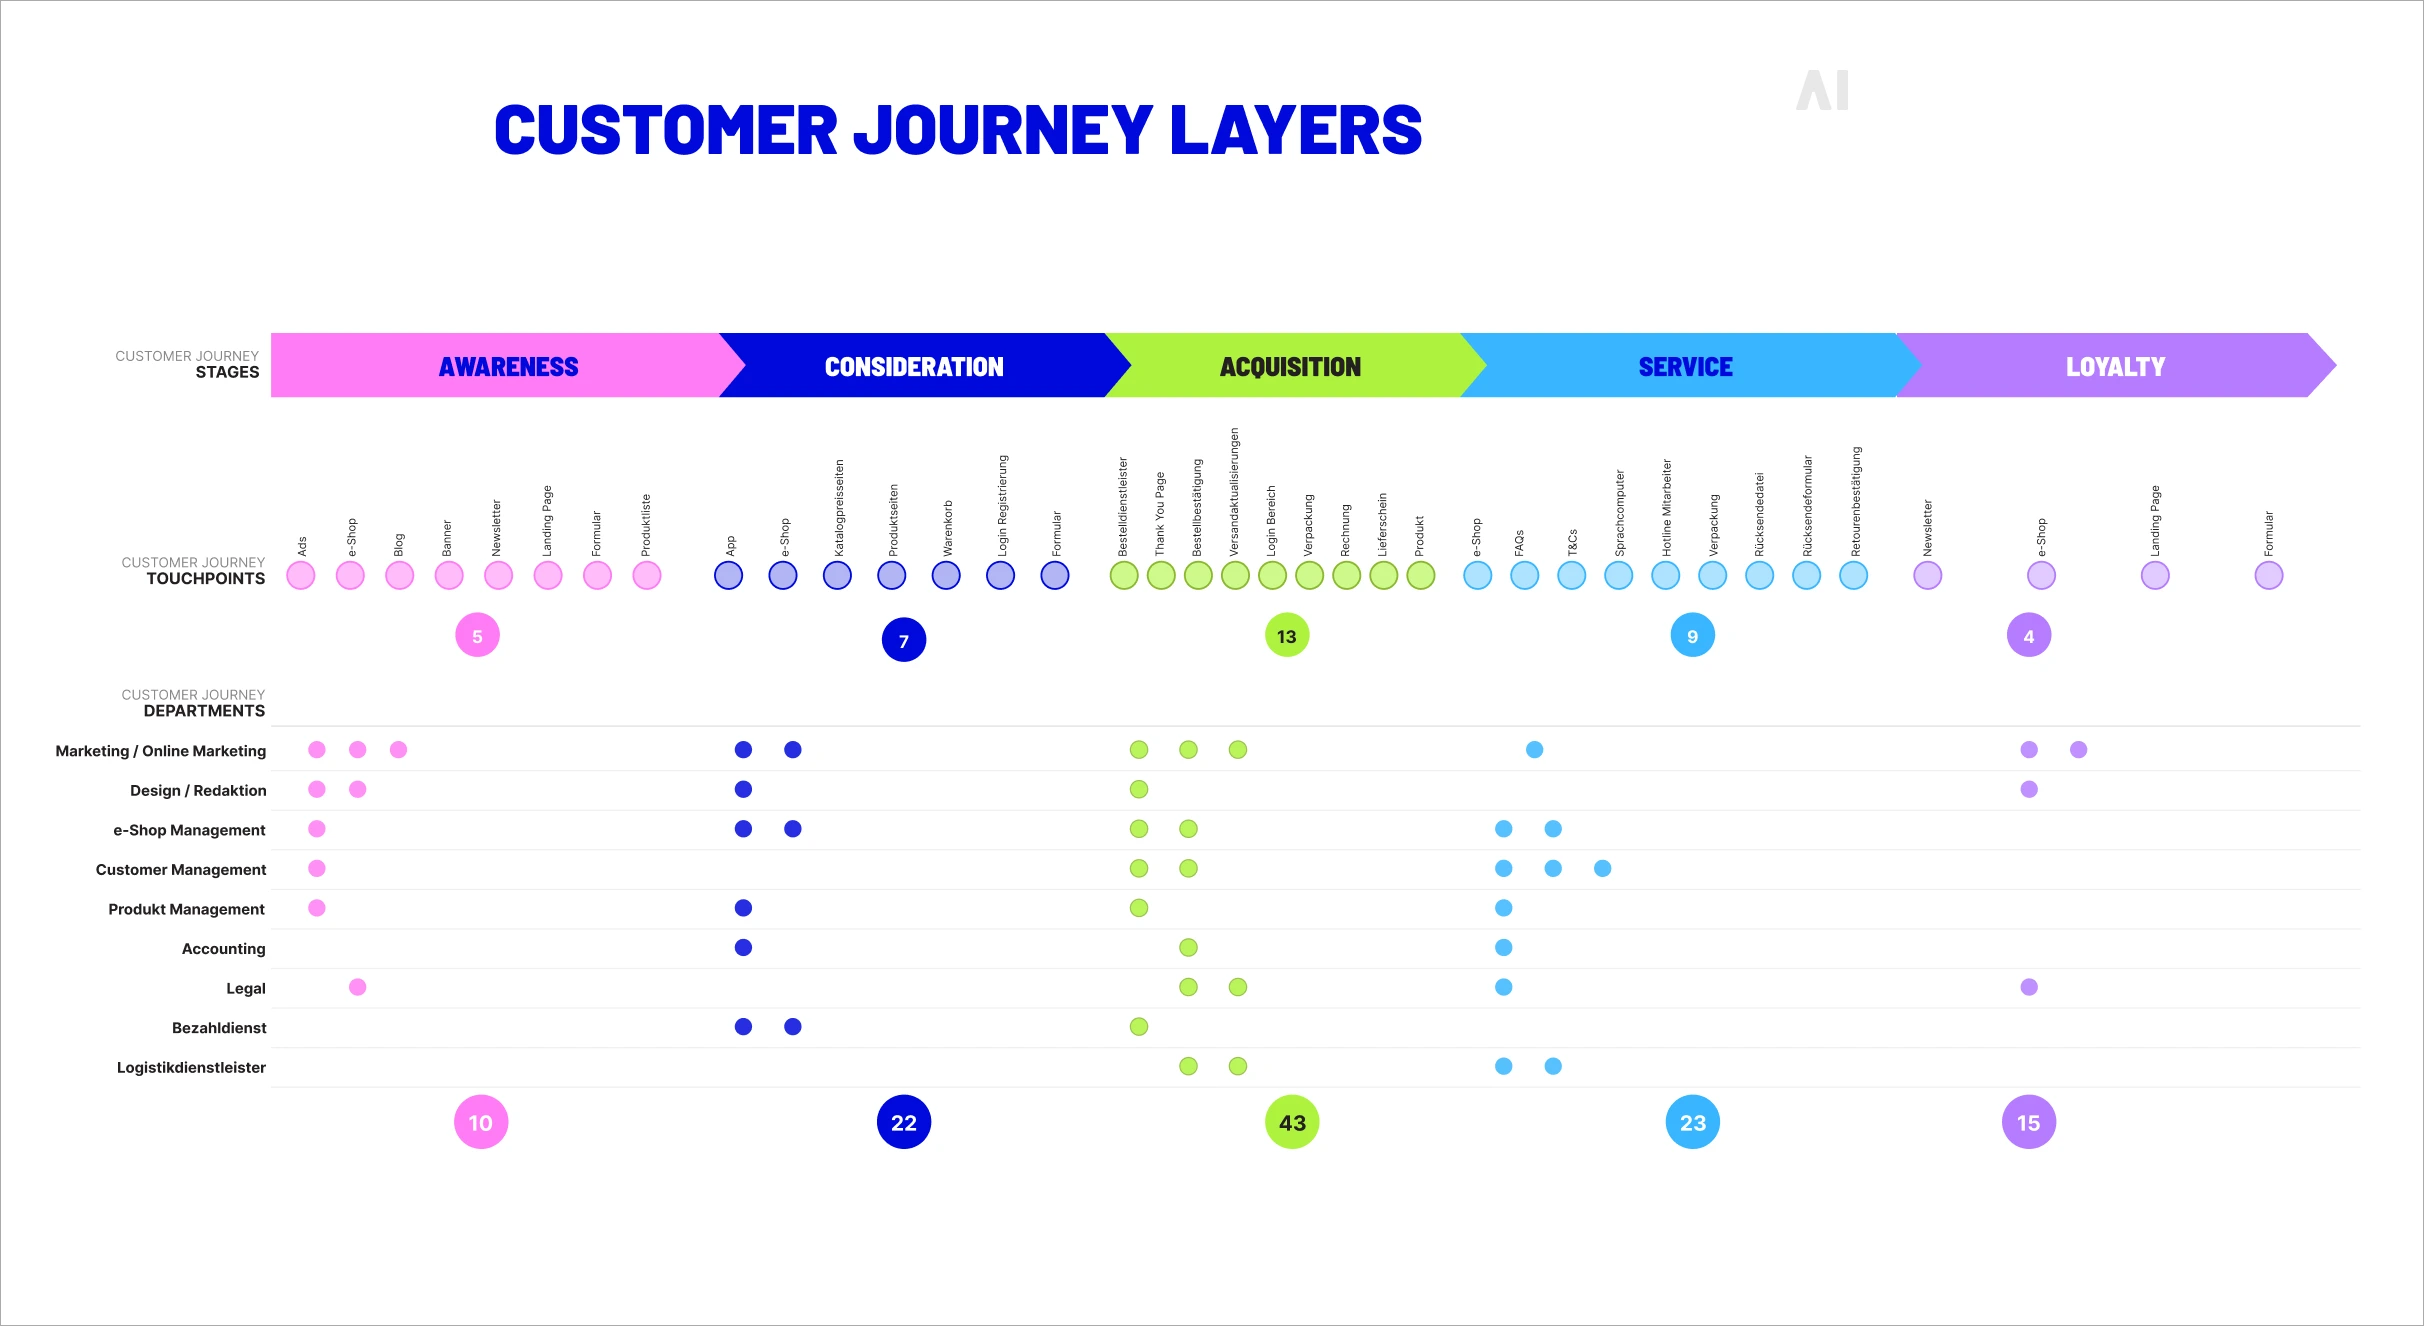
Customer journey analytics is the process of tracking and analyzing customer interactions across channels, devices, and sessions. It helps businesses understand how people move through the customer journey over time, from first awareness to conversion, retention, upsell, or churn.
Unlike single-channel reporting, customer journey analytics connects data from web, mobile, paid media, CRM, email, sales, support, offline activity, and other touchpoints. This gives teams a clearer view of customer behavior across the full lifecycle.
For example, a customer may click a paid ad, visit a product page on mobile, read reviews, receive an email, speak with sales, and convert later through direct traffic. Traditional analytics may treat these actions as separate events. Journey analytics connects them into one behavioral sequence.
This matters because customer data is still fragmented for many businesses:
- 83% of marketers recognize the shift toward personalized, two-way customer engagement, but only one in four are satisfied with how they use data to support those moments, according to Salesforce.
- Only 39% of organizations have a shared customer data platform capable of supporting large-scale AI-driven engagement, according to Adobe’s 2026 research.
- IAB’s 2026 State of Data report highlights that privacy regulation, platform changes, and disconnected systems continue to make consistent cross-channel measurement harder.
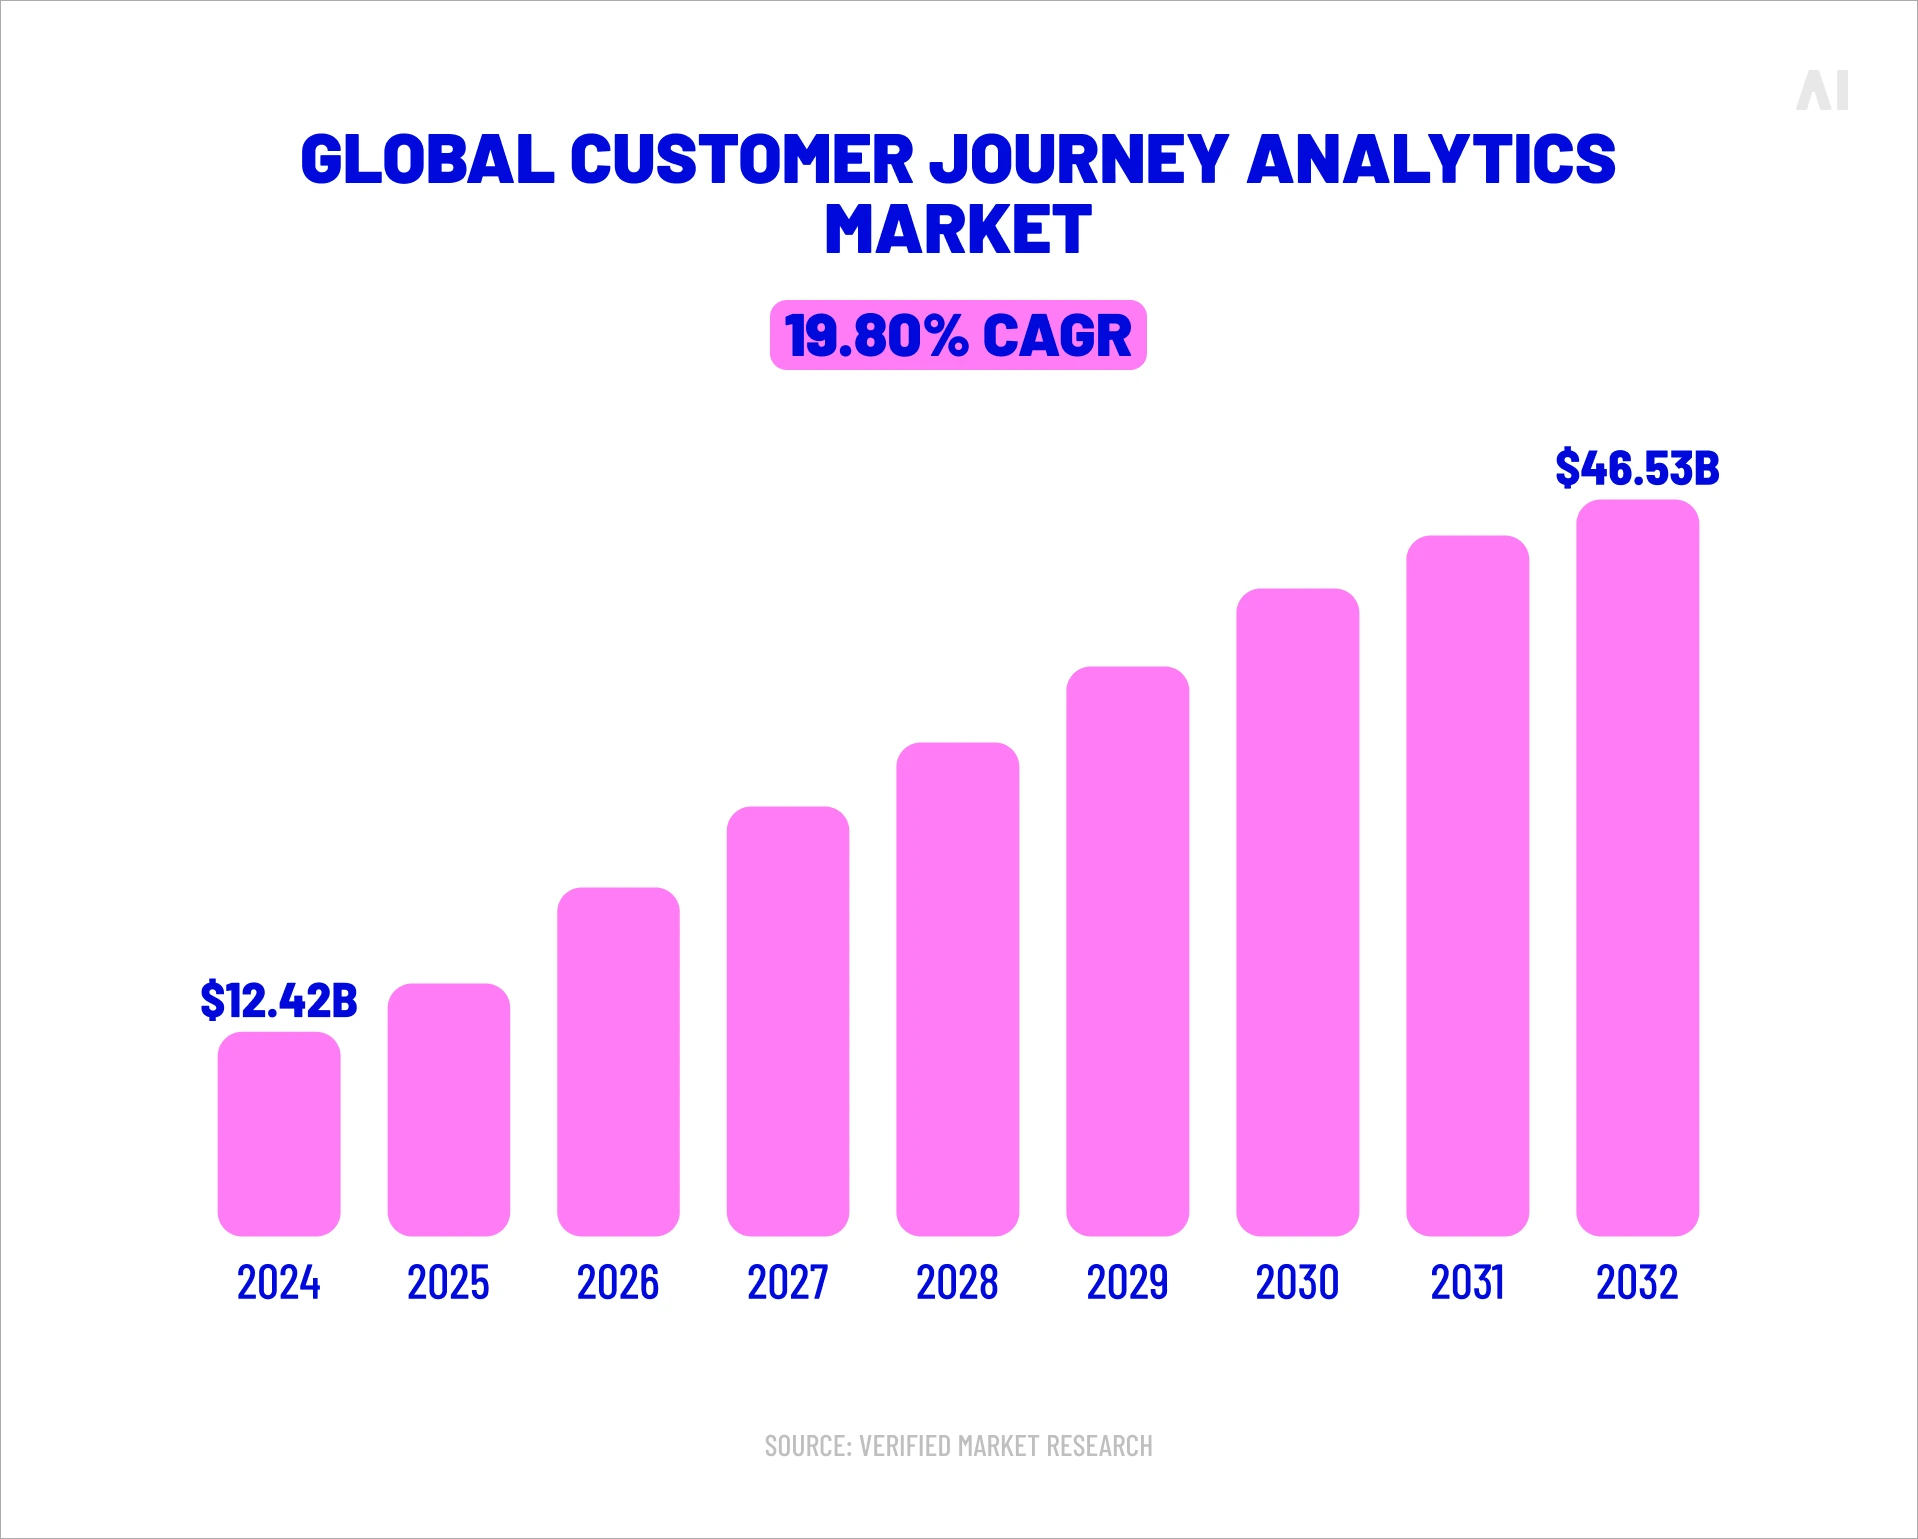
Source: Customer Journey Analytics Market size was valued at USD 12.42 Billion in 2024 and is projected to reach USD 46.53 Billion by 2032, growing at a CAGR of 19.80% from 2026 to 2032.
💡This is where analytics customer journey data becomes more strategic. It shows how customer behavior develops across time and which touchpoints influence decisions.
⚡️For teams comparing broader data strategy, the AI Digital’s article Marketing Analytics vs Marketing Intelligence: Why the Difference Matters for Growth explains how analytics fits into decision-making. For conversion credit specifically, AI Digital’s guide to multi-touch attribution explains how businesses evaluate the role of different touchpoints in the path to conversion.
CJA vs. Funnel analytics
Funnel analytics and customer journey analytics answer different questions. Funnel analytics measures how users move through a predefined path, such as product page → cart → checkout → purchase. It is useful when the business already knows the steps it wants customers to take.
Customer journey analytics is broader. It tracks cross-channel and multi-session behavior, including the steps customers take before, between, and after funnel stages. This matters because real customers rarely follow one clean path.
- Funnel analytics shows drop-off points in a fixed conversion path.
- Customer journey analytics shows behavior patterns across channels, devices, and time.
- Funnel analytics is best for optimizing known flows, such as checkout or onboarding.
- Journey analytics is better for discovering unexpected paths, repeated touchpoints, and hidden friction.
Adobe’s 2026 consumer research shows that 39% of customers do extensive research and comparison shopping before committing to a product or service. That kind of behavior often happens outside a single funnel, which is why businesses need journey-level analysis.
⚡️For a broader measurement perspective, Marketing Measurement vs Attribution vs MMM: What’s the Difference explains how different measurement methods serve different business questions. Marketing Attribution Models: Types, Comparison, and Limitations goes deeper into how conversion credit is assigned across channels.
Events, sessions, and identity
Customer journey analytics depends on three core data layers: events, sessions, and identity.
An event is a specific customer action, such as a page view, ad click, app install, email open, product search, demo request, support ticket, or purchase. A session groups actions that happen within a defined period of activity. Identity resolution connects those actions to the same person, household, device, or account where consent and data quality allow it.
Together, these layers turn disconnected interactions into unified journey data:
- Events show what the customer did.
- Sessions show when and how activity happened.
- Identity resolution connects behavior across devices, browsers, platforms, and channels.
- Journey analytics uses this connected data to show how customer behavior develops over time.
Without identity resolution, the same customer may appear as several unrelated users. This creates fragmented reporting and makes it harder to understand which interactions actually influenced the journey.
CJA vs. Attribution
Customer journey analytics and attribution are closely related, but they are not the same. Customer journey analytics studies behavior across the full customer journey. Attribution focuses on assigning credit to touchpoints that contributed to a conversion.
In simple terms, CJA explains the journey. Attribution explains conversion credit.
- CJA asks: What paths do customers take?
- Attribution asks: Which touchpoints should receive credit for the conversion?
- CJA is behavioral: It looks at patterns, sequences, friction, engagement, and retention.
- Attribution is financial: It helps marketers evaluate channel contribution, budget allocation, and return on ad spend.
💡For example, journey analytics may show that customers who use live chat after reading reviews are more likely to buy. Attribution may then try to decide how much credit belongs to reviews, chat, paid search, email, or direct traffic.
⚡️Both are useful, but attribution alone can miss the full context. It may reward the final measurable touchpoint while undervaluing earlier interactions that shaped customer intent. This is why the our article Attribution Is Broken: Why Traditional Models No Longer Work is important for understanding the limits of conversion-credit models in fragmented, privacy-constrained customer journeys.
Customer journey touchpoints

In customer journey analytics, a touchpoint is not just an owned digital interaction. It is any moment that shapes how a customer discovers, evaluates, buys, uses, or returns to a brand. That includes measurable digital actions, offline conversations, support interactions, review activity, sales calls, in-store visits, and inferred signals that suggest intent.
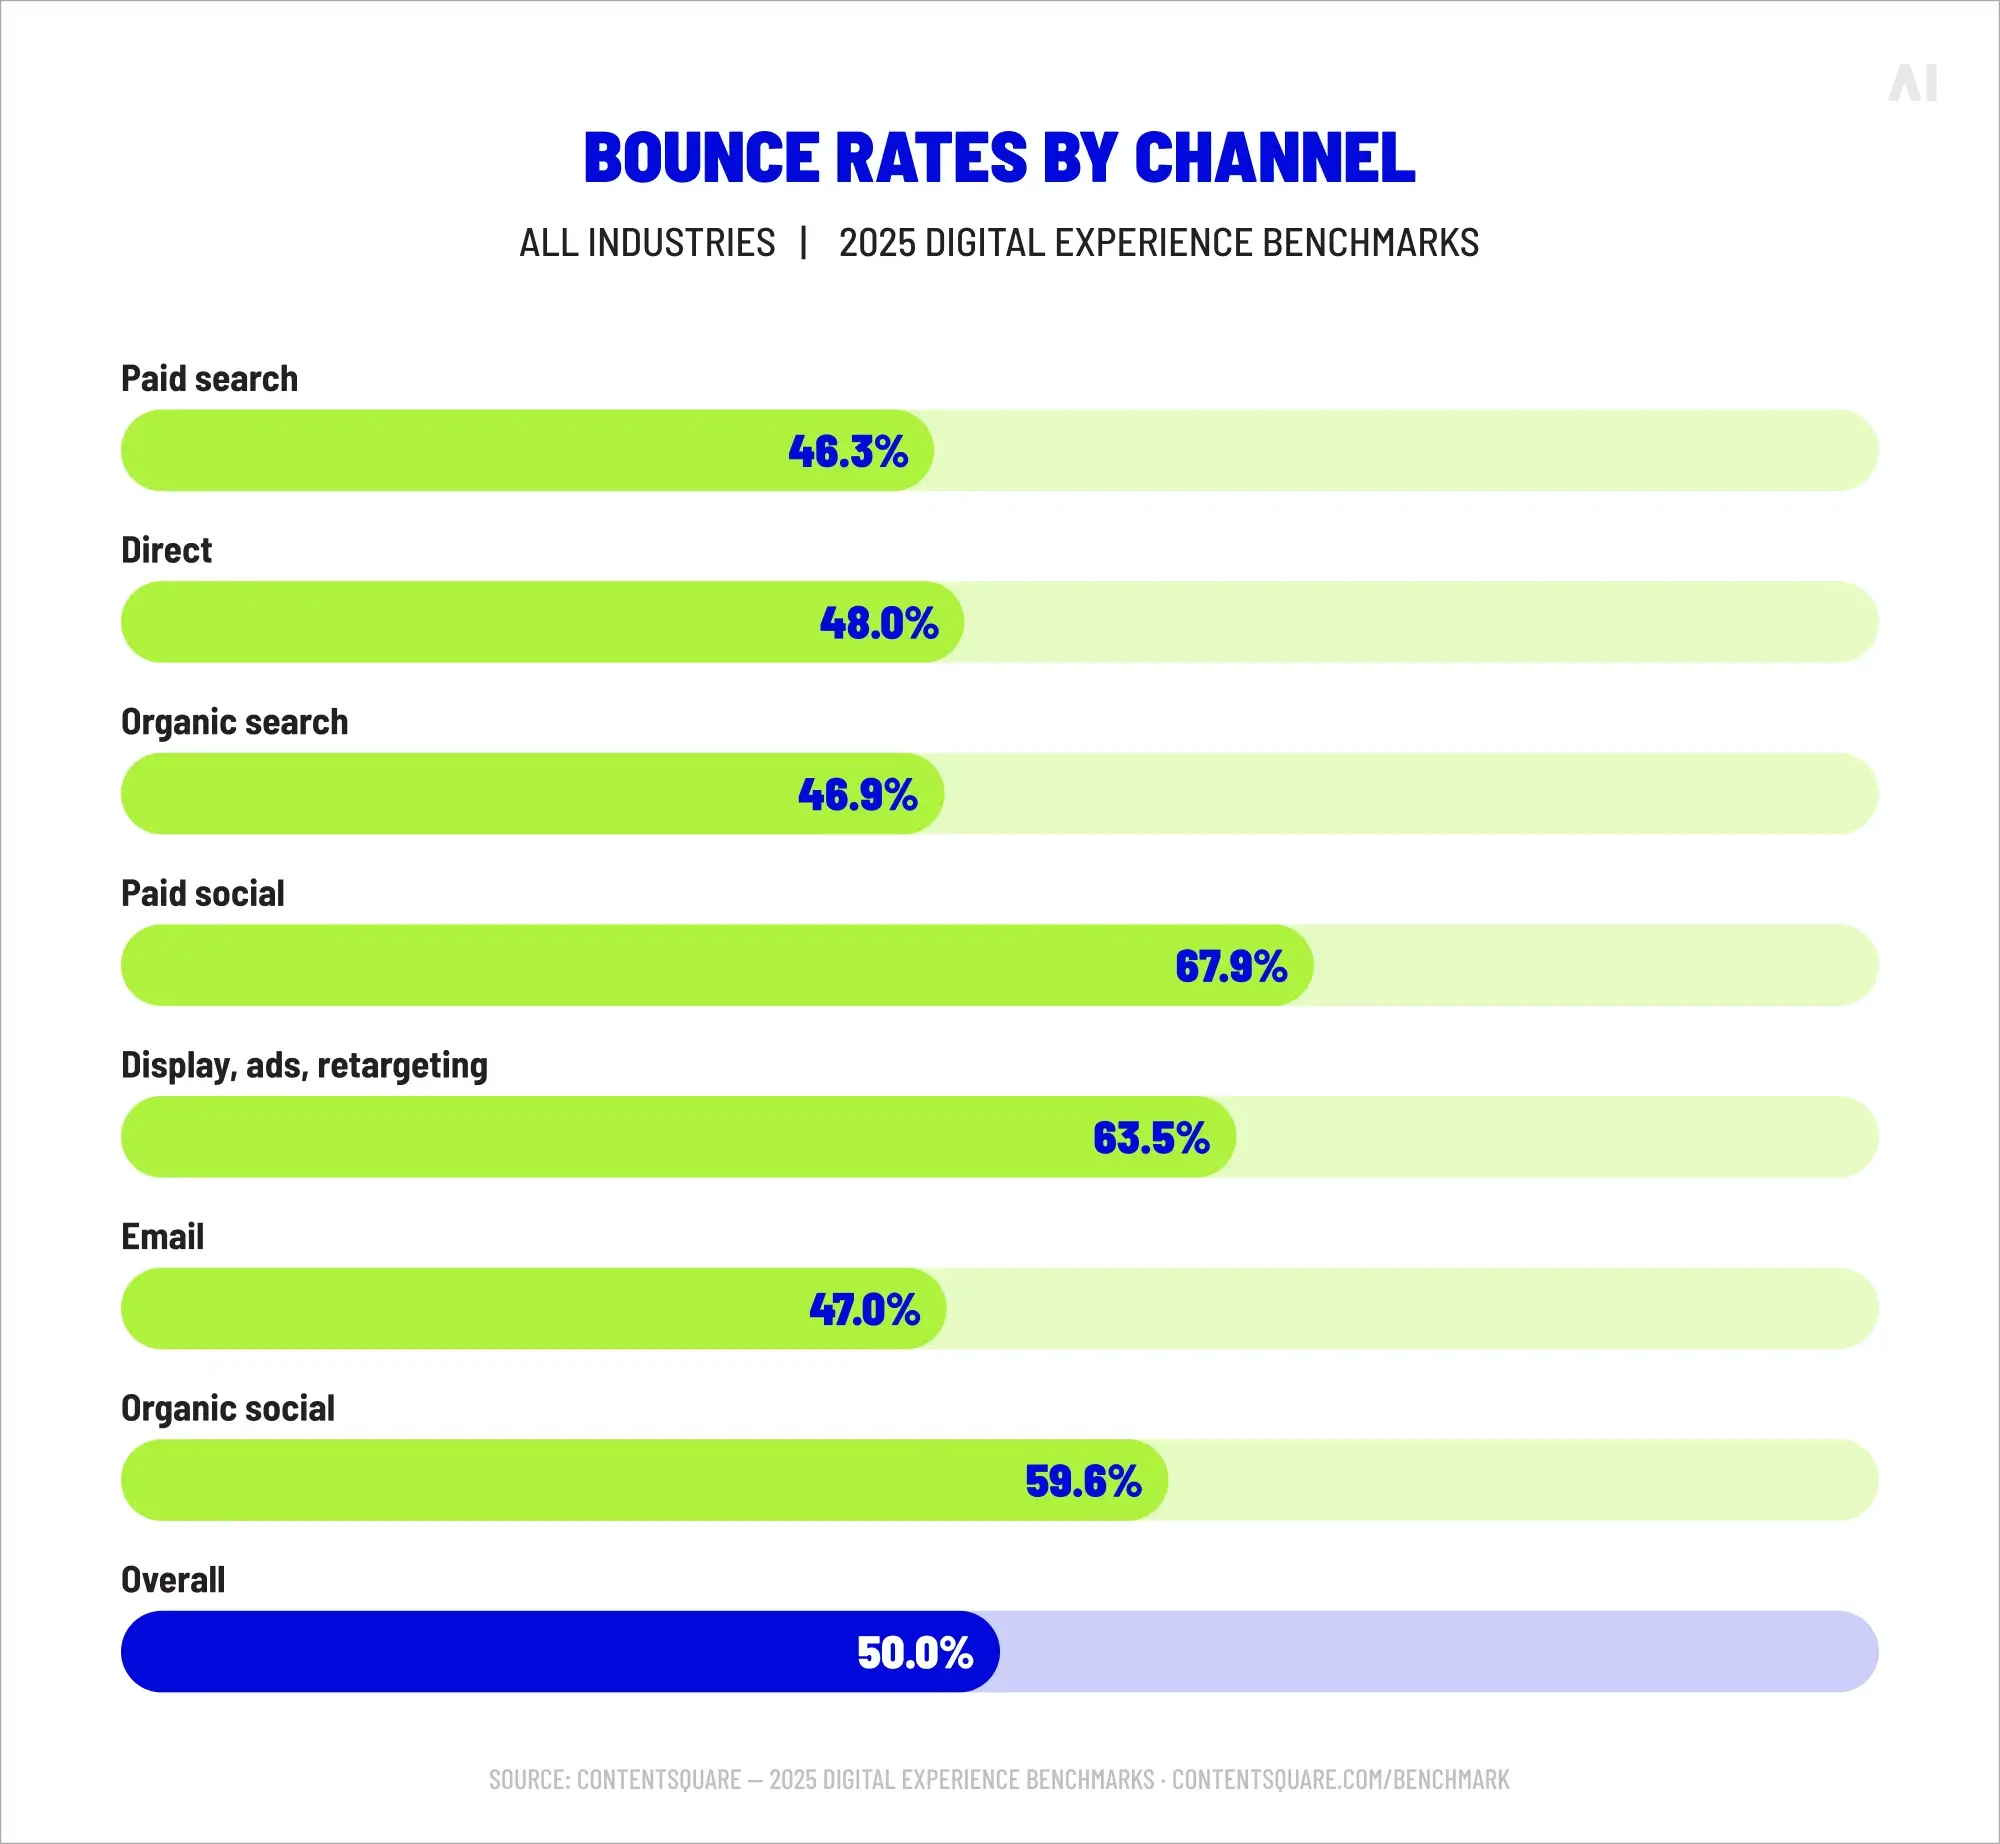
This matters because journey models are only as strong as the touchpoints they can see. If key interactions are missing, the analytics customer journey becomes distorted. A report may show that paid search drove the conversion, while missing the review site, dark social recommendation, call center conversation, or in-store visit that actually influenced the decision.
The scale of the problem is growing:
- Marketers now use an average of 10 customer engagement channels, according to Salesforce.
- 97% of consumers read online reviews when browsing for local businesses, according to BrightLocal’s 2026 Local Consumer Review Survey.
- Adobe reports that customers have consumed 72% more reviews and testimonials and 69% more influencer content before purchase over the last two years.
- IAB’s 2026 State of Data report says privacy regulation, signal loss, platform-embedded optimization, and fragmented data environments are making it harder to connect media exposure to outcomes with confidence.
💡This is why touchpoint coverage is a measurement issue, not just a data collection issue. When critical touchpoints are absent, businesses may overinvest in the channels that are easiest to measure and undervalue the channels that actually create trust, reduce friction, or move customers closer to conversion.
⚡️For a broader view of measurement gaps, the article Cross-Channel Marketing Measurement: Challenges and Solutions explains how fragmented channel data affects performance visibility. AI Digital’s guide to walled gardens also explains why restricted platform data can limit journey-level insight.
Types of customer touchpoints
A useful way to audit customer journey touchpoints is to classify them by control and channel type. This helps marketers see which interactions are fully owned, partially visible, or difficult to capture.
Common touchpoint categories include:
- Owned digital touchpoints: website visits, landing pages, mobile app events, blog content, product pages, account portals, and checkout flows.
- Paid media touchpoints: paid search, paid social, display, programmatic ads, CTV, retail media, and sponsored content.
- CRM and lifecycle touchpoints: email, SMS, push notifications, nurture sequences, sales outreach, loyalty communications, and renewal campaigns.
- Human support touchpoints: call center interactions, live chat, chatbot conversations, sales demos, customer success calls, and technical support.
- Offline touchpoints: in-store visits, events, trade shows, physical mail, product trials, field sales, and point-of-sale interactions.
- Third-party influence touchpoints: review sites, comparison pages, affiliate content, influencer posts, publisher mentions, analyst reports, and community discussions.
- Dark social and inferred touchpoints: private messages, Slack groups, WhatsApp shares, Reddit threads, peer recommendations, screenshots, and offline word of mouth.
⚡️This taxonomy helps teams identify capture gaps before they turn into misleading reporting. For example, if mobile app events, review activity, and offline sales interactions are not connected to identity data, customer journey analytics may understate the real path to conversion. AI Digital’s article on cross-device targeting explains why device-level fragmentation can make this even harder.
Commonly missed touchpoints
Many businesses collect large amounts of data but still miss the interactions that explain why customers act. These gaps are especially common when touchpoints sit outside owned web analytics or paid media platforms.
Commonly missed touchpoints include:
- Live chat and chatbot conversations that reveal objections, product questions, and buying intent.
- Post-purchase support interactions that influence repeat purchase, retention, and churn.
- Loyalty app events such as reward views, saved products, offer redemptions, and reactivation behavior.
- Third-party reviews and comparison sites that shape trust before customers return through search or direct traffic.
- Sales and call center notes that contain high-value intent signals but often stay disconnected from marketing analytics.
- Dark social shares where customers recommend, criticize, or compare brands in private channels.
- Offline events and in-store visits that influence later digital conversions but rarely appear in standard web reporting.
💡The cost of missing these touchpoints is concrete. Teams may assign too much value to the final click, underestimate retention risks, personalize based on incomplete behavior, or optimize campaigns around visible interactions instead of meaningful ones. Strong customer journey analytics reduces this risk by connecting more of the decision-making context across digital, offline, and inferred touchpoints.
⚡️This is also where personalization becomes more accurate. AI Digital’s article on ad personalization explains how stronger behavioral signals can help brands deliver more relevant experiences without relying on shallow channel-level assumptions.
Unifying cross-channel customer data
Customer journey analytics only works when customer data is connected. Most businesses collect data across CRM systems, CDPs, websites, mobile apps, ad platforms, email tools, call centers, ecommerce systems, and offline sales channels. The problem is that these systems often describe the same customer in different ways.
A CRM may identify a customer by email address. A website may track a browser cookie. A mobile app may use a device ID. An ecommerce platform may store order history. A call center may use phone numbers or account IDs. Customer journey analytics connects these signals into a more complete view of how customers move across channels and devices.
This data unification usually depends on three layers:
- Data integration: bringing CRM, CDP, web, mobile, media, support, and offline data into one environment.
- Identity strategy: matching interactions to the same customer, account, household, or device where consent allows.
- Journey modeling: organizing events into sequences that show how behavior develops over time.
The need for stronger data foundations is clear. Adobe’s 2026 research found that only 39% of organizations have a shared customer data platform capable of supporting agentic AI, while 75% cite data integration and quality as a top implementation challenge. For journey analytics, this means data quality is not a technical detail. It directly affects how accurately teams can understand customer behavior.
Identity resolution
Identity resolution connects customer interactions across devices, sessions, and channels. It helps businesses understand when different data points likely belong to the same person, household, or buying account.
There are two main approaches:
- Deterministic matching uses confirmed identifiers, such as login IDs, email addresses, phone numbers, loyalty IDs, customer IDs, or account IDs.
- Probabilistic matching uses signals such as device type, location patterns, browsing behavior, IP address, and timing to estimate whether interactions may belong to the same user or household.
💡Deterministic matching is usually more accurate, but it depends on authenticated or directly provided data. Probabilistic matching can expand journey visibility, but it requires stronger governance because it relies on inference. In privacy-sensitive environments, businesses may also use secure collaboration methods such as data clean rooms.
⚡️AI Digital’s guide to data clean rooms explains how brands and partners can analyze shared data while limiting direct data exposure.
CDPs vs. Data warehouses
There is no single best architecture for customer journey analytics. The right model depends on data maturity, internal technical resources, activation needs, and scale.
💡 For many enterprise teams, the strongest setup combines these approaches. The warehouse may serve as the source of truth, the CDP may manage audience activation, and connectors may move data between analytics, media, CRM, and customer experience tools. The goal is not just to centralize data. The goal is to make journey insights usable for reporting, personalization, retention, and cross-channel optimization.
Customer journey analytics use cases
Businesses use customer journey analytics to understand how customers behave across the full lifecycle. Instead of only measuring channel performance, journey analytics shows how people move from awareness to engagement, conversion, retention, and repeat purchase.
This helps teams answer practical business questions:
- Which paths lead to the highest-value conversions?
- Where do customers drop off before buying?
- Which behaviors signal churn risk?
- Which segments respond best to specific channels or offers?
- Which interactions should trigger personalization, sales follow-up, or retention campaigns?
The value is especially clear in fragmented journeys. Baymard’s 2026 cart abandonment research shows an average online cart abandonment rate of 70.22%, which means ecommerce teams need deeper insight into the behaviors that happen before checkout abandonment.
Salesforce also reports that only 31% of marketers are fully satisfied with their data unification ability, which shows why connected journey data remains a major operational challenge.
Path analysis
Path analysis shows the sequences customers take before they convert, disengage, or return. It helps teams understand which channels, pages, messages, and interactions appear together in successful journeys.
For example, a SaaS company may find that high-intent customers usually visit a pricing page, read a comparison article, attend a webinar, and then request a demo. An ecommerce brand may see that customers who view product reviews before checkout are more likely to complete the purchase.
Path analysis helps teams identify:
- Common routes to conversion
- Repeated friction points
- High-performing channel sequences
- Content that supports decision-making
- Journey patterns that differ by segment or source
⚡️AI Digital’s article on digital experience analytics explains how behavior data can reveal friction across digital journeys.
Cohort analysis
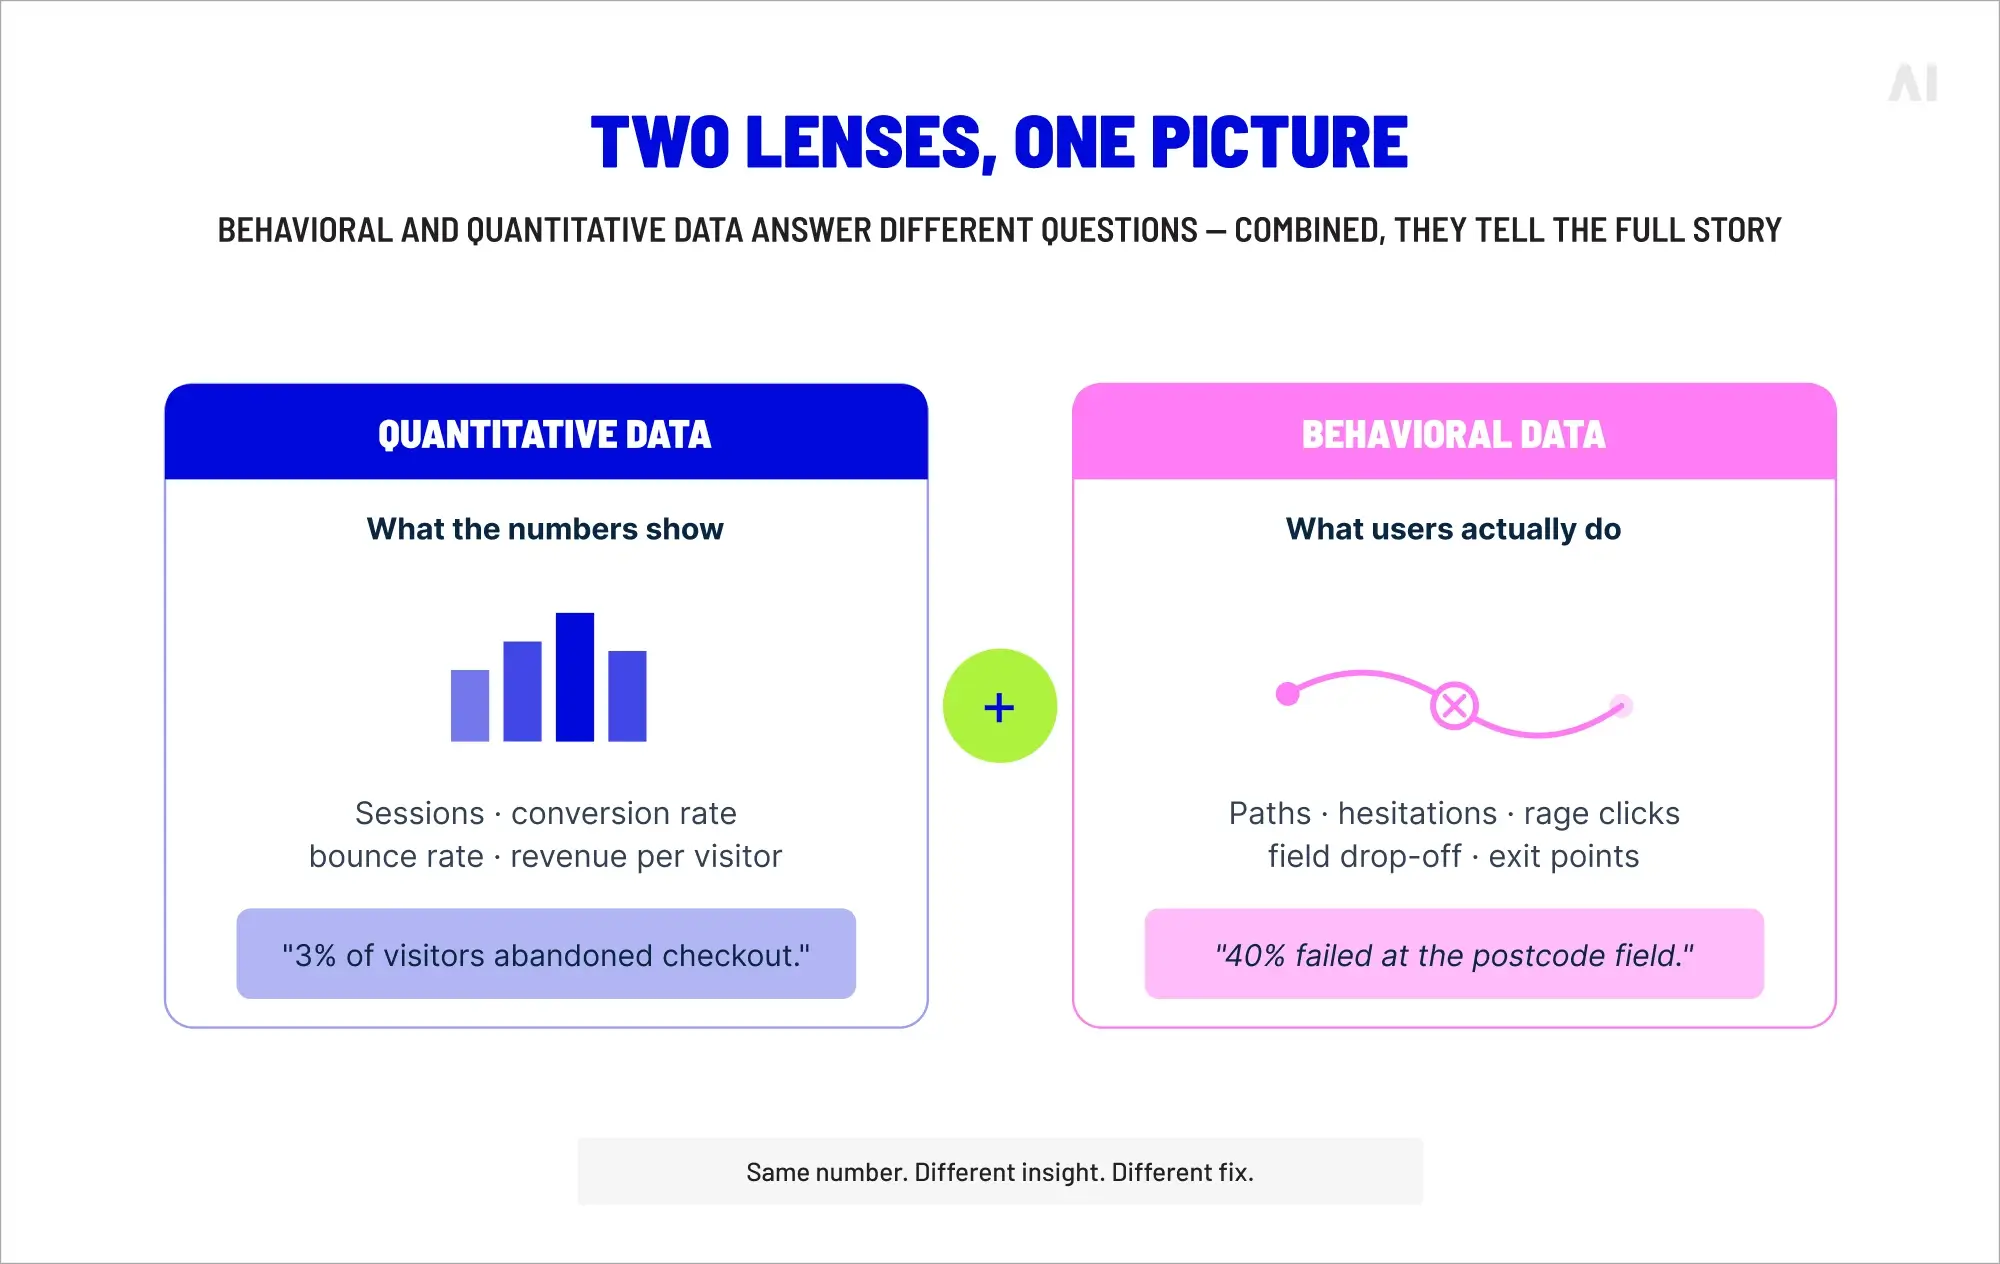
Cohort analysis compares groups of customers based on shared characteristics or behaviors. These cohorts may be grouped by acquisition source, first purchase date, campaign exposure, product category, lifecycle stage, or engagement level.
💡This is useful because aggregate reporting can hide important differences. Two campaigns may produce the same number of conversions, but one may attract customers who return, upgrade, or spend more over time. Another may bring in users who convert once and never come back.
Ecommerce optimization
For ecommerce brands, customer journey analytics helps identify why shoppers abandon carts, delay purchases, or fail to return after the first order. It connects product views, search behavior, reviews, email clicks, ad exposure, discounts, support questions, and checkout activity into one journey view.
This helps ecommerce teams improve:
- Product discovery
- Checkout flows
- Cart recovery campaigns
- Cross-sell and upsell journeys
- Repeat purchase timing
- Loyalty and retention programs
For example, if customers often abandon after seeing shipping costs, the issue is not only a checkout problem. It is a journey communication problem. The brand may need clearer delivery information earlier in the experience.
⚡️AI Digital’s article on hyper-personalization explains how better customer data can support more relevant ecommerce experiences.
Churn analysis
Churn analysis uses journey patterns to identify customers who may stop buying, cancel a subscription, or become inactive. Instead of waiting for churn to happen, businesses can look for early warning signals.
Common churn signals include:
- Fewer logins or app sessions
- Lower email engagement
- Repeated support tickets
- Declining product usage
- Missed renewals or payment issues
- Reduced purchase frequency
Customer journey analytics helps teams see which combinations of signals matter most. A single support ticket may not indicate risk, but repeated support issues combined with falling usage and no response to lifecycle emails may show a higher chance of churn.
Predictive analytics
Predictive analytics uses customer behavior patterns to estimate what may happen next. In customer journey analytics, this can help teams predict churn risk, conversion likelihood, product interest, upgrade potential, or next-best action.
For example, a customer who visits pricing pages several times, opens product emails, and compares plans may be ready for sales outreach. A customer who stops using key features after onboarding may need support or education before they churn.
⚡ ️Predictive analytics becomes stronger when it uses connected journey data rather than isolated channel metrics. AI Digital’s article on AI-driven personalization explains how AI can use behavioral signals to deliver more relevant experiences across channels.
Activating cross-channel journey insights
Customer journey analytics becomes valuable when insights move from reporting into action. It is not enough to know that customers abandon a journey, delay a purchase, or show churn risk. Businesses need to use those signals to trigger the next best interaction across email, in-app messaging, advertising, CRM, sales, and support.
This is where journey analytics connects with real-time customer engagement. When customer data is unified, teams can respond based on behavior rather than broad segments. For example, a customer who views pricing three times may receive a sales follow-up. A shopper who abandons a cart may receive a personalized reminder. A subscriber with falling usage may enter a retention workflow before they churn.
The need for faster, more contextual engagement is clear:
- 72% of customers want immediate service, according to Zendesk’s 2026 customer experience research.
- 70% of customers expect anyone they interact with to have full context, which means disconnected journey data can directly weaken the experience.
- Adobe’s 2026 research shows that businesses are moving toward customer engagement that is personalized, anticipatory, and responsive in real time.
💡For marketers, this changes the role of analytics. Customer journey analytics is no longer only a diagnostic tool. It becomes an activation layer that helps teams decide what message, offer, channel, or workflow should happen next.
⚡️AI Digital’s article How AI Platforms Improve Cross-Channel Marketing Performance explains how AI systems use these signals to improve execution across channels.
⚡️From Data to Decisions: How Marketing Intelligence Transforms Performance Strategy goes deeper into how analytics becomes operational decision-making.
Behavioral triggers
Behavioral triggers are automated responses based on customer actions or signals. They help businesses react at the right moment instead of waiting for a scheduled campaign.
Common behavioral triggers include:
- Email triggers after cart abandonment, product browsing, form fills, or content downloads.
- In-app messages based on feature usage, onboarding progress, or inactivity.
- Advertising triggers that retarget customers based on product interest or lifecycle stage.
- Sales triggers when a lead shows high-intent behavior, such as repeated pricing-page visits.
- Support triggers when a customer shows frustration, repeated errors, or unresolved issues.
⚡️These workflows depend on connected data. If email, CRM, website, app, and paid media data remain separate, triggers may arrive too late, repeat the wrong message, or ignore important context. Integrated Marketing Systems: Why Connected Operations Drive Better Performance explains why activation works better when data, teams, and workflows are connected.
Personalization and next-best actions
Journey insights also improve personalization and next-best-action decisioning. Instead of personalizing only by demographic segment, businesses can respond to real behavior across the customer journey.
For example, a returning ecommerce shopper may see recommendations based on browsing history, purchase frequency, loyalty status, and abandoned products. A SaaS user may receive onboarding content based on the features they have not adopted yet. A B2B lead may be routed to sales when multiple stakeholders from the same account show buying intent.
Next-best-action systems use customer journey data to decide:
- Which message is most relevant
- Which channel is most appropriate
- Which offer or recommendation should appear
- Whether the customer needs education, support, sales, or retention
- When the business should avoid sending another message
⚡️This makes personalization more useful and less intrusive. The goal is not to increase the number of interactions. The goal is to make each interaction more relevant to the customer’s current context. Creating a Data-Driven Marketing Strategy explains how businesses can build the data foundation needed for this kind of decision-making.
Solving cross-channel fragmentation with AI Digital
Cross-channel fragmentation is one of the biggest barriers to effective customer journey analytics. When media, CRM, web, mobile, and conversion data sit inside separate systems, marketers cannot clearly see how customers move across the journey. Each platform may report its own version of performance, but that does not always create a reliable view of the full customer journey.
AI Digital addresses this problem through its Open Garden Framework, a DSP-agnostic operating model designed to improve transparency, measurement consistency, and cross-platform control. Instead of relying only on closed platform reporting, Open Garden helps advertisers connect media execution, data interpretation, and optimization around business outcomes.
This matters for journey analytics because fragmented data leads to fragmented decisions. A campaign may look successful inside one platform, while the broader analytics customer journey shows duplicated conversions, weak retention, or limited contribution to long-term value.
⚡️AI Digital’s article on data fragmentation in advertising explains how disconnected data can distort performance decisions. Its guide to the Open Garden Framework shows how vendor-neutral architecture, curated supply, AI-powered execution, and unified measurement can work together as one operating model.
Why walled gardens limit journey analytics
Walled gardens can deliver strong reach, targeting, and optimization inside their own ecosystems. The limitation is visibility. When platforms restrict access to user-level data, measurement logic, and cross-platform comparison, marketers struggle to understand how each touchpoint contributes to the wider customer journey.
This creates several problems for customer journey analytics:
- Restricted data access limits visibility into what happened before, between, and after platform interactions.
- Platform-defined metrics can make each channel look successful in isolation.
- Duplicated conversions can inflate performance when several platforms claim credit for the same outcome.
- Limited interoperability makes it harder to connect paid media exposure with CRM, ecommerce, offline, or retention data.
- Attribution accuracy declines when the model cannot see the full sequence of customer interactions.
⚡️The result is not just incomplete reporting. It is weaker decision-making. AI Digital’s article on alternatives to walled garden reporting explains why advertisers need more independent measurement structures when platform-reported metrics create blind spots.
Journey intelligence with Elevate
Elevate is AI Digital’s intelligence layer for turning fragmented media and customer data into clearer planning, optimization, and measurement decisions. For customer journey analytics, this kind of intelligence layer helps teams move beyond static reporting and understand which audiences, paths, and campaign actions are most connected to business outcomes.
Elevate supports this by bringing together audience analysis, path-to-conversion insights, marketing mix modeling, and AI-powered campaign optimization. It is designed to help marketers understand not only which campaigns performed, but why performance changed and where action should happen next.
This is important because journey analytics is not useful if insights stay trapped in dashboards. Teams need to translate customer behavior into campaign decisions, budget changes, audience strategy, and cross-channel activation. AI Digital’s article on marketing intelligence platforms explains how intelligence layers connect data, analysis, and decision-making. The article on transparent AI media intelligence shows how Elevate supports faster planning, optimization, and real-time insight.
Smart Supply for outcome-based buying
Smart Supply extends this approach into programmatic media buying. It uses AI-driven optimization, transparent supply paths, and KPI-based deal structures to improve campaign performance across channels.
For customer journey analytics, Smart Supply matters because media quality affects journey quality. If inventory is low quality, opaque, or misaligned with campaign goals, journey data becomes harder to trust. Marketers may see impressions, clicks, or conversions, but those signals may not reflect meaningful customer progress.
Smart Supply helps improve this by focusing on:
- Outcome-based supply aligned with campaign KPIs.
- Transparent media buying with clearer visibility into supply paths.
- AI-powered optimization that adjusts deals based on performance.
- Traffic quality controls that reduce wasted spend and weak inventory.
- Cross-channel efficiency by connecting buying decisions to measurable outcomes.
Together, Open Garden, Elevate, and Smart Supply create a more connected approach to journey intelligence. Open Garden provides the transparent operating model, Elevate turns fragmented signals into strategic insight, and Smart Supply helps activate those insights through outcome-based media buying.
Evaluating customer journey analytics tools
Choosing a customer journey analytics platform is not only a software decision. It is a data, measurement, activation, and operating model decision. The best tool for one company may fail in another if the data stack, identity strategy, and activation workflows are not ready.
Businesses should evaluate customer journey analytics tools based on five core areas:
- Integrations: Can the platform connect CRM, CDP, web, mobile, paid media, ecommerce, support, and offline data?
- Identity resolution: Can it connect customer interactions across devices, sessions, channels, and accounts?
- Reporting flexibility: Can teams build custom journey views, cohorts, paths, funnels, and lifecycle reports?
- Activation capabilities: Can insights trigger audiences, campaigns, alerts, personalization, or sales workflows?
- Scalability: Can the platform handle growing event volume, data complexity, compliance needs, and user access?
⚡️AI Digital’s article Best Marketing Intelligence Platforms in 2026: Comparison & Use Cases will compare broader intelligence platforms by use case, but customer journey analytics needs a more specific lens. The platform must not only report on customer behavior. It must help teams understand and act on that behavior across the full customer journey.
Questions to ask CJA vendors
The strongest vendor questions reveal how the platform works in practice, not just how it is positioned in sales materials. Before choosing a customer journey analytics platform, teams should ask:
- How does identity resolution work? Ask whether matching is deterministic, probabilistic, account-based, household-based, or dependent on third-party IDs.
- How long does it take for events to become available? Event-to-availability latency affects real-time reporting, behavioral triggers, and next-best-action workflows.
- How flexible is the event schema? A rigid schema can limit how teams define journeys, lifecycle stages, products, accounts, or custom behaviors.
- Which connectors are native, and which require custom engineering? Connector depth matters more than the number of logos on a partner page.
- Can the platform combine online and offline data? This is critical for businesses with call centers, stores, field sales, events, or partner channels.
- How does pricing scale with event volume, seats, profiles, or destinations? A platform that is affordable during proof of concept may become expensive at enterprise scale.
- Can insights be activated? Ask whether the platform only reports journeys or can push audiences, alerts, and decisions into marketing and sales systems.
Adobe CJA vs. Warehouse-centric analytics
Adobe Customer Journey Analytics is often evaluated by enterprise teams that already use
Adobe Experience Cloud or need a packaged environment for cross-channel analysis. Adobe describes CJA as a way to connect customer identities and interactions across channels, devices, and time. This makes it useful for teams that want a structured experience platform with journey analysis, segmentation, and reporting built into a broader enterprise ecosystem.
Warehouse-centric analytics takes a different approach. Instead of making the CJA platform the main system of record, the data warehouse becomes the foundation. Tools such as Amplitude, Mixpanel, dbt, and BI platforms can then support behavioral analysis, governed metrics, dashboards, and self-service reporting on top of warehouse data.
Build vs. Buy CJA platforms
The build-vs-buy decision depends on data maturity. There is no universal answer.
- A bought CJA platform is usually better when the business needs faster deployment, packaged reports, built-in integrations, vendor support, and activation features. This works well for teams that do not want to build journey analytics infrastructure from scratch.
- A composable or built approach is usually better when the business has mature data engineering, a trusted warehouse, custom event models, strict governance needs, and high event volume. This gives teams more control over data definitions, modeling logic, cost structure, and long-term flexibility.
A simple decision framework:
- Buy if speed, built-in workflows, vendor support, and integration depth matter most.
- Build if data ownership, customization, governance, and cost control at scale matter most.
- Use a hybrid model if the warehouse is the source of truth, but marketing teams still need packaged activation and self-service journey reporting.
💡For most enterprise teams, the winning model is not purely build or buy. It is a connected architecture where data infrastructure, customer journey analytics, marketing activation, and measurement governance work together.
Customer journey analytics failures
When customer journey analytics underdelivers, the problem is rarely the dashboard alone. Most failures come from structural issues: incomplete data, weak identity resolution, privacy gaps, disconnected teams, or journey models that do not reflect how customers actually buy.
A CJA implementation can have many metrics and still fail to produce useful insight. If customer interactions are not connected across systems, the platform may only show isolated activity. If consent signals are incomplete, entire journey segments may be legally unusable. If reports stay inside the data team, insights may never reach the marketers, product teams, sales teams, or customer experience leaders who can act on them.
Common failure patterns include:
- Too many disconnected metrics and not enough linked journey data.
- Weak identity resolution across devices, accounts, and sessions.
- Privacy and consent gaps that limit what data can be collected or activated.
- Organizational silos that keep journey insights away from decision-makers.
- B2B journey models that treat accounts like individual consumers.
- Dark funnel blind spots where important buying activity happens outside owned
⚡️AI Digital’s article Why Marketing Measurement Is Broken in Today’s Digital Ecosystem goes deeper into the structural reasons traditional measurement systems struggle in fragmented environments.
Incomplete journey data
Incomplete journey data happens when teams track many events but cannot connect them into one customer journey. A business may have web analytics, CRM data, paid media reports, email engagement, sales notes, and support tickets, but if those systems do not share identity, timing, and journey context, the data remains fragmented.
💡This creates a dangerous pattern: teams appear data-rich but remain insight-poor.
Signs of incomplete journey data include:
- The same customer appears as multiple users across web, mobile, CRM, and support tools.
- Paid media platforms report conversions that cannot be reconciled with CRM or sales data.
- Reports show channel performance but not customer path behavior.
- Offline sales or call center interactions are missing from journey models.
- Teams cannot explain why high-intent users fail to convert.
The recovery path is to audit journey data around identity, not just events. Teams should ask which customer identifiers exist in each system, where they break, and which touchpoints are excluded from the connected journey.
⚡️AI Digital’s article on marketing effectiveness measurement challenges explains why fragmented measurement weakens the link between marketing activity and business outcomes.
Privacy and consent gaps
Privacy and consent gaps can make parts of the customer journey legally or technically uncapturable. This is not only about cookie deprecation. In 2026, the larger issue is signal loss across browsers, mobile platforms, consent frameworks, privacy regulation, clean room environments, and data residency requirements.
If a company does not have clear consent infrastructure, it may collect data it cannot activate or lose data it needs for analysis. If consent preferences are not passed consistently across systems, journey analytics may become unreliable or non-compliant.
Common privacy-related failure points include:
- Consent choices are captured on the website but not passed into CRM, CDP, or media systems.
- Data residency rules limit where customer data can be stored or processed.
- Third-party identifiers are unavailable, restricted, or inconsistent across browsers and platforms.
- Teams rely too heavily on user-level tracking where aggregated or modeled measurement would be safer.
- Clean room, first-party data, and consented identity strategies are introduced too late.
💡The recovery path is to design customer journey analytics around privacy from the start. Businesses should prioritize first-party data, consented identifiers, server-side tracking where appropriate, privacy-safe data collaboration, aggregated measurement, and modeled insights.
The goal is not to capture everything. The goal is to preserve analytical integrity while respecting legal and customer trust boundaries.
Organizational silos
Customer journey analytics also fails when it lives only inside the data team. A technically strong CJA setup can still underdeliver if the insights do not change marketing, sales, product, support, or customer experience decisions.
This usually happens when teams define success differently. Marketing may focus on acquisition. Sales may focus on qualified pipeline. Product may focus on usage. Customer success may focus on retention. If these teams use different systems and metrics, the customer journey becomes internally fragmented.
Signs of organizational silos include:
- Journey reports are produced but not used in campaign planning.
- Customer experience teams do not see the same journey data as marketing.
- Sales and marketing disagree on lead quality because they use different signals.
- Support insights are not connected to churn or retention analysis.
- No team owns the full journey across acquisition, conversion, and retention.
⚡️The recovery path is organizational, not only technical. Teams need shared journey KPIs, cross-functional review cycles, common definitions of lifecycle stages, and clear ownership for activation. Why Fragmented Martech Stacks Kill Marketing Performance explains how disconnected systems and teams reduce marketing effectiveness.
Understanding B2B customer journeys
B2B customer journey analytics is different from consumer journey analytics. B2B journeys are usually longer, more complex, and more account-based. A single purchase may involve multiple stakeholders, several departments, procurement steps, demos, legal review, finance approval, and offline conversations.
This means B2B journey analytics cannot focus only on individual behavior. It must connect activity across people, roles, accounts, and buying stages.
Important B2B journey signals include:
- Multiple stakeholders from the same company visiting high-intent pages.
- Repeated engagement with pricing, comparison, security, or implementation content.
- Webinar attendance, demo requests, sales calls, and proposal activity.
- CRM stage changes, sales notes, procurement signals, and customer success interactions.
- Intent data, review activity, analyst research, and partner influence.
⚡️AI Digital’s article Best Attribution Models for B2B and Long Sales Cycles explains why B2B attribution needs to account for long decision windows, multiple decision-makers, and offline influence.
Account-level journey tracking
Account-level journey tracking connects interactions from multiple stakeholders within the same buying account. This is essential for B2B teams because one person may research the product, another may attend a demo, another may review pricing, and another may approve the final purchase.
Without account-level tracking, these actions may look unrelated. With account-level journey analytics, they become part of one buying journey.
This helps B2B teams understand:
- Which accounts are showing rising intent.
- Which roles are involved in the decision.
- Which content supports different buying stages.
- When sales should follow up.
- Where deals stall before conversion.
⚡️AI Digital’s article on account-based marketing explains how account-level strategy helps marketers focus on high-value buying groups rather than isolated leads.
Mapping the B2B dark funnel
The B2B dark funnel includes buying activity that happens outside owned analytics systems. This may include peer recommendations, private Slack groups, LinkedIn conversations, review sites, analyst reports, podcasts, communities, events, and internal buying committee discussions.
These signals are difficult to track directly, but they still shape the customer journey. A prospect may hear about a vendor in a private community, compare options on a review site, discuss the shortlist internally, and only then visit the website or contact sales. Standard analytics may treat that visit as the beginning of the journey, when it is actually a late-stage signal.
Teams can map the dark funnel by combining:
- Self-reported attribution fields
- Review and comparison-site analysis
- Intent data
- Sales call notes
- Community and social listening
- CRM opportunity history
- Content engagement by account
The goal is not perfect visibility. It is better inference. Strong B2B customer journey analytics recognizes that some influence will always remain partially hidden, so teams need both observable data and structured qualitative signals to understand how buying decisions actually form.
Turning journey insights into competitive advantage
Customer journey analytics is evolving from static reporting into real-time cross-channel decision-making. For modern brands, the goal is no longer only to understand what happened in a campaign. The real advantage comes from connecting customer behavior, media performance, and business outcomes into one operating model.
This is where AI Digital’s approach is different. Through its Open Garden Framework, Elevate, and Smart Supply, AI Digital helps businesses move beyond fragmented platform reporting and toward a more transparent, intelligence-led way to plan, measure, and optimize customer journeys.
💡To turn journey insights into competitive advantage, businesses need five connected capabilities:
- Unified cross-channel data: Customer interactions from web, mobile, CRM, paid media, ecommerce, support, and offline channels need to be connected into one usable journey view.
- Transparent measurement: Marketers need visibility beyond closed platform dashboards, especially when walled gardens limit cross-channel comparison.
- AI-powered intelligence: Journey data should help teams identify behavioral patterns, predict outcomes, and understand which actions are most likely to improve performance.
- Outcome-based activation: Insights should not stay inside reports. They should inform media buying, audience strategy, personalization, sales follow-up, and retention workflows.
- Privacy-first infrastructure: Customer journey analytics must work within consent, data governance, platform restrictions, and changing privacy requirements.
Key takeaways:
- Customer journey analytics is becoming an operating system for growth. It should guide acquisition, conversion, retention, and lifecycle optimization.
- Attribution alone is no longer enough. The article Unified Marketing Measurement: Why Attribution Alone No Longer Works will explain why brands need connected measurement models that go beyond conversion credit.
- AI is only as useful as the data foundation behind it. Fragmented systems, weak identity resolution, and inconsistent measurement limit the value of predictive insights.
- Transparency creates better decisions. AI Digital’s Open Garden approach helps marketers reduce dependency on closed ecosystems and improve visibility across channels.
- Activation is where journey intelligence becomes business value. Elevate helps turn fragmented signals into strategic insight, while Smart Supply supports outcome-based buying that connects media investment to measurable performance.
AI Digital helps brands build a more connected model for customer journey analytics: one that combines intelligence, transparent media execution, and outcome-based optimization.
⚡️To explore how AI Digital supports cross-channel performance, visit what we do or get in touch to discuss a more connected approach to journey intelligence.